Location via proxy:   [ UP ]  
[Report a bug]   [Manage cookies]                
Article

A Digital 4D Information System on the World Scale: Research Challenges, Approaches, and Preliminary Results

Digital Humanities, Friedrich Schiller University Jena, D-07743 Jena, Germany
*
Author to whom correspondence should be addressed.
Appl. Sci. 2024, 14(5), 1992; https://doi.org/10.3390/app14051992
Submission received: 28 December 2023 / Revised: 11 February 2024 / Accepted: 18 February 2024 / Published: 28 February 2024

Abstract

:
Numerous digital media repositories have been set up during recent decades, each containing plenty of data about historic cityscapes. In contrast, digital 3D reconstructions of no longer extant cityscapes have so far almost solely been performed for specific cases and via manual modelling techniques. Within the Jena4D research group, we are investigating and developing methods and technologies for transferring historical media and their contextual information into 4D models. The next step will be to automate this process and extend it to the world scale. Our team are working on different facets of that endeavor: retrieving images, text, and object data from public sources; crowdsourcing and collecting qualitative data from contests and pupil labs; processing historical plans and photographs to extract spatial data; location-based mobile visualization; and collection-browsing interfaces. This article is intended to highlight (1) current challenges, (2) the state of the art, (3) our approach to 4D modelling and visualization on the world scale, and (4) results from testing demo cases in Dresden, Jena, and Amsterdam.

1. Introduction

Imagine you are exploring the historic center of a city with its impressive town houses, churches, and monuments. What if you could just use your mobile device to find out about the historic buildings around you, with detailed visual information about how they were built and the story behind them, making history come alive before your eyes? Photographs, texts, and plans are essential sources for historical research [1,2,3]. Numerous archives and repositories have been set up and nowadays they contain large-scale digital media collections. Within the Jena4D research group, we are investigating and developing methods and technologies for transferring historical media and their contextual information into a 4D—3D spatial and temporal scaled—model to support research and education on urban history. Content is made accessible as a location-dependent, virtual reality, 4D browser application for mobile devices. In previous articles, we presented the research agenda [4] and technological venues [5,6]. The aim of this article is to examine (1) current challenges; (2) the state of the art; (3) our approach to data collection, 4D modelling, and visualization on the world scale; and (4) results from testing within demo cases in Dresden, Jena and Amsterdam.
Against this background, this article is proposed to provide a comprehensive picture of the methods and techniques and their utilization for 4D world visualization. In our work, we apply a highly multifaceted approach to collect, process, and visualize data. The first part of this article provides a comprehensive overview of the state of the art in related fields. In the second part, we present a set of demonstrations and approaches we have conducted to assess and setup components of a 4D information system.

1.1. Motivation

Concerning the use of 4D information systems for cultural heritage, two general modes are discernible: browsing, which a self-directed search of historical information and sources [7], and location- or context-related information that is shared in the course of the presentation of the culture. With our software applications, we strive to serve two main usage scenarios: to supply city visitors with location-based mobile information and to enable scholars to browse media collections via a 4D browser application.

1.1.1. Cultural Tourism as the Application Scenario

Virtual historic cityscapes are employed in various scenarios [8,9,10,11], for example, to teach history and heritage in informal settings such as museum experiences, serious games, or television broadcasts [12,13,14,15,16,17,18,19,20,21,22]. For example, interactive applications for city exploration [23,24,25] allow virtual visits and remote spatial learning [26], guide visitors through the city [25,27,28], provide access to additional information, and allow users to gain a virtual view of temporal changes, historical spaces, buildings and monuments, or covered parts [9,28,29,30,31,32,33]. Extended reality (XR) includes different levels of augmentation of reality with computer-generated content. This is mostly visual content, ranging from augmenting real-world views with information or graphical elements (augmented reality, AR) to fully computer-generated virtual worlds (virtual reality, VR) [34]. Several application scenarios are specifically relevant to cultural heritage (see recent works [8,9,31]). A frequently discussed scenario is the use of XR for 4D city exploration [23,24]. Various sub-scenarios can be supported by XR applications [25]:
  • Before visiting the place of interest, XR applications can be used to obtain inspiration or an image of the place [35] or plan a visit [25].
  • During a visit, XR applications can help guide visitors through the city [25], offer virtual city tours [27,28], provide information about the city’s history and also about amenities (e.g., restaurants) [36], allow users to obtain a virtual view of temporal changes, historical spaces, buildings, and monuments [9,29,30,31,32], and provide a visual impression of hidden or covered parts [28,33].
  • Following a visit, XR applications can assist users in recalling tours and visits, or provide access to places that visitors have not been able to visit [25].

1.1.2. Browsing Collections

Virtual research environments (VREs) are web-based systems that provide a virtual working environment for researchers by including various tools for data processing, analysis, or comparison [37]. For cultural heritage research, a large number of VREs are available, serving the specific demands of researchers in fields like archaeology [38] or architectural history [39]. Depending on the user group, there are different requirements; e.g., history research requires the comparability and contextualization of sources [40,41,42,43]. Furthermore, a transparent relationship between source and representation is essential [44,45]. Finally, visualization should ideally allow the identification of abstract characteristics such as ideas and systems, breaks, or deviations [46,47]. As stated by Beaudoin, the most critical challenge of these repositories is the accessibility of high-quality content [48]. Even if portals such as Europeana [49] make different types of cultural heritage data available via a single user interface, they provide abstract views rather than enabling spatio-temporal contextualization. In this context, 3D and 4D interfaces are used to structure knowledge and information. (a) Digital inventories, such as the spatial book (“Raumbuch”) approach [50,51] in archaeological excavation and similar archaeological excavations and similar approaches for monument documentation [52], focus on the spatial organization of digital data. (b) Digital information spaces, such as the digital twin in manufacturing [53], extend the inventory through fully digital simulation workflows but focus on contemporary data. (c) Four-dimensional models, e.g., city models, add a temporal layer to organize the temporal layer and to organize the data in a 4D inventory, e.g., [54]. Finally, the Metaverse approach tries to include the previously mentioned facets [55].

1.2. The Vision

Our vision is to develop a 4D model and visualization on the world scale. Usage scenarios are (a) virtual visits and on-site assistance, and also (b) browsing through large-scale data collections. The frontend features of the proposed interface are:
  • To enable visual 4D impressions and access to further information (e.g., Wikipedia articles about landmarks).
  • To work on mobile and desktop devices to enable both location-based and remote access to information.
  • To function in a browser rather than a native app, since the mentioned application scenarios target occasional use on different devices [56].
The backend features of the proposed interface are:
  • The world scale, created via an automated pipeline based on historical photographs and map data retrieved from various large-scale data sources.
  • Tools that operate on application layers with minimal data infrastructure.
  • The ability to retrieve information on the fly from multiple open data endpoints.

2. State of the Art

2.1. Data Collection

2.1.1. Citizen Science and Crowdsourcing

The creation of user-generated content is strongly supported by the availability of mobile phones and open-source 3D modeling tools. In terms of the level of participation, most citizen science projects use crowdsourcing to involve “non-scientists to help to analyze or collect data as part of a researcher-led project” ([57], p. 259). Examples include collecting and processing images [58] and crowd-based creation of 3D models [59,60]. Co-design “involves citizens into the research process from its beginnings, or the stimulus for the research project originates from the citizens” ([61], p. 4). Although most prominent in text- or image-based research in humanities [62], co-design is frequently used for 3D content and experience design for museums [63,64] or (serious) history games (e.g., [65]). Besides the challenges of participatory processes such as user activation and management, task definition, and quality control [66], citizen science tasks in humanities must handle complex, non-standardized, and knowledge-intensive tasks and therefore are hard to assess with regard to the scientific quality of processes and outcomes [67,68]. Finally, citizen science approaches have found their way into research and teaching in various university disciplines in recent years [69], including digital heritage (e.g., [70]). In this context, knowledge transfer to citizen scientists creates particular didactic challenges [71]. This is not least because the target or interested group for cultural heritage projects are often not digital natives and has to be addressed via other channels [72]. Knowledge transfer via digital citizen science activities nevertheless appears to be a promising approach, as public involvement in generating knowledge increases the willingness to engage with cultural heritage.

2.1.2. Data Retrieval

During the last two decades, numerous digital image archives containing vast numbers of photographs have been set up [7,73]. These comprise collections of user-generated contemporary photographs, historic photo collections and image databases with geographic coverage, e.g., Street View. For the 3D world, recently, large-scale datasets, such as Objaverse, including 10.2 million 3D models [74], and ShapeNet, including 50 k 3D models [75], and repositories such as Sketchfab, hosting several hundreds of thousands of heritage items [76], have been compiled. As an overlapping area, there are several automated 3D model creation processes that utilize extant imagery [77,78,79,80]. A major task is the provision of sufficient metadata to spatialize and temporalize this material [81].

2.1.3. Teaching Digital Competencies via Heritage

Three-dimensional heritage has become subject of teaching digital literacy and skills, e.g., on modelling techniques or VR technologies, while the historical object is used as a training example. This closely relates to the concept of data literacy comprising data collection, exploration, management, analysis, and visualization skills [82] (see also [83]). Moreover, digital 3D reconstruction techniques have been employed in various educational settings, focusing on the process of the reconstruction of cultural heritage objects (e.g., [84,85]). Despite these activities, there is still no wide consensus on establishing a specific digital visual humanities education paradigm, and larger studies on teaching digital methods in visual humanities are still needed [84].

2.1.4. Summary: Retrieval Challenges

  • Despite a large amount of digital and digitized data, a major issue is the findability and missing information about spatial and temporal properties (e.g., the viewport).
  • Crowdsourced data collections are particularly well established, but challenging with regard to engaging users on a large scale.
  • Teaching digital skills via heritage is frequently used but a consensus is lacking on educational paradigms and methods.

2.2. Four-Dimensional Modelling

The main criticism of interpretative 3D reconstruction of no longer extant objects is that—due to the limitations and specifics of historical sources—source interpretation and the modelling process via expert tools rely heavily on tacit knowledge [86,87]. Thus, digital reconstructions are primarily created by multidisciplinary teams involving specialist modelers and historians [88]. In addition, due to the high level of effort, reconstruction is primarily used only for single objects. Despite various large-scale projects on 3D modelling in cultural heritage (recent overview: [89]), which primarily focused on 3D digitization from contemporary survey data [90,91,92,93], 3D/4D reconstruction from historical imagery still faces challenges. The main currently unsolved challenges in computer visualization based on photographs and vedutas are (1) identifying matching historical images from the multitude of digitized documents available and (2) calculating 4D information as a prerequisite for automated model generation [6,94]. In what follows, relevant technological approaches are highlighted.

2.2.1. Human-Driven 3D Reconstruction

In a digital reconstruction of no longer extant architecture, humans use computer software to create models. The 3D model is generated manually using interactive software tools. Human-driven digital reconstructions mostly utilize standardized software, which originates from different domains like geo information systems (GISs), computer graphics (CGI), computer-aided design (CAD) or building information modelling (BIM) [95,96], each with their own standards. All approaches recommend specific tools and workflows and offer specific benefits, whether this is information on object volumes (BIM), a highly realistic appearance of surfaces (CGI), accurate dimensions (CAD) or large-scale geo-referenced information (GISs). In all cases, human-driven 3D reconstructions are created within a highly versatile (but labor-intensive) and highly experience-based process.

2.2.2. Algebraic Approaches

The algebraic analysis of groups of images to calculate spatial information has a long history. Due to advances in both the quality and availability of camera hardware and image analysis software [90], most digitized models are now produced using photogrammetry. A well-established method is the 3D modelling of architectural heritage from current native digital photographs or video content using photogrammetric algorithms. The development of various feature matching methods [97,98] and their integration into the structure-from-motion (SfM) workflow has led to their widespread use [77,99,100,101,102,103]. Today, a wide variety of image spatialization algorithms are available [104,105,106], and photogrammetry is used in various fields such as landscape surveying [107], underwater archaeology [108], and monument recording [109]. While current algorithms achieve remarkable quality for natively digital (sequential) images, they often fail with unordered historical images due to the high quality and number of input images required [100,110,111]. As a result, current approaches often achieve a low quality or fail to process historical non-native digital imagery due to sparse sampling, incompleteness, missing metadata and a problematic radiometric quality [98]. These are not only technical but fundamental barriers, and despite much research, current photogrammetry dealing with historical images [94,112], such as re-photo approaches [113,114], still requires a lot of manual processing. Initial attempts to advance photogrammetry from historical images using video [115] or—invented by our group—architectural-feature-based photogrammetry [116] and a combination of algebraic and machine learning approaches [117] seem promising avenues for further automation, but algebraic processes still require a lot of prior optimization and multiple images of similar views.

2.2.3. Machine Learning and Hybrid Methods

Traditional algebraic approaches, such as in classical photogrammetry, employ equations, e.g., to detect, describe and match geometric features in images [97]. In contrast, machine learning is based on a statistical model developed via training data (or using self- and cross-attention layers in transformers), e.g., to detect features [118]. Current evolutions in computer vision are linked to the renaissance of machine learning since the 2010s [119], driven by the development of convolutional neural networks (CNNs, e.g., [120]). Machine learning approaches are currently mainly researched and employed for image and 3D point cloud analytics in cultural heritage (recent overview: [121]), but also increasingly serve 3D model creation tasks. There, machine-learning-based technologies are currently primarily used for particular tasks to preselect imagery [122,123], in semantic segmentation to classify parts of images [124,125,126] and to recognize and identify specific objects [126,127,128,129]. Traditional machine-learning-based technologies do require large-scale training data [121,126,127,128] and therefore are mainly capable of recognizing visually distinctive and well-documented landmark buildings [4]. These approaches usually fail to deal with less distinctive architecture, such as houses of a similar style, or fail when few images are available. Even using more advanced machine learning approaches or by combining different algorithms such as DELF and SuperGlue [130] only allows the realization of prototypic scenarios [6,131,132]. Another approach bypasses the modelling stage to generate visualizations directly from imagery [127,133,134], e.g., by transforming or assembling image content (recent image generators like DALL-E [135]). Recent approaches include neural radiance fields (NeRFs) [136,137], which predict shifting spatial perspectives even from single images [138], and can predict 3D geometries [139]. Generative adversarial networks (GANs) are a combination of proposal and evaluation components of machine learning. They are frequently employed as approximative techniques in 3D modelling, e.g., for single photo digitization [140], completion of incomplete 3D digitized models [141,142] and photo-based reconstructions [143]. Regarding transparency, most current machine learning approaches work within black box settings [121,144]. Although some newer machine-learning-based approaches are promising for processing small samples, they fail to process non-digital (historical) imagery with robustness and by design work on predictions; in addition, machine learning is limited by being grounded in historical original sources.

2.2.4. Structure Recognition from Plan Data

Although building footprints are still mainly manually extracted from historical maps, various AI-based approaches support this task. CNNs and—more recently—transformer approaches are used for the segmentation of historical maps [145,146,147,148,149]. Another approach to automatically generating 3D/4D models comprises building footprint recognition and parametric modelling. Footprint recognition via semantic segmentation for aerial/satellite imagery [150,151,152,153] or from current cadastral data [154] and for contemporary photography [155] has been frequently researched. One issue in boundary detection workflows is overlapping building boundaries and texts. Consequently, many approaches combine text recognition and boundary delineation [156,157,158,159] to trace building footprints.
Although current classifiers achieve good results for specific map styles and ages, they are not very transferable, so structure recognition has not reached a sufficient quality yet to be transferable without prior manual retraining of the detection system.

2.2.5. Generative Modelling

Generative modelling creates a 3D geometry iteratively based on pre-programmed rules [160]. In comparison to traditional modelling, which requires defining every single structure manually, this reduces effort and simplifies the modelling process by predefining the structural elements of objects and enables altering them on a parameter level (e.g., the properties and number of windows of a façade). Various projects use generative modelling for the ease of creating large-scale heritage structures such as complex 4D city models [161,162,163,164]. Another generative modelling technique structures the manual modelling process into single steps and translates them into digital-ontology-based workflows [165]. In our case, the combination of generative modelling rulesets with recognized footprints from historical cadaster data is of high relevance to ease model creation. This is currently under investigation in various projects [157,166,167].

2.2.6. Time

Time and non-linear temporal changes are the main elements of history. Current 3D/4D reconstructions still focus mostly on specific timestamps. This is challenging, since it requires multiple sources for these reconstructions, often taken at very different times and with each source a singular document of the represented state. Beside the issue of inter- or extrapolating sources of different times to gain a coherent historical view, dating of sources is challenging. Historical imagery is still primarily dated via metadata captured at recording or amended at later points. Where metadata are not available or certain, change detection can be applied to image series, e.g., to assess if undated images show corresponding states of construction to the dated ones. Current algorithmic change detection focuses on homogenous quality images, such as time series of satellite images [168,169,170] or aerial photos [171,172]. Approaches for heterogeneous photographs can deal with large-scale changes but are limited with subtle changes (overviews: [173,174,175]). Other change detection approaches work with 3D geometries (overview: [176]) or segmentation- and feature-based comparisons between different images to identify changes in architectural features [98,130]. The aim is to detect subtle changes in heterogenous historical imagery over time.

2.2.7. Transparency and Explainable Artificial Intelligence

Since algebraic approaches are reproducible, machine learning approaches are still primarily applied within black box settings with non-transparent decision making [121,144]. Consequently, a key research focus is explainable AI [177], or how to standardize and open AI-based classification processes. Unlike in, for instance, medical AI [178], an optimized heuristic interpretation is not sufficient for historical sources and their singularity [121]. Current approaches to employ AI in 3D cultural heritage applications validate their results only with examples [166]. Taking the singularity of history into consideration, there is a need to establish full-scale cross-validation of AI-based predictions of historical situations, e.g., by cross-validating mixed-methods or human-in-the-loop approaches.

2.2.8. Summary: 3D/4D Reconstruction Challenges

  • Three/four-dimensional modelling processes have to deal with non-linear historical spatial situations and must gain information from time-varying singular historical sources of heterogeneous quality.
  • Most approaches to automate the 3D/4D modelling process are optimized for specific purposes and therefore unable to cope with sparse samples and to detect differences with small variations.
Consequently, current 3D/4D reconstructions of past buildings are almost exclusively performed in manual workflows and—except in specific cases—fail with automation.

2.3. Visualization

2.3.1. Visualization Technologies

The created virtual 3D or 4D models are presented as dynamic and interactive visualizations, denominated extended reality (XR). XR technologies comprise a wide scope of approaches [179] between real and virtual [34]. This ranges from digital-enriched real environments—augmented realities (ARs) or augmented virtuality (AV)—to virtual reality (VR) as fully computer-generated visualizations. According to Russo [180], a blend between real and virtual elements can include adding information that does not exist, or can be subtractive by hiding or deleting parts of the real world. Despite the hype about glasses-based XR, 3D models and visualscapes are mostly accessed via mobile and desktop screens [181]. Various viewers, e.g., Smithsonian3D, 3DHOP, Potree, and DFG 3D Viewer (Overviews: [182,183,184]), are available and used in multiple projects. Other tools come from the gaming industry (Unreal and Unity engines) and are frequently used to visualize heritage content, while Google Earth or Apple Maps are world viewers but mostly lack the 4D history dimension. Some projects already use 4D viewers for city data, e.g., for Venice [158], Nicosia [185], and Trento [166]. To sum up, most open 3D visualization frameworks deal with single objects or specific scenarios (e.g., 3D specific buildings). Since they rarely include temporal changes, world viewers cannot yet visualize time-variant 3D architectural and city data on a large scale.

2.3.2. Interaction and Motivational Design

Visual appearance, user interaction, and presentation with 3D content pose design variables. In interaction design, XR applications enable multiple freedom degrees and requirements, such as for device motion interpretation [186,187]. For the acceptance of applications, their perceived usefulness is important, which depends on visual representation and interaction [188]. Layouts for user interactions are perspective-dependent and dynamic and require coherence [189,190]. Although the representation of time-independent data in interaction patterns has been investigated in several contexts [191,192], there are no fully validated strategies of how to manage this for time-dependent 4D data. Especially at sites and in cultural institutions, digital 3D applications are embedded in and connected to physical spaces. There are several recommendations for the design of linked physical and virtual spaces, such as in museums [193,194] and at heritage sites [195,196]. Recent evolutions comprise multi-user story-based virtual experiences to enrich physical museum visits by augmented experiences [197]. Motivational design includes linking content so users can easily consume or be motivated to follow it. As an example, gamification, using “elements of games that do not give rise to entire games” ([198], p. 2), is different from playful design that contains no specific rules or goals, and from serious games, which are defined as full-fledged games dedicated to non-entertainment purposes [198]. Storytelling is the use of fictional or non-fictional narratives to present a subject [199]. Psychological [200,201,202] and educational studies [203] have demonstrated that narratives can positively motivate by engaging the audience and making a subject more immersed, and therefore support learning by reducing the cognitive load. Storytelling is also widely used to present heritage content digitally [204] and support heritage education [205,206,207,208,209].

2.3.3. Visual Design and Perception of 3D/4D Content

Visual properties of 3D/4D visualizations heavily rely on device capabilities, e.g., screen properties (2D pixel monitors in smartphones, tablets, and desktops; 3D displays such as holographic displays, holograms, and 3D stereo displays; VR/AR headsets), interaction capabilities (input via mouse vs. touch vs. hand tracking; sensors) and usage scenarios (e.g., location-based vs. remote; mobile vs. desktop) [9,180]. Regarding design, influencing parameters include the level of detail (LoD), which needs to meet both the task and hardware requirements [210]. Detailed visualizations of historical reconstructions are advantageous for imaginability [211]. On the other hand, they are suspected of distracting scholars from their research questions [212] or causing cognitive overload [213]. There is a long-standing debate about the visualization strategies for 3D/4D reconstructions that are appropriate for historic architecture. The main positions include visual styling—to achieve realistic visualizations that are easy to understand and impressive for viewers—or schematic depictions showing hypotheses and schemes [210,214,215]. Visual style is frequently discussed regarding its fit to scholarly recommendations and as a potential distraction for viewers [44]. Since the majority of 3D/4D reconstructions still are aimed to be highly immersive and realistic visualizations [216], the full scope comprises a large variety of photorealistic and non-photorealistic styles [217,218,219]. Much research has been performed on the visualization of different degrees of certainty [214,220,221,222]. Current approaches can be roughly categorized into enrichment of representations by explanatory elements [223] and adaptation of representation quality, e.g., LoD or visual styling [210,214,215,224,225,226,227]. Scaling has been frequently assessed as an important parameter for perceiving architecture [210,228]. Visual acuity is the ability to distinguish details and is mainly influenced by the distance to a virtual or physical object [229,230,231,232]. Perspective depiction and perception include the effect of different fields of view [232,233,234,235]. Lighting refers to the shading of specific parts of an object [236] and is of high relevance for visual comparisons and the realism of virtual visualizations [237,238,239,240,241,242]. Color is also highly relevant for perception—in the case of historical objects, it ranges from realistic coloring and scales to code parameters or support, visually distinguishing model parts [243,244,245,246,247]. Methodologies for investigating the perception of digital visualizations are available but not comprehensively used yet to assess 3D/4D reconstructions. The traditional method is empirical user studies in experimental settings (e.g., [248]). As an extension of this paradigm, several data-driven user observation methods, e.g., eye tracking, are used to verify areas of attention (e.g., [210]). Three-dimensional XR spaces add the methodological challenge of mapping what the user sees, which can be achieved, e.g., via viewshed calculations in fully 3D spaces [232,249,250]. Despite much research, the main criticism is that studies of viewer effects are primarily descriptive rather than proven by user tests [230,251,252].
The quality of perception is influenced by visual parameters, such as size and shading (c.f., Gestalt theory [253], cognition psychology [254,255]); cultural settings including visual semiotics [256]; engagement [257]; and psychological processing such as visuospatial reasoning [211,258,259] or visual research [256,260,261]. User expertise with visualizing specific content is another parameter [262,263,264]: “visuality” [265], or, more precisely, “visual competence” [266] or “visual literacy” [267,268]. Architectural psychology distinguishes between two key factors influencing the perception of architecture: form structure, which includes elements such as color, form, spatial arrangement, movement, and depth [269], and form content [270], which includes dimensions such as cultural meanings, habits, and shock or novelty for the viewer [271]. Increased familiarity with specific content increases the ability to focus on specific aspects and visually recognize and understand even more abstracted content [272,273,274,275]. Although these factors are assumed to influence research processes in architectural history studies, it is currently unknown to what extent form structure and content affect the quality of perception and research.

2.3.4. Summary: 3D/4D Visualization Challenges

  • Current visualization technologies lack the capability for large-scale 4D architectural and city visualizations.
  • It is rarely empirically investigated what visual qualities are required to enable suitable interactive 3D/4D visualizations of past architecture in specific scenarios.
Within the constraints set by modelling, epistemics, and technical visualization frameworks, there are no validated comprehensive design recommendations for interactive 4D cityscapes.

3. Workflow Design

In our work, we apply a highly multifaceted approach to collect, process, and visualize data. In this chapter, we highlight the high-level design and interlinking of these components. Our pipeline comprises three steps: (1) to collect data as images, models, and information from multiple sources and via automated and community-based approaches and to (2) automatically form a model of a historical architecture and cityscapes via a 4D reconstruction from historical sources. (3) The model visualization is accessed in two ways: via a 4D browser and via location-dependent mobile XR.

3.1. Data Collection

Data were collected in various ways (Table 1). (a) To aggregate historical photographs of the city of Jena, we conducted a citizen contest in autumn 2022 (see Section 4.1.1). During this contest, over 4000 historical photos were submitted or rephotographed. (b) As another option for gathering 3D content, we implemented a low-end 3D digitization pipeline to document heritage with images taken with a smartphone—this was combined with a server-based 3D reconstruction (Section 4.1.2). (c) Data retrieval comprises approaches to gather images, links to information resources, and 3D models from different sources. So far, ca. 20,000 images and 4000 3D models have been retrieved (see Section 4.1.3). Educational courses comprise (d) two student modelathons to virtually recreate historic cityscapes (see Section 4.1.4) and (e) three courses designed by students (see Section 4.1.5), which were offered to primary and secondary school students in the context of school and extracurricular working groups and a project week in a youth center, and have now been made available to other teachers on a public platform. In total, 95 pupils participated in these educational courses.

3.2. Four-Dimensional Modelling

Our main approach (Table 2) is (a) to georeference historical plans and to extract building footprints (see Section 4.2.1). A parallel pipeline task is spatialization of historical photographs. The first step is (b) to collect and identify spatiotemporally corresponding images via textual image metadata (e.g., placenames) [78,279]. The next step is to detect similar views via overlapping segments in historical and contemporary photographs and to calculate relative positions via a feature-based orientation/positioning pipeline and combine them with contemporary, oriented data to identify absolute positions (see Section 4.2.2). On the city scale, (c) we created 3D buildings by expanding the footprints (extracted in a) to building walls, calculated the roof shape, and used the position and orientation (calculated in b) to map the photographs onto the façade. These steps mad it possible to create large-scale city models with basic geometric features (see Section 4.2.3). (d) For buildings where a sufficient number of historical photographs were available, we created higher-resolution 3D models from imagery (see Section 4.2.4). (e) The final step was to enrich data (see Section 4.2.5).

3.3. Visualization

Since 2016, our group has been developing a modular software framework for 4D web visualization and content browsing to test and validate design hypotheses in virtual, augmented, and 2.5D visualizations on mobile and desktop devices [215]. As user acceptance of native applications is decreasing [280], especially for specific and short-term use, and as it is relevant for most cityscape scenarios [281], this is a browser-based web application (Table 3). Both applications share a backend for handling data I/O (see Section 4.3.1).
The 4D City application for mobile devices (see Section 4.3.2) enables time-variant virtual 3D impressions of historic cities on a multi-device visual interface that can be accessed via desktops, mobile devices, and AR and VR glasses. The 4D City application feeds in real time from other data providers with a minimal database of its own, primarily for caching. It enables virtual city tours and past play (e.g., digitally enhanced discovery games) and provides access to knowledge assets from open-source platforms such as Wikipedia or tourist information platforms like Triposo.
The 4D Browser (see Section 4.3.3) is used for the information presentation and as a research tool [282]. Linking digital images and their actual location makes it possible to directly present resources and therefore proves a valuable support tool for historical research. Users of the virtual archives can benefit extensively from effective tools which enable searches based not only on content and theme, but also location. A timeline provides information on the development of a city via filtering photos of different building conditions.

4. Results

The following sections present information about demonstrations and studies we have performed on the pipeline steps.

4.1. Data Collection

4.1.1. Crowdsourced Data Collection

To crowdsource the collection of historic photographs and re-create these photos to collect spatial metadata, we equipped the mobile application with additional functionalities which can be used worldwide. To increase their use, we conduct local citizen contests. The contest was ran in Jena in 2022, with 4000 images collected, and will take place in the city of Schleiz in Thuringia in 2024.
The Jena citizen contest was conducted in autumn 2022. The citizens were asked to upload private historical photos, postcards, and other historical images from the period between 1900 and 2000 (see [80]). Images could be submitted in three different ways:
  • If the photos were digitized, they could be uploaded from within the application.
  • If the photos were still in analogue form, they could either be photographed directly within the application or submitted at various collection points such as the Jena City Museum and the Thuringian State and University Library (Thulb). Especially for larger quantities, the images were digitized at Thulb and then we transferred them to the application database.
  • To determine the position of the historical photos, citizens were also asked to “rephotograph” images that were already in the database. To do this, the participants had to identify where the respective historical photo was taken and position themselves so as to take a new photo from the same viewpoint and angle. The corresponding information about geolocation, etc., was then automatically transferred from the mobile device to the database and used to project the images on the models.
To advertise the contest, we cooperated with regional newspapers, which regularly reported on its progress. Furthermore, to address the citizens directly, four–five public stands were set up weekly in the Jena City Museum, the University Library, and the Market Square. Here, people could hand in analogue pictures personally. In addition, advertising materials were sent to schools and cultural associations and distributed in bars and pubs. To ensure maximum accessibility, we kept the threshold as low participation. Participants were required to provide their name, email address, and telephone number in the application. This also allowed the participants to choose whether to transfer the rights to the photographs.
Prizes could be won in a total of six categories shown on the official website (Figure 1) created for the competition by an advertising agency. The winners were selected by a high-ranking jury, including the Thuringian State Secretary for Culture and the Mayor of Jena.
In total, over 4000 historical photos and rephotographs were submitted, of which a selection was used to evaluate the 3D reconstruction methods.

4.1.2. Crowdsourced 3D Digitization

As another option for gathering 3D content, we implemented a low-end 3D digitization pipeline to document heritage with images taken with a smartphone (Figure 2). The goal was to document cultural heritage using images and 3D models from user-generated photos and to integrate the results in the DFG 3D-Viewer repository [81]. The web frontend and processing pipeline were in a beta state at the end of 2023, and had already contributed 3D sculptures to our 4D applications.
3DHeritage consists of a webpage frontend in multiple languages (currently English, German, Ukrainian, Russian, and Arabic), providing a guided workflow to take images and upload them to the portal servers with metadata. Metadata can be freely added or retrieved from Wikipedia for object descriptions, from ORCID [283] for user information, and from Geonames for location information [284]. After uploading, a server-side process is initialized, which uses a scripted Meshlab pipeline to create 3D models from these images. We used this tool with an unsupervised pipeline; we are currently automatically uploading the models to Sketchfab and then retrieving them in the DFG 3D-Viewer to reduce error sources and data conversion.
The workflow has been operational in public beta since September 2022 and used in various settings with ~400 images of 21 objects processed so far; of those objects, 19 could be transferred to a 3D model. As a general finding, all 3D meshes produced in the automatically processed pipeline are of low quality with non-watertight and gapped meshes. Despite these limitations, the 3D objects give at least a visual impression of the shape and texture and are of sufficient quality for viewers.

4.1.3. Data Retrieval

To gather data on the world scale, we have setup a server-sided pipeline to retrieve data from different providers. This is currently operational in an alpha version, with 20,000 images, 4000 3D datasets, and 2700 POIs retrieved up to the end of 2023.
Data retrieval comprises approaches to gather images, links to information resources, and 3D models from different sources. To retrieve legally accessible images, we selected CC-0 or CC-BY [285] licensed content only.
For data retrieval, we used a series of server-side scripts in Python and PHP feeding into an SQL database and Unix file storage. The scripts are input by users locating them in our mobile application 4D City—the locations are resolved into placenames via Geonames [284].
To avoid reloading already retrieved positions, each object’s geocoordinates were processed into geotiles. These geotiles were compiled from the Universal Transverse Mercator (UTM) hours and minutes of each value. For instance, the geotile 5105 × 1374 would comprise a bounding box with latitudes 51.05 to 51.06 and longitudes 13.74 to 13.75. Unless this simple approach leads to varying tile sizes, it enables easy coding and decoding of geotiles. To query multiple images, even in query services like Google Street View with one result per query, we further subdivided the coordinates within the bounding box—e.g., to a 3 × 3 position grid—and queried each of these positions.
Since May 2022, 12,983 positions have been collected and processed. By mid-2023, several thousand datasets were retrieved via these sources (Table 4).
In the next step, we pre-classified retrieved images to sort out images not showing building exteriors. For this, we use a Python-based VGG-16 classifier, which was trained on a set of images derived via the retrieval pipeline. We used 4033 manually classified files belonging to two classes (showing/not showing architectural exterior). For training, 3227 files were used—including nine variants by data augmentation per file—and for validation, we used 806 files.
The accuracy of the validation dataset is above 0.85 (Figure 3). A classifier was used to automate the step to identify architectural exteriors as a prerequisite for further processing in the pipeline. To gain a good ratio between true and false positives and negatives, we currently only include an image if the predictor certainty is 90% or higher.

4.1.4. Student Hackathons

To teach 3D reconstruction skills and apply them in a competitive setting, we organized two student competitions for the digital 3D reconstruction of historical architecture in 2018 [286] and 2020 [277] (Figure 4). Besides teaching 3D modelling skills, these modelling hackathons—named modelathons—were proposed to create 3D models of historic buildings and city quarters.
This format was tested for the first time in 2018 as part of the Digital Humanities in German-speaking Areas (DHd) conference in Cologne. In that setting, over four days during the conference, nine student teams reconstructed the historical Hofburg in Vienna. This reconstruction was supported by various educational and practice sessions teaching 3D skills. Due to the restrictions during the COVID-19 pandemic, the second modelathon was held in the winter semester 2020/2021 within a project funded by the German Rectors’ Conference. In that session, the goal was to reconstruct the lost industrial architecture of the Carl Zeiss AG factory in Jena, extant in the late nineteenth to early twentieth centuries, which only partially exists today. In that modelathon, eleven student teams took part.

4.1.5. Content Creation by School Children

As another approach to create content, we began conducting school courses in 2022 to enhance digital skills but also to create mainly textual information and virtual tours to populate the 4D information system.
Digital learning with primary school children was tested in the religious history project Virtual City Walks to the Churches in Jena [276]. This was carried out in June 2022 in a local primary school with a time frame of three times 60 min with eleven pupils. The aims of the project were to improve the pupils’ digital competence, to deal with the religious and urban history topic of churches in Jena, and to train teamwork skills. In the end, two virtual city tours for children were created, which were to be inserted into the existing 4D City application and thus made available for independent use. In a qualitative pupil survey after the project, it was found that independent work on a computer on a self-selected topic was particularly motivating. The personal reference to some churches and the digital method of the virtual city tour also motivated the learners to study with the topic of city history. However, internet research, especially filtering out credible sources and formulating the most important information on a topic, was difficult for the learners. This is in line with the identified problems of the DigComp framework [287], and shows that this skill needs to be learned in the future, either before or on the course. Building on the identification and replication of this problem, all methods and tools discussed in the digital humanities lab should enable the learning of media and digital literacy with a focus on understanding and evaluating information.
To test and establish digital labs in the humanities, the Digital History Lab, funded by the Stiftung für Innovation in der Hochschullehre, was initiated at the University of Jena in 2022. In the DH Lab, university students learn about cultural and historical topics and test and reflect on them with school pupils. In doing so, the students gain practical experience in the digital research, preparation, and communication of cultural history content, which they can build on in their later professional lives. The thematic focus of the first project year was on Jena’s city history and was intended to motivate children and young people to deal with the cultural heritage, personalities, and historical events of their home city in a source-based and creative way. For this purpose, various digital methods such as digital source research, text analysis, the creation of 3D scans, and contemporary witness interviews were learned and used. The first results of the project were three courses designed by students of art history and history teaching (Table 5), which were offered to primary and secondary school pupils in the context of school and extracurricular working groups, and a project week in a youth center which was made available to other teachers on a public platform. In total, 95 pupils participated in the educational courses.
In a subsequent survey of the students, three challenges were identified: the necessary technical equipment such as internet-capable end devices and digital sound recording devices; the different prerequisites of the learners in terms of prior knowledge, digital skills, and working speed; and legal questions regarding the publication of the work results. The first solutions were the acquisition of the necessary technical equipment, flexible planning, sufficient staff to provide the learners with individual support, differentiated tasks, and obtaining written consent from the parents.
The next steps of the project are to expand the focus of the content from local history to other historical topics, to provide in-depth training in digital skills for teachers and learners, and to expand the target group to include educators in both schools and museums.

4.2. Data Processing

4.2.1. Building Footprint Extraction from Historical Maps

The initial step is to georeference historical plans and to extract building footprints. This step is currently in testing for one historical map of Jena via testing two different approaches—the Deep Learning module of ArcGIS Pro and Segment Anything.
For the first proof of concept, a historical map of Jena in 1936 was provided by the Thuringian State Library (Figure 5). To verify the building footprint extraction with a contemporary map, the historical map was georeferenced by determining multiple control points visible in both maps.
Automatic segmentation of historical maps is considered a difficult challenge due to vast changes in appearance between maps of different epochs [164,288]. While one approach may be successful for the 1936 map, it may easily fail for another map.
For the Jena map, two different strategies were investigated. The first approach involves using the Detect Objects Using Deep Learning module of ArcGIS Pro. This requires users to manually vectorize several building footprints in the historical map and use them as training data [80]. In our research, reasonable results could only be obtained after labelling approximately 50% of the complete map. Still, the post-processing tool Regularize Building Footprints had to be used to create proper edges.
In the second approach, Segment Anything [289] was applied to the historical map. As the resolution of historical map data is usually high, we followed a tile-based approach, cutting the map into equally large parts with a maximum resolution of 500 × 500 pixels. This eases the visual comparison to the first approach. The results can be seen in Figure 6.
Figure 6 shows that the semi-automatic approach outperforms Segment Anything. However, this is only the case after manual segmentation of a large amount of the original map and therefore cannot be seen as a general solution for other historical maps. Without any historical training data, Segment Anything performs quite well in extracting the footprints of the building blocks. However, text and graticule lines provide challenges for the tool and should be removed prior to use. Again, this would require manual work. A similar approach to ArcGIS should be run to regularize the final extracted footprints.
This proof of concept shows the potential for automatic footprint extraction from historical maps and its extrusion to 3D building models. However, the provided data show the challenge of the situation and the research potential for finding a holistic solution.

4.2.2. Spatialization of Contemporary and Historical Photographs

One pipeline task is the spatialization of historical photographs. Part of this task is to collect and identify spatiotemporally corresponding images via textual image metadata (e.g., placenames). The next step is to detect similar views via overlapping segments in historical and contemporary photographs and to calculate a relative position via a feature-based orientation/positioning pipeline, and combine them with contemporary, oriented data to identify absolute positions. While digital photographs already contain data which enable, at least for Streetview data, an out-of-the-box use, historical photographs have to be processed to retrieve orientation information.
Exact determination of the position and orientation of contemporary and historical photographs remains a crucial step for automatic photogrammetric 3D modelling and texturization of 3D models. Several strategies have been developed within the Jena4D research group.

Image Processing for Contemporary Photographs

Regarding the contemporary image material retrieved from different sources, initial experiments deal with the retrieved Google Street View images. The Google Street View API only provides sparse information such as the latitude and longitude of the photograph in UTM coordinates and one angle for the orientation. Thus, several assumptions need to be made:
  • As there are always three images taken at one position, we assume a field of view (FOV) of 120°.
  • As only one angle is given, we assume that this is the rotation around the yaw axis. We assume that the other two angles are close to 0°.
  • As the height coordinate of the image is not given, we estimate the respective elevation using the API of opentopodata.org and the EU digital elevation model EU-DEM with 25 m resolution. We add 2 m to the retrieved height because Google’s camera is usually mounted on a car.
Considering these multiple assumptions for the contemporary images, the accuracy is quite remarkable (Figure 7).
It is planned to use these images in areas where no other (historical) image material is available. Considering the quality of the overlay, it is possible that matching the 3D model and image content may improve the image orientation.
A similar workflow has not yet be established for Mapillary images. The Mapillary API provides even less image orientation information, and the global coordinates seem to be more inaccurate than those for Google Street View, placing the images in the wrong spot in the 4D application. Further, orientation angle information is not given at all, so the viewing direction would have to be estimated by an iterative approach to test matching between images and given OpenStreetMap (OSM) panoramas.
The last retrieval image data source is Wikimedia Commons photographs. While these images are usually not available for all possible urban scenes, they can be especially relevant for specific landmarks. For famous sights, several hundreds of images often exist. However, no orientation information is given for this material. Thus, for the Wikimedia Commons images, we followed the SfM method that is used on historical urban images and explained in the following.

Image Orientation for Historical Photographs

The strategy for orientation of historical images is explained in detail in [130,290]. Here, the process is summarized, and recent improvements are highlighted. For the simultaneous estimation of camera parameters and the generation of a sparse point cloud out of many contemporary and historical photographs, the photogrammetric method SfM was applied using a modified workflow in the software COLMAP (https://colmap.github.io/ (accessed on 12 December 2023)) [291].
The most important aspect for generating a suitable model is finding reliable tie points between image pairs, which is especially challenging for historical or retrieved data. This is why our method uses a combination of the feature detection method SuperPoint [292] and the feature matching method SuperGlue [293]. Recently, small advances were made by using DISK features [294] with LightGlue [295], which has not been tested yet in our workflow.
As the final model often shows slight inaccuracies due to the historical data material, the bundle adjustment is improved using pixel-perfect-sfm [296]. The final product (Figure 8) still needs to be georeferenced in an interactive process as global and local points cannot be found automatically.
This is mainly due to the different appearance and accuracy of the sparse point cloud in the local coordinate system and the LoD2 model in the global coordinate system. We assume that the accuracy could be increased by matching multiple segmented images in the local coordinate system against the LoD2 models.

4.2.3. Parametric Modelling

On the city scale, we created 3D buildings by extrapolating the footprints to building walls, calculating the roof shape, and using the position and orientation to map the photographs onto the façade. These steps made it possible to create large-scale city models with basic geometric features. This feature is already applied on the world scale.
There are a large number of parametric modelling approaches for roof features, most notably the straight skeleton approach [297] to compute a mediated topline of the roof (e.g., [298,299]). In our case, the key objective is to reassemble the roof shape as best as possible; therefore, our roof-generation approach is designed to create different roof shapes, which are to be compared and selected for the best match to photographs.
To ensure a baseline 3D model, building footprints were pulled from OpenStreetMap and other providers, and the outer walls were modelled in the browser of the viewing client. Besides the building geometry, roof features are very important in assessing buildings [215]. The roofs were generated based on the data loaded from OSM. The data returned the following values: type, orientation, height, angle, levels, direction, material, and color. The supported types are as follows: flat, y-shaped, dormer, half-hipped, skillion, gabled, quadruple saltbox, and hipped (Figure 9).
The algorithm can be divided into two main parts: parts for squared and non-squared roofs. Squared roofs are built after calculating the midpoint of the four vertices, and according to the roof shape, the geometry (triangles) is created (Figure 10). For L-shaped roofs, more properties need to be calculated. First of all, the two shortest distances of the six-vertices roof are calculated. These lines cannot be neighboring lines (they cannot have the same starting or ending point) and cannot be parallel (their dot product of vectors, created at midpoint, has to be much smaller than one). Then, at the mentioned midpoints, perpendicular lines are created. The crossing point creates a new vertex which combines two parts of the L-shaped roof. At the given height and shifted by some distance, vertices are added at the midpoints of the shortest lines to create the L-shaped top of the roof. Then, triangles are created based on the direction and the newly created vertices.
Currently, we are able to process gabled, skillion, dome/onion, pyramidal, cone, and flat roofs with different levels of complexity (Figure 11). The algorithm can be divided into six sub-parts. Apart from properties provided from OSM data (like type, angle, or levels), sometimes extra data need to be extracted:
  • The center of the roof (midpoint between two coordinates from Cartesian extents of the shape).
  • The direction in which the tilt should be created (angle given by longest edge in the shape).
The implementation for creating different types of roofs is currently as follows:
  • Gabled/hipped: First, the center of the roof and direction is determined. Next, based on the depth of the geometry (peak point, direction, and outer shape), the highest edge is created, and then the geometry is extruded.
  • Skillion: First, the angle of the roof and the pitch is determined. Then, the higher part is extrapolated to the pitch point and the slope faces are added.
  • Dome/onion: First, the largest circle within the points and its center are determined. Based on this, a sphere geometry is created and scaled according to the scale (height). For onion domes, this has to be raised by an additional radius.
  • Pyramidal: First, the center of the shape is determined. Then, a pyramid geometry at the center point and level height is created.
  • Cone: First, the center and number of points of the shape are determined. Then, a cone geometry at the center point, with the height of the levels and base equal to the roof shape, is created.
  • Flat: the same shape as the input is created with a height at a given level.
The next steps are to create rarer roof shapes like dome, onion, or cone-shape rooves.
Figure 11. Example roof shapes from the parametric generator for buildings with four faces (left), implementation in the 4D City application for larger numbers of faces (right).
Applsci 14 01992 g011

4.2.4. Generation of Historical 3D/4D Models

For buildings where a sufficient number of historical photographs were available, we created higher-resolution 3D models from imagery. This approach has currently been tested with data from single buildings in Jena and Dresden and for a larger area in the inner city of Budapest.
The presented automatic image orientation allows time-dependent 3D models (4D models) to be generated using image content. For this purpose, the textures of the georeferenced images are projected onto the respective LoD2 models. Depending on the selected time period, one or multiple images are used. In the case of multiple images, we developed a shader for smart selection of image content depending on the image angle and distance to the object, as explained in the visualization section.
This approach is useful for real-time applications where heavy data traffic should be avoided. However, textured models usually lack complexity due to the simplicity of LoD2 (Figure 12).
More detailed 3D models from SfM workflows are usually generated using dense matching with its most widespread technology, semi-global matching. As a result of the extremely inhomogeneous nature of historical images, and consequently the large radiometric and geometric differences between image pairs, the result of conventional dense matching is often unusable (Figure 13).
This is why initial experiments on using neural rendering strategies like NeRF [136] have been carried out in the research group. Detailed tests and results [80] are summarized in the following.
The sparse point cloud derived using advanced SfM techniques is transferred into SDFStudio [301], which is a modular framework for neural implicit surface reconstruction. In our experiments, NeuS Facto yielded the best results, even for a small number of historical terrestrial images. However, rendering may also produce artifacts, and the results are still far from perfect detailed representations of the historical buildings (Figure 14).
Consequently, more experiments have to be carried out to improve the automatic generation of high-quality 3D building models. Improvements may be obtained by using and adapting even more recent neural rendering methods such as [302,303], as we think that there is high potential when using these approaches for automatic 3D and 4D modelling.
To test this pipeline on a larger scale, we selected, from ~200 k historic images, 10 k images as belonging to the same continuous city model of Budapest. Figure 15 depicts an SfM reconstruction using SOTA it isand -content-based image retrieval (EigenPlaces) and neural matching algorithms (DISK + LightGlue). Although the overall topology of the city is clearly visible, although partially mirrored, it contains many degenerate cameras (long red lines) and incorrect matches; also, the repetition of structures such as the two sides of the bridge in the center of the view causes problems.

4.2.5. Data Enrichment with Textual Information

To further enrich 3D models with text and image data, turning them into an interlinked dataset, we used labels or annotations [304]. Taken together, the annotations enable a time/space related to browsing source material, but can also support numeric analysis, eliminate bias, and ensure reproducibility [305].
In the digital humanities, the Getty Art & Architecture Thesaurus (AAT) is well established and provides a hierarchy for architectural elements [306]. Furthermore, Wikidata offers a variety of entities, classes, and corresponding semantic relations for art and architectural elements and is also used in cultural heritage [307]. Relevant terms were identified via text analyses of Zwinger literature and Baroque architecture, building history and building research [305]. Finally, a list of about 400 entries (including 140 architectural elements) was compiled, containing both AAT and Wikidata IDs. So far, several Wikipedia articles, scientific publications, and popular scholarly articles have been annotated. In the texts, words or word groups from the compiled term list and terms with a high semantic similarity were annotated (Figure 16) [308].
In our case study, a detailed 3D model of the Kronentor (Crown Gate) from Dresden Zwinger was manually annotated in a modelling environment for testing purposes. In this model, most of the architectural elements are separate objects that carry the corresponding AAT or Wikidata ID in addition to the element name. Some objects are grouped and form a unit in the sense of a hierarchy of elements.
As described in the previous section, 4000 photographs of Dresden have been spatialized in the 4D browser application, either manually or using a semi-automatic approach. Images were also manually segmented and annotated using Label Studio (https://labelstud.io/ (accessed on 12 December 2023)), an application for labelling and annotating data which provides a standardized output format. Each annotation follows the scheme used for the 3D models and contains both AAT and Wikidata IDs (Figure 17). Automatic transfer of annotations from the 3D model to the located photographs is conceivable, but previous approaches have not yet achieved the desired level of reliability and accuracy.
The 4D browser displays annotations as a word cloud, indicating how often a term is mentioned in a text document, but also connects images, texts, and 3D information (Figure 18). The annotations are clickable in the text or image and the word cloud; clicking takes the user to linked external information like the AAT and Wikidata entries and features like searching for connected or similar annotations in other images, 3D models, and text passages within the platform.

4.3. Data Visualization

Multiple types of data have been collected, processed, and/or generated, particularly photographs and 3D building models [309]. To enable users to explore and interact with these data, two applications have been developed, targeting different user groups and scenarios: the 4D City application for mobile devices and the 4D browser for desktop use. Nowadays, all modern devices and browsers are capable of displaying 3D content via WebGL (https://caniuse.com/?search=webgl (accessed on 29 September 2023)). This includes extensive 3D city models due to the increasing computing power of mobile devices [310]. Three-dimensional asset formats like glTF [311] with Draco 3D compression [312] ensure that the data loaded for transmitted 3D content are kept to a minimum.
To put the spatialized photographs and generated 3D models into context, other data sources were incorporated. Digital elevation models (DEMs) on the basis of the SRTM or ALOS World 3D satellite data have a resolution of up to 30 m, are publicly available, and can be queried by Google Elevation API or OpenTopography. With the DEM-Net Elevation API (https://elevationapi.com (accessed on 29 September 2023)), it is possible to query ready-meshed digital terrain models that are optionally textured with a map. DEMs with a higher fidelity (up to 1 m resolution) can be retrieved from national land survey offices. However, they have to be downloaded and processed manually.
The 3D building models, gained from various sources and processed as described above, cover only small areas at very specific places. Hence, there are many void areas. OpenStreetMap (OSM) offers detailed geodata from around the globe, including building footprints. The Overpass API was utilized to query these building footprints that are used to generate 3D geometries [313] during runtime to complement these void areas. Additionally, the 3D city model can be enriched with in-depth information on buildings, places, statues, etc. In this regard, open knowledge graphs such as Wikidata are queried via SPARQL [314] to find and collect points of interest in the vicinity.

4.3.1. Backend Application

The backbone of the two frontend applications is a server-side application with various functions (Figure 19). Primarily, it implements a RESTful API as a main interface to request data. In order to query and serve our aggregated and processed data (i.e., photographs enriched with spatial and temporal information, generated 3D building models, custom terrain and map data, or custom points of interest), we used the graph database Neo4j. This enables us to identify relationships between multiple instances of data (e.g., which images depict which buildings), and to store them to improve the querying and finding of relevant data.
External APIs are requested to complement the custom data: the DEM-Net Elevation API for digital terrain models, the Overpass API for OSM building footprints, and Wikidata for retrieving information for points of interests. Since the requests to those APIs can take up to several seconds and are unlikely to change in the short term, the backend caches the responses. Thus, requests with the same or nearby location query parameters can be answered much faster.
Besides storage and querying data, the backend features some more computation-intensive tasks. When 3D models are uploaded, they are converted into Draco-3D-compressed glTF files. Additionally, which OSM building footprint overlaps with the uploaded model is checked to avoid interfering with 3D models later in the scene. If the spatial information of an image is updated, it is then determined which buildings are visible and to what extent. Experimental pipelines for automated data generation and enrichment (i.e., spatialization of photographs, generation of 3D buildings) are not yet part of the backend, but the results can be pushed via an API endpoint.

4.3.2. Features of the Mobile Application

The 4D City application is a browser-based web application that runs on iOS/WebKit and Android/Chrome browsers. The application is built by using Angular and three.js. Users can explore the scene at their current location. This requires access to device sensors, i.e., geolocation and device orientation sensors. By limiting the user’s geolocation and the view to a first-person perspective, there is no need to load a huge 3D city model, only the buildings in the vicinity, which reduces the amount of data transmitted.
All content with spatial attributes is usually delivered in polar coordinates, i.e., WGS 84 (latitude, longitude). Since the 3D scene requires a Cartesian coordinate system, the spatial attributes are converted to a metric system, specifically UTM coordinates, which preserve the actual dimensions. The following sections present the main features of the 4D City application.

Projective Texturing

The users explore the scene from a first-person perspective. This contrasts to the 4D Browser, where a cityscape is explored more from an aerial perspective. To let users experience historical photographs of the urban scenery in the 4D City application, the photographs are used as textures on the 3D geometries.
A huge number of spatialized photographs can be used as potential textures, but not all of them might be suitable, so only a small number should be selected and assigned to each building geometry. Which photographs are potentially good textures for which buildings is determined in a two-step process.
An offline background process on the backend first determines which buildings of the 3D city model are actually visible from the camera perspective in the year the photo was taken for each photo. The scene at this point in time is rendered from the perspective of the photograph (a) with unique colors for each building and (b) as a depth map. A weight value can then be calculated from the number of pixels a building covers in relation to the total number of pixels in the image. In addition, the distance derived from the gray value of the depth map affects the weight value. A building close to the camera position is given a higher weight than a building further away. The weight value is stored in the database as a relationship between the building and the photo. It is now possible to query the 3D geometry of buildings with potential textures sorted by weight (Figure 20).
Instead of assigning different UV texture coordinates and multiple materials to the 3D building geometry, a custom shader is used to project multiple images onto the building surface at runtime. The number of photographs passed to the shader as texture units is currently limited to six in order to support older devices that have a limited number of fragment uniform vectors. With each texture, the virtual camera’s transformation and projection matrices are also passed to the shader. The fragment shader determines which parts of the textures should be applied to the surface and where. For each pixel, a weight value is calculated for each virtual camera c_i. If the surface position p is outside the frustum of the respective virtual camera, or the surface normal points in the opposite direction, the weight is zero (ω_i = 0). Otherwise, the vector v_i between the camera position and the surface position is calculated and the weight depends on a) the angle α_i between v_i and the surface normal n and b) the length of v_i (i.e., the distance between the two positions). The highest ranked virtual camera or texture is applied to this pixel. Thus, for a given part of the geometry, the texture with a more perpendicular view to the surface and which is closer (i.e., shows more detail) is selected.

UX

User-centered design is a significant principle during user experience (UX) reviews, including checking the design-driven development process and increasing user satisfaction. Gualtieri [315] and Stokes [316] both described a great UX as a useful, usable, and desirable interaction with a system or product. Altogether, UX is the result of a system or product’s manifestation, function, performance, and interactive behavior and covers whole-system or product acceptance. It touches on pragmatic and hedonic aspects of a system or product. Pragmatic or instrumental refers to the utilitarian aspects, such as the usefulness and ease of use, and hedonic or non-instrumental refers to the emotional and experiential aspects of product or system use [317]. As an area of human–computer interactions, UX is an important perspective in the human-centered design of interactive processes.
In 4D City, the challenges include to check the design and interactive elements of development process and improve UX. UX design principles are verified based on scenario needs, including system usability, functional practicality, ease of use, and user interactivity. The UX test process is structured on six levels to test such a complex system. It includes a strategy level (clarifying the application goal, user requirement, and UX), scope level (analyzing related applications and functions), a structure level (designing the information structure), a frame level (designing information interactions), a representation level (designing visual communication and navigation), and an implication and improvement level (evaluations, summarizing implications, and improvements).
In detail, three aspects are reviewed when verifying the application system: user requirements, main steps and vital nodes of the use process, and user experience. In every aspect, three design elements are reviewed in terms of the structure design, interactive design, and visual design. Before analyzing the structure design, the information structure of the application system was listed and analyzed in terms of what, why, and how, which are the significant principles and the foundation of whole UX review process (Figure 21).
For instance, in structure design analysis, the logical classification of the catalogue system and the definition of menu words are important prerequisites for easy understanding and use (Figure 22). A flowchart analysis is used to go through the application system, including the start page, tutorial, main menu, main functions, and popup navigation (Figure 23). For instance, if some button names are ambiguous, clearer names are suggested. Concerning the interactive part of the system, the interface structure should clearly reflect the workflow and avoid repetitive structures, complicated operation steps, or missing significant steps, making it easier to use. Ideally, users should be able to understand the function of the interface and perform the correct action intuitively. The visual design is based on structural design, with reference to the mental model of the target group and task achievement. This includes colors, fonts, pages, etc., to make the system pleasant to use. For instance, the text should be a uniform font, size, and color, making it feel harmonious and comfortable. Also, images should be organized in a uniform typography to feel coherent.
In addition, several potential users were invited to test the system (Figure 24) in both desktop- and mobile-based environments to provide feedback, which was organized to form a report. Finally, the project team was presented with current problems and opportunities for improvement to adjust, improve, and discuss with technical colleagues.

4.3.3. Four-Dimensional Browser Features and Visualizations

The other frontend application is the 4D browser. It is developed as a desktop- and browser-based virtual research environment, targeting primarily (but not only) art, architectural, and urban history scholars. The basic idea originates from shortcomings in conventional media repositories, where data can only be queried by their metadata [309]. To this end, the 4D browser extends conventional search interfaces (e.g., search bars, faceted search) by a 3D viewport that displays spatially oriented photographs within a 3D city model [318]. Since the 3D models only display buildings, (historical) maps have been incorporated as the texture of the terrain model, showing additional clues regarding the building situation, street names, and other infrastructure that supports orientation within a city. A tripartite time slider enables users to select a time range to filter images, choose a point in time that should be represented by the city model, and toggle between (historical) maps.
With this spatial approach, users are able to find images without precise knowledge of the metadata by spatially browsing around the building of interest. Since photographs are linked to the buildings they depict, interaction with the respective 3D objects can additionally filter the search results. Similar images can be browsed by easily navigating to neighboring camera positions. The 3D approach also makes it possible see the photographer’s perspective and to understand their situation while taking the photo [319]. With the time slider, it is possible to detect changes over time in the architecture, cityscape, and distribution of images.
Additional features aim to support scholars in answering their research questions (e.g., Which positions did photographers prefer when taking photos of a given building? Which areas or parts of buildings were never or hardly ever photographed?). Various visualizations extract the spatial information of the images to analyze not only their distribution, but also the acquisition habits of the photographers and the coverage of building parts [320,321]. A conventional heat map is used to identify aggregations of camera positions (Figure 25a), a heat map of buildings shows which parts have been photographed more frequently (Figure 25b), and popular angles of photographs are visualized by cluster-based radial fans (Figure 25c). Current work focuses on the addition and browsing of text documents, as well as annotation of architectural elements in texts, images, and 3D models to make connections across different types of media in order to further improve art and architectural history research [86].
Next to browsing and data exploration, the 4D browser also serves as an authoring and content management tool. Authorized users are able to upload images and 3D models, manually spatialize images, update metadata (including the date the photograph was taken as well as construction and destruction dates of buildings), and add custom POIs. All additions and changes made in the 4D browser also directly affect what can be seen in the mobile 4D City application. It is planned for the future that users are able to upload their own content to feed the system on the one hand (i.e., crowdsourcing), but also to create and analyze custom collections according to their specific research questions on the other hand.
On a technical level, the 4D browser utilizes the same browser-based technologies and frameworks (i.e., Angular, three.js) as the 4D City application, since the same data provided by the backend need to be processed. However, since it is for desktop usage, the application is not limited by the lower computation power and bandwidth of a mobile device. It can load and display more data at once, covering a bigger area. Nonetheless, the amount of data and geometry displayed in the 3D scene still need to be well balanced to ensure smooth interaction, particularly on older devices.

User Study

Usability tests are a common method to gain subjective opinions and insights into what users think about a specific application. How much users actually benefit from applications and interfaces depends on the usability, suitability, and efficiency of technological solutions. Assessment and feedback by user groups is used to adapt applications and interfaces. User studies help to (a) collect information needs and requests of the user groups, (b) filter out the challenges that user groups have when using the tool, (c) identify usability weaknesses and (d) adapt the application to the user’s needs.
Different formats like workshops, surveys, and demo sessions were used to assess the 4D browser application depending on the available time and audience.
The idea of the 4D browser is directly connected to research questions from art and architectural history. Scholars in these fields use images as the main source for analysis and argumentation and therefore turn to (online) digital image repositories. Common requirements of the users of digital heritage collections include ease of understanding the data and tools for accurate search and analysis, as well as an intuitive navigation and interfaces. Previous research has showed that 3D navigation can trouble users who are not used to 3D environments [322]. To evaluate the application, users were involved from the beginning of the development of the 4D browser. A workshop held at the Digital Humanities in the German-speaking Area (DHd 2018) conference in February 2018 involved 25 potential users, who were asked to reflect on their own experiences when using image repositories. Among a variety of mentioned issues and requirements were a dissatisfaction with insufficient filter options for existing platforms, requests for a faceted search functionality, to be able to label buildings within the 3D model, and for a feature to compare images.
Since the topics and tools of the 4D browser application are very specific, it needed to be tested with relevant user scenarios and use cases. Potential users to consider and explicit tasks to solve are particularly useful when a prototype must be tested for initial reactions to the functions and interface. The real user group must be brought in later to ensure that their quality criteria have been met.
The initial study was part of a workshop and contained different realistic tasks connected to the 4D browser [323]. The tasks help users to focus on and assess certain functions. They contain scenarios and problems that correspond to the knowledge and skills of an assigned persona that is part of the actual user group of the application. It is very important to properly have heterogeneous groups of test study participants. The persona approach seemed suitable for this as it helps participants from other academic fields who may not be able to fully envision the genuine intentions of the functions on the spot. Furthermore, thinking aloud was chosen to learn more about user needs and interactions. Instructions on how to approach the assignments as well as consecutive steps helped to guide the participants through the tasks. However, the instructions did not always name the specific tools and functionalities the participants should use. This allowed participants to observe whether they were named and placed in an intuitive manner. The data for the study were collected during a workshop offered by the research group at the DHd 2019 conference in Mainz, Germany. The topic of the workshop was usability testing for software tools in the digital humanities using the example of image repositories. Audio recordings of the participants were transcribed and coded using thematic analysis. This helped to evaluate how well the usability testing and the framework itself worked, revealing how participants dealt with personas and thinking aloud.
The International Committee of Architectural Photogrammetry (CIPA) Conference in 2019 and 2023 also offered opportunities to gather feedback during demo sessions. At the beginning of each session, the 4D browser was introduced via a live tour presenting different features and data. Subsequently, the participants were encouraged to use the application themselves to solve a defined task and provide feedback to the session leaders. At the end, they were asked to complete an online survey on specific design questions.
The demo session approach was reworked into a more extensive test and was carried out with art history students from the University of Munich in July 2023 and with digital humanities scholars in October 2023. Both groups are among the application target users. The two sessions again included a live tour of the 4D browser introducing different features. After a brief discussion to clarify questions concerning the data and the interface, the participants completed an online questionnaire with specific tasks to solve using the 4D browser. The questionnaire allowed every participant to work at their own pace, individually or in groups. The tasks were designed to test the functionalities of the application using the little available test data und to see if users approach solutions as intended during development and are satisfied with the results. The tasks were very simple scenarios connected to art history research and analysis:
  • Identifying buildings in a photograph.
  • Gathering information for a building (footprint, roof shape) and finding images from all sides of the building.
  • Analyzing which perspective of a building was most frequently photographed.
  • Analyzing differences between a digitized painting and the city skyline.
  • Comparing the ways two photographers staged a certain building.
  • Reconstructing the biography of a building.
  • Identifying a certain statue in a photograph.
The questionnaire provided all necessary information concerning the task. Additionally, it was possible to seek assistance by displaying a step-by-step approach to the solution, even offering different ways to solve the task. The participants were able to provide feedback on the features and navigation of the application as well as the assigned tasks.
After each test, the feedback was reviewed and the application was adapted accordingly. Subsequent tests revealed if the changes were perceived positively.

Limitations

A general issue in historical research is that available information and data are always fragmented in terms of time and space. Validated knowledge is bound to single points in time, which may then be interpolated. Historical photographs capture a certain moment in the past, but the exact date when they were taken is often unknown. Similarly, the dates when a building was constructed or demolished may be uncertain. This affects the reliability of our visualized data, particularly if images are projected as textures of 3D building models. Due to the different temporal restraints and uncertain knowledge, a building may have the wrong façade texture at specific dates. Inaccuracies in spatialization and in transformations of the photograph, or not using central perspective cameras, lead to mismatches between the projected texture and the 3D surface. If objects have been captured in the foreground of a photograph, they appear bigger when projected onto the building, hiding parts of the façade.
Currently, where data are missing, building footprints extrapolated to 3D geometry and maps are queried from OSM to fill in the gaps. However, these contemporary data only show the current building situation. When exploring the past, buildings may be shown that were not existent at that time. Additionally, since the footprints are extrapolated, they may be hard to identify. This applies in particular to more complex buildings like churches. Furthermore, not all OSM data are properly tagged with a height value or the number of levels for an estimation of the building heights.
Despite using data compression, the amount of data loaded can still be very extensive, which is a crucial issue especially for the mobile application, where the bandwidth may be limited. To decrease the loading time and not exceed the user’s data volume, further optimizations are needed.

5. Demo Cases

5.1. Dresden

The Dresden demo case started in 2016 in a research project. It comprises a specific 3D dataset provided by the municipality of the current city of Dresden, a 3D dataset of Dresden in the 1930s created in a previous project, and a set of images taken from the Deutsche Fotothek (Figure 26). Since 2019, the 4D browser interface has been provided as an alternative interface to the Dresden image collections in the Saxon University and State Library.

5.2. Jena

The city visualization for Jena was created based on LoD2 model data from the municipality of Jena (Figure 27). Within previous projects, a dataset of 5000 images and three time layers of cadastre data had been collected. Beyond the mentioned usage (school projects and image contests), the application is already available in Jena and used for digitally supported tourism, currently including eight different digitally guided city tours on different topics (such as monuments or historical persons) and for different types of users.

5.3. Amsterdam

For the National Maritime Museum in Amsterdam, additional content has been included to enable the application to run on museum kiosk systems and show the transition of the museum building (Figure 28). In July 2023, this was included in an exhibition at the Architecture Centre Amsterdam (ARCAM), entitled Liquid building block—Designing with water in Amsterdam. As part of this exhibition, a 4D representation of the museum building was created and populated in the 4D applications [324].

5.4. Worldwide

The worldwide experience is based on contemporary material and enables a baseline view at any location (Figure 29). This includes a baseline DEM retrieved from OpenDEM, contemporary building footprints retrieved from OSM, and Wikipedia articles retrieved via their Wikibase position information.

6. Future Prospects

The pipeline and applications have been in development by our group since 2016 through various projects at national and European scales. Currently, applications are available to provide contemporary viewer functionality on the world scale, with location-based Wikipedia articles included as POIs. So far, nine PhD and postdoctoral projects in computer science, humanities, geosciences, design and education are linked to the pipeline, its applications, and its use.

6.1. Data Collection

To enhance the user experience, the main challenge is to enrich the current dataset with both (a) contemporary and historical photographs and (b) historical map data. For additional photographs, we are continuing to acquire data from various image sources. We are also developing user management functionalities to allow multiple users to contribute to the applications. We expect this to enable cultural institutions and citizen scientists to contribute content.
Another topic currently under development is the incorporation of 3D models including (a) 3D assets such as sculptures or monuments from Europeana or Sketchfab and (b) 3D geotiles such as those provided by Google [325]. So far, 110 EU-funded projects have also created 3D models of cultural landmarks, although only few of them provide their data. However, they are a high-value asset to safeguard and re-use in applications [326].

6.2. Four-Dimensional Modelling

The next challenge for our group is to improve vectorization and footprint extraction from historical maps. Corresponding research questions for processing photographic data include how to create or augment historical image data by training neural networks in feature extraction and feature matching. Another issue is the number and quality of historical images required to enable the use of dense matching and the creation of historical (generalized) 3D models. The challenge is to further reduce the current number of images required for orientation. The final issue is to cross-validate parametric models and images, for example, to iterate different roof types or to estimate building heights from projected photographs.

6.3. Visualization

A technical challenge in visualization is to merge the different visual material—especially photographs of very different style and quality—into a common visualization. At a higher level, most current collections and guidelines [327] strive for high-quality content, including the best possible quality in a particular feature (e.g., detail, style) used for very different scenarios. As mentioned in our discussion of the literature, we expect that scenarios containing non-detailed views, such as city views of open spaces, may work even with very low detail [215]. We still need to identify usage scenarios and develop and test corresponding visualizations to determine the quality requirements for each of these scenarios.

Author Contributions

Writing—original draft, S.M., F.M., J.B., C.K., Y.S., D.D., D.K., I.M., C.B. and D.L.M. All authors have read and agreed to the published version of the manuscript.

Funding

This study is based on research carried out in projects funded by the BMBF (HistStadt4D: grant number 01UG1630A; HistKI: grant number 01UG2120A, Digital4Humanities: grant number 16DHB3006), DFG (DFG Research Network on Digital 3D—Reconstructions as Research Methods in Architectural History Studies, grant number MU4040/2), DBU (Kulturerbe4D: grant number 35654/01). SfL (DH Labor, grant number: FRFMM-334/2022), EU DEP (5DCulture, grant number: 101100778).

Institutional Review Board Statement

The study was conducted according to the guidelines of the Declaration of Helsinki. Ethical review and approval were waived since individual behaviors or attitudes were not subject of the study. All recorded personal information was pseudonymized.

Informed Consent Statement

Informed consent was obtained from all people involved in the user-related studies.

Data Availability Statement

The raw data supporting the conclusions of this article will be made available by the authors on request.

Acknowledgments

Parts of this article were originally published in [7,80,86,96,328]. The work presented in this article was supported by many people. Student assistants conducted the courses for pupils: Magdalena Kropp, Bastian Schwerer, and Eric Wiegratz. Testing was supported by Samuel Glowka. The modelathon was organized by René Smolarski. The reconstruction pipeline was supported by Katrin Fritsche. Programming was supported by Georg Zwilling, Fabian Thoms, Robert Richter, Thomas Gründer, and Felix Wiedemann.

Conflicts of Interest

The authors declare no conflicts of interest.

References

  1. Burke, P. Augenzeugenschaft: Bilder als Historische Quellen; Wagenbach: Berlin, Germany, 2003. [Google Scholar]
  2. Paul, G. Von der Historischen Bildkunde zur Visual History. In Visual History: Ein Studienbuch; Vandenhoeck & Ruprecht: Göttingen, Germany, 2006; pp. 7–36. [Google Scholar]
  3. Pérez-Gómez, A.; Pelletier, L. Architectural Representation and the Perspective Hinge; Mit Press: Cambridge, MA, USA, 1997. [Google Scholar]
  4. Münster, S.; Maiwald, F.; Lehmann, C.; Lazariv, T.; Hofmann, M.; Niebling, F. An Automated Pipeline for a Browser-based, City-scale Mobile 4D VR Application based on Historical Images. In Proceedings of the 2nd Workshop on Structuring and Understanding of Multimedia heritAge Contents, Seattle, WA, USA, 12 October 2020; pp. 33–40. [Google Scholar]
  5. Muenster, S.; Bruschke, J.; Maiwald, F.; Kleiner, C. Software and Content Design of a Browser-based Mobile 4D VR Application to Explore Historical City Architecture. In Proceedings of the 3rd Workshop on Structuring and Understanding of Multimedia heritAge Contents, Virtual Event, 20 October 2021; pp. 13–22. [Google Scholar]
  6. Münster, S.; Lehmann, C.; Lazariv, T.; Maiwald, F.; Karsten, S. Toward an Automated Pipeline for a Browser-Based, City-Scale Mobile 4D VR Application Based on Historical Images. In Research and Education in Urban History in the Age of Digital Libraries; UHDL, 2019; Niebling, F., Münster, S., Messemer, H., Eds.; Springer International Publishing: Cham, Switzerland, 2021; pp. 106–128. [Google Scholar]
  7. Münster, S.; Kamposiori, C.; Friedrichs, K.; Kröber, C. Image libraries and their scholarly use in the field of art and architectural history. Int. J. Digit. Libr. 2018, 19, 367–383. [Google Scholar] [CrossRef]
  8. ViMM WG 2.2. Meaningful Content Connected to the Real World (Unpublished Report). 2017.
  9. Bekele, M.K.; Pierdicca, R.; Frontoni, E.; Malinverni, E.S.; Gain, J. A Survey of Augmented, Virtual, and Mixed Reality for Cultural Heritage. Acm J. Comput. Cult. Herit. 2018, 11, 7. [Google Scholar] [CrossRef]
  10. Daniela, L. Virtual Museums as Learning Agents. Sustainability 2020, 12, 2698. [Google Scholar] [CrossRef]
  11. Siddiqui, M.S.; Syed, T.; Nadeem Al Hassan, A.; Nawaz, W.; Alkhodre, A. Virtual Tourism and Digital Heritage: An Analysis of VR/AR Technologies and Applications. Int. J. Adv. Comput. Sci. Appl. 2022, 13, 303–315. [Google Scholar] [CrossRef]
  12. Münster, S. Militärgeschichte aus der digitalen Retorte—Computergenerierte 3D-Visualisierung als Filmtechnik. In Mehr als Krieg und Leidenschaft; Die Filmische Darstellung von Militär und Gesellschaft der Frühen Neuzeit (2011/2); Kästner, A., Mazerath, J., Eds.; Universitätsverlag Potsdam: Potsdam, Germany, 2011; pp. 457–486. [Google Scholar]
  13. Ott, M.; Pozzi, F. Towards a new era for Cultural Heritage Education: Discussing the role of ICT. Comput. Hum. Behav. 2011, 27, 1365–1371. [Google Scholar] [CrossRef]
  14. Flaten, A. Ashes2Art: A Pedagogical Case Study in Digital Humanities. In Proceedings of the 36th CAA Conference, Budapest, Hungary, 2–6 April 2008. [Google Scholar]
  15. Sanders, D.H. Virtual Archaeology: Yesterday, Today, and Tomorrow. In Proceedings of the CAA2004, Prato, Italy, 13–17 April 2004. [Google Scholar]
  16. Fisher, C.R.; Terras, M.; Warwick, C. Integrating New Technologies into Established Systems: A case study from Roman Silchester. In Proceedings of the Computer Applications to Archaeology 2009 Williamsburg, Williamsburg, VA, USA, 22–26 March 2009. [Google Scholar]
  17. Doukianou, S.; Daylamani-Zad, D.; Paraskevopoulos, I. Beyond Virtual Museums: Adopting Serious Games and Extended Reality (XR) for User-Centred Cultural Experiences. In Visual Computing for Cultural Heritage; Liarokapis, F., Voulodimos, A., Doulamis, N., Doulamis, A., Eds.; Springer Series on Cultural Computing; Springer International Publishing: Cham, Switzerland, 2020; pp. 283–299. [Google Scholar]
  18. Haynes, R. Eye of the Veholder: AR Extending and Blending of Museum Objects and Virtual Collections. In Augmented Reality and Virtual Reality; Progress in IS; Springer: Berlin/Heidelberg, Germany, 2018; pp. 79–91. [Google Scholar]
  19. Ferrara, V.; Macchia, A.; Sapia, S. Reusing cultural heritage digital resources in teaching. In Proceedings of the Digital Heritage International Congress (DigitalHeritage), Marseille, France, 28 October–1 November 2013; pp. 409–412. [Google Scholar]
  20. Gicquel, P.Y.; Lenne, D.; Moulin, C. Design and use of CALM: An ubiquitous environment for mobile learning during museum visit. In Proceedings of the Digital Heritage International Congress (DigitalHeritage), Marseille, France, 28 October–1 November 2013; pp. 645–652. [Google Scholar]
  21. Motejlek, J.; Alpay, E. A Taxonomy for Virtual and Augmented Reality in Education. arXiv 2019, arXiv:1906.12051. [Google Scholar]
  22. Cranmer, E.E.; tom Dieck, M.C.; Jung, T. The role of augmented reality for sustainable development: Evidence from cultural heritage tourism. Tour. Manag. Perspect. 2023, 49, 101196. [Google Scholar] [CrossRef]
  23. Kim, K.; Seo, B.-K.; Han, J.-H.; Park, J.-I. Augmented reality tour system for immersive experience of cultural heritage. In Proceedings of the 8th International Conference on Virtual Reality Continuum and its Applications in Industry—VRCAI ’09, Yokohama, Japan, 14–15 December 2009; pp. 323–324. [Google Scholar]
  24. Ioannidi, A.; Gavalas, D.; Kasapakis, V. Flaneur: Augmented exploration of the architectural urbanscape. In Proceedings of the 2017 IEEE Symposium on Computers and Communications (ISCC), Heraklion, Greece, 3–6 July 2017; pp. 529–533. [Google Scholar]
  25. Ioannidis, C.; Verykokou, S.; Soile, S.; Boutsi, A.M. A Multi-Purpose Cultural Heritage Data Platform for 4d Visualization and Interactive Information Services. Int. Arch. Photogramm. Remote Sens. Spat. Inf. Sci. 2020, 43, 583–590. [Google Scholar] [CrossRef]
  26. Mortara, M.; Catalano, C. 3D Virtual environments as effective learning contexts for cultural heritage. Ital. J. Educ. Technol. 2018, 26, 5–21. [Google Scholar]
  27. De Fino, M.; Ceppi, C.; Fatiguso, F. Virtual Tours and Informational Models for Improving Territorial Attractiveness and the Smart Management of Architectural Heritage: The 3d-Imp-Act Project. Int. Arch. Photogramm. Remote Sens. Spat. Inf. Sci. 2020, 44, 473–480. [Google Scholar] [CrossRef]
  28. Chatzidimitris, T.; Kavakli, E.; Economou, M.; Gavalas, D. Mobile Augmented Reality edutainment applications for cultural institutions. In Proceedings of the 4th International Conference on Information, Intelligence, Systems and Applications, Mikrolimano, Greece, 10–12 July 2013. [Google Scholar]
  29. Vicent, N.; Rivero Gracia, M.P.; Feliu Torruella, M. Arqueología y tecnologías digitales en Educación Patrimonial. Educ. Siglo XXI 2015, 33, 83–102. [Google Scholar] [CrossRef]
  30. Petrucco, C.; Agostini, D. Teaching our cultural heritage using mobile augmented reality. J. E-Learn. Knowl. Soc. 2016, 12, 115–128. [Google Scholar]
  31. Luna, U.; Rivero, P.; Vicent, N. Augmented Reality in Heritage Apps: Current Trends in Europe. Appl. Sci. 2019, 9, 2756. [Google Scholar] [CrossRef]
  32. Torres, M.; Qiu, G. Picture the Past from the Present. In Proceedings of the 3rd International Conference on Internet Multimedia Computing and Service, Chengdu, China, 5–7 August 2011; pp. 51–54. [Google Scholar]
  33. Chang, Y.L.; Hou, H.T.; Pan, C.Y.; Sung, Y.T.; Chang, K.E. Apply an Augmented Reality in a Mobile Guidance to Increase Sense of Place for Heritage Places. Educ. Technol. Soc. 2015, 18, 166–178. [Google Scholar]
  34. Milgram, P.; Takemura, H.; Utsumi, A.; Kishino, F. Augmented Reality: A class of displays on the reality-virtuality continuum. SPIE 1994, 2351, 282–292. [Google Scholar]
  35. Roya, R.; Azizul, H.; Ozlem, T. Augmented Reality Apps for Tourism Destination Promotion. In Apps Management and E-Commerce Transactions in Real-Time; Sajad, R., Ed.; IGI Global: Hershey, PA, USA, 2017; pp. 236–251. [Google Scholar]
  36. Tom Dieck, M.C.; Jung, T. A Theoretical Model of Mobile Augmented Reality Acceptance in Urban Heritage Tourism. Curr. Issues Tour. 2018, 21, 154–174. [Google Scholar] [CrossRef]
  37. Candela, L.; Castelli, D.; Pagano, P. Virtual research environments: An overview and a research agenda. Data Sci. J. 2013, 12, GRDI75–GRDI81. [Google Scholar] [CrossRef]
  38. Meyer, E.; Grussenmeyer, P.; Perrin, J.P.; Durand, A.; Drap, P. A web information system for the management and the dissemination of Cultural Heritage data. J. Cult. Herit. 2007, 8, 396–411. [Google Scholar] [CrossRef]
  39. Kuroczynski, P. Virtual Research Environment for digital 3D reconstructions—Standards, thresholds and prospects. Stud. Digit. Herit. 2017, 1, 456–476. [Google Scholar] [CrossRef]
  40. Friedrichs, K.; Kröber, C.; Bruschke, J.; Münster, S. Creating suitable tools for art and architectural research with digital libraries. In Digital Research and Education in Architectural Heritage. 5th Conference, DECH 2017, and First Workshop, UHDL 2017, Dresden, Germany, 30–31 March 2017, Revised Selected Papers; Münster, S., Friedrichs, K., Niebling, F., Seidel-Grzesinska, A., Eds.; Springer: Berlin/Heidelberg, Germany, 2018; pp. 117–138. [Google Scholar]
  41. Münster, S.; Jahn, P.-H.; Wacker, M. Von Plan- und Bildquellen zum virtuellen Gebäudemodell. Zur Bedeutung der Bildlichkeit für die digitale 3D-Rekonstruktion historischer Architektur. In Bildlichkeit im Zeitalter der Modellierung. Operative Artefakte in Entwurfsprozessen der Architektur und des Ingenieurwesens; Ammon, S., Hinterwaldner, I., Eds.; Eikones; Wilhelm Fink Verlag: München, Germany, 2017; pp. 255–286. [Google Scholar]
  42. Brandt, A.V. Werkzeug des Historikers; Kohlhammer: Stuttgart, Germany, 2012. [Google Scholar]
  43. Wohlfeil, R. Das Bild als Geschichtsquelle. Hist. Z. 1986, 243, 91–100. [Google Scholar] [CrossRef]
  44. Favro, D. In the eyes of the beholder: Virtual Reality re-creations and academia. In Imaging Ancient Rome: Documentation, Visualization, Imagination: Proceedings of the 3rd Williams Symposium on Classical Architecture, Rome, Italy, 20–23 May 2004; Haselberger, L., Humphrey, J., Abernathy, D., Eds.; Journal of Roman Archaeology: Portsmouth, UK, 2006; pp. 321–334. [Google Scholar]
  45. Niccolucci, F.; Hermon, S. A Fuzzy Logic Approach to Reliability in Archaeological Virtual Reconstruction. In Beyond the Artifact: Digital Interpretation of the Past. Proceedings of CAA2004, Prato, Italy, 13–17 April 2004; Niccolucci, F., Hermon, S., Eds.; Archaeolingua: Budapest, Hungary, 2010; pp. 28–35. [Google Scholar]
  46. Bürger, S. Unregelmässigkeit als Anreiz zur Ordnung oder Impuls zum Chaos. Die virtuose Steinmetzkunst der Pirnaer Marienkirche. Z. Kunstgesch. 2011, 74, 123–132. [Google Scholar]
  47. Andersen, K. The Geometry of an Art. In The History of the Mathematical Theory of Perspective from Alberti to Monge; Springer: New York, NY, USA, 2007. [Google Scholar]
  48. Beaudoin, J.E. An Investigation of Image Users across Professions: A Framework of Their Image Needs, Retrieval and Use; Drexel University: Philadelphia, PA, USA, 2009. [Google Scholar]
  49. European Union. Now Online: “Europeana”, Europe’s Digital Library (IP/08/XXX); European Union: Brussels, Belgium, 2008. [Google Scholar]
  50. Heine, K.; Brasse, C.; Wulf, U. WWW-Based Building Information System for “Domus Severiana” Palace at Palatine in Rome by Open Source Software. In Proceedings of the 7th International conference on Virtual Reality, Archaeology and Intelligent Cultural Heritage, Nicosia, Cyprus, 3 October–4 November 2006; pp. 75–82. [Google Scholar]
  51. Wulf, U.; Riedel, A. Investigating buildings three-dimensionally. The “Domus Severiana” on the Palatine. In Imaging Ancient Rome: Documentation, Visualization, Imagination, Proceedings of the 3rd Williams Symposium on Classical Architecture, Rome, Italy, 20–23 May 2004; Haselberger, L., Humphrey, J., Abernathy, D., Eds.; Journal of Roman Archaeology: Portsmouth, UK, 2006; pp. 221–233. [Google Scholar]
  52. Messaoudi, T.; Veron, P.; Halin, G.; De Luca, L. An ontological model for the reality- based 3D annotation of heritage building conservation state. J. Cult. Herit. 2018, 29, 100–112. [Google Scholar] [CrossRef]
  53. Glaessgen, E.; Stargel, D. The Digital Twin Paradigm for Future NASA and U.S. Air Force Vehicles. In Proceedings of the 53rd AIAA/ASME/ASCE/AHS/ASC Structures, Structural Dynamics and Materials Conference, Honolulu, HI, USA, 23–26 April 2012. [Google Scholar]
  54. Jaillot, V. 3D, Temporal and Documented Cities: Formalization, Visualization and Navigation; HAL: Lyon, France, 2020. [Google Scholar]
  55. Zhang, X.; Yang, D.; Yow, C.; Huang, L.; Wu, X.; Huang, X.; Guo, J.; Zhou, S.; Cai, Y. Metaverse for Cultural Heritages. Electronics 2022, 11, 3730. [Google Scholar] [CrossRef]
  56. Jobe, W. Native Apps vs. Mobile Web Apps. Int. J. Interact. Mob. Technol. 2013, 7, 27–32. [Google Scholar] [CrossRef]
  57. Gura, T. Citizen science: Amateur experts. Nature 2013, 496, 259–261. [Google Scholar] [CrossRef] [PubMed]
  58. Bonacchi, C.; Bevan, A.; Pett, D.; Keinan-Schoonbaert, A.; Sparks, R.; Wexler, J.; Wilkin, N. Crowd-sourced Archaeological Research: The MicroPasts Project. Archaeol. Int. 2014, 17, 61–68. [Google Scholar] [CrossRef]
  59. Vincent, M.L.; Gutierrez, M.F.; Coughenour, C.; Manuel, V.; Bendicho, L.-M.; Remondino, F.; Fritsch, D. Crowd-sourcing the 3D digital reconstructions of lost cultural heritage. In Proceedings of the Digital Heritage, Granada, Spain, 28 September–2 October 2015; pp. 171–172. [Google Scholar]
  60. Gerth, B.; Berndt, R.; Havemann, S.; Fellner, D.W. 3D Modeling for Non-Expert Users with the Castle Construction Kit v0.5. In 6th International Symposium on Virtual Reality, Archaeology and Cultural Heritage (VAST 2005); Mudge, M., Ryan, N., Scopigno, R., Eds.; Eurographics Association: Pisa, Italy, 2005; pp. 49–57. [Google Scholar]
  61. Umweltbundesamt. Konzept zur Anwendbarkeit von Citizen Science in der Ressortforschung des Umweltbundesamtes; Umweltbundesamt: Dessau-Roßlau, Germany, 2017. [Google Scholar]
  62. Popple, S.; Mutibwa, D.H. Tools You Can Trust? Co-design in Community Heritage Work. In Cultural Heritage in a Changing World; Borowiecki, K.J., Forbes, N., Fresa, A., Eds.; Springer International Publishing: Cham, Switzerland, 2016; pp. 197–214. [Google Scholar]
  63. Claisse, C.; Ciolfi, L.; Petrelli, D. Containers of Stories: Using co-design and digital augmentation to empower the museum community and create novel experiences of heritage at a house museum. Des. J. 2017, 20, S2906–S2918. [Google Scholar] [CrossRef]
  64. Avram, G.; Maye, L. Co-designing Encounters with Digital Cultural Heritage. In Proceedings of the 2016 ACM Conference Companion Publication on Designing Interactive Systems, Brisbane, Australia, 4–8 June 2016; pp. 17–20. [Google Scholar]
  65. Cyberpiper. 1867 Historical Role Play. Available online: https://www.roblox.com/games/3030166262/1867-Historical-Role-Play (accessed on 29 January 2022).
  66. Münster, S.; Georgi, C.; Heijne, K.; Klamert, K.; Nönnig, J.R.; Pump, M.; Stelzle, B.; Meer, H.V.D. How to involve inhabitants in urban design planning by using digital tools? An overview on a state of the art, key challenges and promising approaches. Procedia Comput. Sci. 2017, 112, 2391–2405. [Google Scholar] [CrossRef]
  67. Elliott, K.C.; Rosenberg, J. Philosophical Foundations for Citizen Science. Citiz. Sci. Theory Pract. 2019, 4, 9. [Google Scholar] [CrossRef]
  68. Prats López, M.; Soekijad, M.; Berends, H.; Huysman, M. A Knowledge Perspective on Quality in Complex Citizen Science. Citiz. Sci. Theory Pract. 2020, 5, 15. [Google Scholar] [CrossRef]
  69. Bonney, R.; Ballard, H.; Jordan, R.; McCallie, E.; Phillips, T.; Shirk, J. Public Participation in Scientific Research: Defining the Field and Assessing Its Potential for Informal Science Education; A CAISE Inquiry Group Report; ERIC: Washington, DC, USA, 2009. [Google Scholar]
  70. May, M.J.; Kantor, E.; Zror, N. CemoMemo: Making More Out of Gravestones (With Help from the Crowd). Acm J. Comput. Cult. Herit. 2021, 14, 57. [Google Scholar] [CrossRef]
  71. Roche, J.; Bell, L.; Galvao, C.; Golumbic, Y.N.; Kloetzer, L.; Knoben, N.; Laakso, M.; Lorke, J.; Mannion, G.; Massetti, L.; et al. Citizen Science, Education, and Learning: Challenges and Opportunities. Front. Sociol. 2020, 5, 613814. [Google Scholar] [CrossRef] [PubMed]
  72. Haumann, A.-R.; Smolarski, R. Digital project meets analog community. Expectations and experiences in a digital citizen science project on GDR history. In Proceedings of the Austrian Citizen Science Conference 2020, Vienna, Austria, 14–16 September 2020. [Google Scholar] [CrossRef]
  73. Capurro, C.; Plets, G.; Verheul, J. Digital heritage infrastructures as cultural policy instruments: Europeana and the enactment of European citizenship. Int. J. Cult. Policy 2023, 1–21. [Google Scholar] [CrossRef]
  74. Deitke, M.; Liu, R.; Wallingford, M.; Ngo, H.; Michel, O.; Kusupati, A.; Fan, A.; Laforte, C.; Voleti, V.; Gadre, S.Y.; et al. Objaverse-XL: A Universe of 10M+ 3D Objects. Adv. Neural Inf. Process. Syst. 2023, 36. [Google Scholar]
  75. Chang, A.X.; Funkhouser, T.; Guibas, L.; Hanrahan, P.; Huang, Q.; Li, Z.; Savarese, S.; Savva, M.; Song, S.; Su, H. Shapenet: An information-rich 3d model repository. arXiv 2015, arXiv:1512.03012. [Google Scholar]
  76. Flynn, T. Over 100,000 Cultural Heritage Models on Sketchfab. Sketchfab Community Blog 2019, 7. [Google Scholar]
  77. Snavely, N.; Seitz, S.M.; Szeliski, R. Modeling the World from Internet Photo Collection. Int. J. Comput. Vis. 2007, 80, 189–210. [Google Scholar] [CrossRef]
  78. Wu, X.; Averbuch-Elor, H.; Sun, J.; Snavely, N. Towers of Babel: Combining Images, Language, and 3D Geometry for Learning Multimodal Vision. In Proceedings of the IEEE/CVF International Conference on Computer Vision, Montreal, QC, Canada, 11–17 October 2021. [Google Scholar]
  79. Stathopoulou, E.K.; Welponer, M.; Remondino, F. Open-Source Image-Based 3d Reconstruction Pipelines: Review, Comparison and Evaluation. Int. Arch. Photogramm. Remote Sens. Spat. Inf. Sci. 2019, XLII-2/W17, 331–338. [Google Scholar] [CrossRef]
  80. Maiwald, F.; Komorowicz, D.; Munir, I.; Beck, C.; Muenster, S. Semi-automatic generation of historical urban 3D models at a larger scale using Structure-from-Motion, Neural Rendering and historical maps. In Research and Education in Urban History in the Age of Digital Libraries. Third International Workshop, UHDL 2023, Munich, Germany, 27–28 March 2023; Revised Selected Papers; Münster, S., Kröber, C., Pattee, A., Niebling, F., Eds.; Springer CCIS: Cham, Switzerland, 2023. [Google Scholar]
  81. Münster, S. Advancements in 3D Heritage Data Aggregation and Enrichment in Europe: Implications for Designing the Jena Experimental Repository for the DFG 3D Viewer. Appl. Sci. 2023, 13, 9781. [Google Scholar] [CrossRef]
  82. Schüller, K.; Busch, P.; Hindinger, C. Future Skills: Ein Framework für Data Literacy. HFD Position Pap. 2019, 47, 297–317. [Google Scholar]
  83. Alias, M.; Black, T.R.; Gray, D.E. Effect of Instructions on Spatial Visualisation Ability in Civil Engineering Students. Int. Educ. J. 2002, 3, 1–12. [Google Scholar]
  84. Sprünker, J. Making on-line cultural heritage visible for educational proposes. In Proceedings of the Digital Heritage International Congress (DigitalHeritage), Marseille, France, 28 October–1 November 2013; pp. 405–408. [Google Scholar]
  85. Kröber, C.; Münster, S. An App for the Cathedral in Freiberg—An Interdisciplinary Project Seminar. In Proceedings of the 11th International Conference on Cognition and Exploratory Learning in Digital Age (CELDA 2014), Porto, Portugal, 25–27 October 2014; pp. 270–274. [Google Scholar]
  86. Muenster, S. Digital 3D Technologies for Humanities Research and Education: An Overview. Appl. Sci. 2022, 12, 2426. [Google Scholar] [CrossRef]
  87. Polanyi, M. The Tacit Dimension, 18th ed.; University of Chicago Press: Chicago, IL, USA, 1966. [Google Scholar]
  88. Münster, S. Workflows and the role of images for a virtual 3D reconstruction of no longer extant historic objects. In Proceedings of the XXIV International CIPA Symposium, Strasbourg, France, 2–6 September 2013; pp. 197–202. [Google Scholar]
  89. Wallace, M.; Poulopoulos, V.; Antoniou, A.; López-Nores, M. An Overview of Big Data Analytics for Cultural Heritage. Big Data Cogn. Comput. 2023, 7, 14. [Google Scholar] [CrossRef]
  90. Stylianidis, E.; Remondino, F. 3D Recording, Documentation and Management of Cultural Heritage; Whittles Publishing: Dunbeath, UK, 2016. [Google Scholar]
  91. Ramos, M.M.; Remondino, F. Data fusion in Cultural Heritage—A Review. Int. Arch. Photogramm. Remote Sens. Spat. Inf. Sci. 2015, 40, 359–363. [Google Scholar] [CrossRef]
  92. Remondino, F.; Campana, S. 3D Recording and Modelling in Archaeology and Cultural Heritage: Theory and best practices. BAR Int. Ser. 2014, 2598, 111–127. [Google Scholar]
  93. Storeide, M.; George, S.; Sole, A.; Hardeberg, J.Y. Standardization of digitized heritage: A review of implementations of 3D in cultural heritage. Herit. Sci. 2023, 11, 249. [Google Scholar] [CrossRef]
  94. Maiwald, F.; Vietze, T.; Schneider, D.; Henze, F.; Münster, S.; Niebling, F. Photogrammetric analysis of historical image repositories for virtual reconstruction in the field of digital humanities. Int. Arch. Photogramm. Remote Sens. Spat. Inf. Sci. 2017, 42, 447–452. [Google Scholar] [CrossRef]
  95. ISO. BIM—The Present EN ISO 19650 Standards Provide the Construction Industry with an Approach to Manage and Exchange Information on Projects. Available online: https://group.thinkproject.com/de/ressourcen/bim-standards-und-praktiken/ (accessed on 2 February 2022).
  96. Münster, S.; Apollonio, F.; Blümel, I.; Fallavollita, F.; Foschi, R.; Grellert, M.; Ioannides, M.; Jahn, P.H.; Kurdiovsky, R.; Kuroczynski, P.; et al. Handbook of Digital 3D Reconstruction of Historical Architecture; Springer: Berlin/Heidelberg, Germany, 2023. [Google Scholar]
  97. Lowe, D.G. Distinctive image features from scale-invariant keypoints. Int. J. Comput. Vis. 2004, 60, 91–110. [Google Scholar] [CrossRef]
  98. Maiwald, F.; Schneider, D.; Henze, F.; Niebling, F.; Münster, S.; Niebling, F. Feature matching of historical images based on geometry of quadrilaterals. ISPRS Int. Ann. Photogramm. Remote Sens. Spat. Inf. Sci. 2018, 42, 643–650. [Google Scholar] [CrossRef]
  99. Snavely, N.; Seitz, S.M.; Szeliski, R. Photo tourism: Exploring photo collections in 3D. Acm Trans. Graph. 2006, 25, 835–846. [Google Scholar] [CrossRef]
  100. Hepp, B.; Niessner, M.; Hilliges, O. Plan3D: Viewpoint and Trajectory Optimization for Aerial Multi-View Stereo Reconstruction. Comput. Vis. Pattern Recognit. (Cs.CV) 2018, 38, 1–17. [Google Scholar] [CrossRef]
  101. Adamopoulos, E.; Rinaudo, F.; Ardissono, L. A Critical Comparison of 3D Digitization Techniques for Heritage Objects. ISPRS Int. J. Geo-Inf. 2020, 10, 10. [Google Scholar] [CrossRef]
  102. Scan2CAD. Scan2CAD: Learning to Digitize the Real World. Available online: https://cordis.europa.eu/project/id/804724 (accessed on 8 February 2022).
  103. Torresani, A.; Remondino, F. Videogrammetry Vs Photogrammetry for Heritage 3d Reconstruction. Int. Arch. Photogramm. Remote Sens. Spat. Inf. Sci. 2019, 42, 1157–1162. [Google Scholar] [CrossRef]
  104. Rahaman, H. Potogrammetry: What, Where, How. In Virtual Heritage: A Guide; Champion, E., Champion, E., Eds.; Ubiquity Press: London, UK, 2021. [Google Scholar]
  105. Blettery, E.; Fernandes, N.; Gouet-Brunet, V. How to Spatialize Geographical Iconographic Heritage. In Proceedings of the 3rd Workshop on Structuring and Understanding of Multimedia heritAge Contents, Virtual Event, 20 October 2021; pp. 31–40. [Google Scholar]
  106. Remondino, F.; Nocerino, E.; Toschi, I.; Menna, F. A Critical Review of Automated Photogrammetric Processing of Large Datasets. Int. Arch. Photogramm. Remote Sens. Spat. Inf. Sci. 2017, 42, 591–599. [Google Scholar] [CrossRef]
  107. O’Driscoll, J. Landscape applications of photogrammetry using unmanned aerial vehicles. J. Archaeol. Sci. Rep. 2018, 22, 32–44. [Google Scholar] [CrossRef]
  108. Drap, P. Underwater Photogrammetry for Archaeology. In Special Applications of Photogrammetry; Carneiro da Silva, D., Ed.; IntechOpen: London, UK, 2012. [Google Scholar]
  109. Grilli, E.; Menna, F.; Remondino, F. A Review of Point Clouds Segmentation and Classification Algorithms. Int. Arch. Photogramm. Remote Sens. Spat. Inf. Sci. 2017, 42, 339–344. [Google Scholar] [CrossRef]
  110. Goesele, M.; Curless, B.; Seitz, S.M. Multi-view stereo revisited. IEEE Comput. Soc. Conf. Comput. Vis. Pattern Recognit. 2006, 2, 2402–2409. [Google Scholar]
  111. Seitz, S.M.; Curless, B.; Diebel, J.; Scharstein, D.; Szeliski, R. A Comparison and Evaluation of Multi-View Stereo Reconstruction Algorithms. In Proceedings of the 2006 IEEE Computer Society Conference on Computer Vision and Pattern Recognition, New York, NY, USA, 17–22 June 2006; Volume 1, pp. 519–528. [Google Scholar]
  112. Pomaska, G. Zur Dokumentation und 3D-Modellierung von Denkmalen mit digitalen fotografischen Verfahren. In Von Handaufmaß bis High Tech III—3D in der Historischen Bauforschung; Heine, K., Rheidt, K., Henze, F., Riedel, A., Eds.; Verlag Philipp von Zabern: Mainz, Germany, 2011; pp. 26–32. [Google Scholar]
  113. Schaffland, A.; Vornberger, O.; Heidemann, G. An Interactive Web Application for the Creation, Organization, and Visualization of Repeat Photographs. In Proceedings of the 1st Workshop on Structuring and Understanding of Multimedia heritAge Contents—SUMAC ‘19, Nice, France, 21 October 2019; pp. 47–54. [Google Scholar]
  114. Schaffland, A.; Bui, T.H.; Vornberger, O.; Heidemann, G. New Interactive Methods for Image Registration with Applications in Repeat Photography. In Proceedings of the 2nd Workshop on Structuring and Understanding of Multimedia heritAge Contents, Seattle, WA, USA, 12 October 2020; pp. 41–48. [Google Scholar]
  115. Condorelli, F.; Rinaudo, F. Processing Historical Film Footage with Photogrammetry and Machine Learning for Cultural Heritage Documentation. In Proceedings of the 1st Workshop on Structuring and Understanding of Multimedia heritAge Contents—SUMAC ‘19, Nice, France, 21 October 2019; pp. 39–46. [Google Scholar]
  116. Maiwald, F. Generation of a Benchmark Dataset Using Historical Photographs for an Automated Evaluation of Different Feature Matching Methods. Int. Arch. Photogramm. Remote Sens. Spat. Inf. Sci. 2019, 42, 87–94. [Google Scholar] [CrossRef]
  117. Maiwald, F.; Lehmann, C.; Lazariv, T. Fully Automated Pose Estimation of Historical Images in the Context of 4D Geographic Information Systems Utilizing Machine Learning Methods. Isprs Int. J. Geo-Inf. 2021, 10, 748. [Google Scholar] [CrossRef]
  118. Yi, K.M.; Trulls, E.; Lepetit, V.; Fua, P. LIFT: Learned Invariant Feature Transform. In Proceedings of the Computer Vision–ECCV 2016: 14th European Conference, Amsterdam, The Netherlands, 11–14 October 2016; pp. 467–483. [Google Scholar]
  119. Krizhevsky, A.; Sutskever, I.; Hinton, G.E. ImageNet classification with deep convolutional neural networks. Commun. ACM 2017, 60, 84–90. [Google Scholar] [CrossRef]
  120. Jahrer, M.; Grabner, M.; Bischof, H. Learned local descriptors for recognition and matching. In Proceedings of the Computer Vision Winter Workshop 2008, Moravske Toplice, Slovenia, 4–6 February 2008; Volume 2, pp. 39–46. [Google Scholar]
  121. Fiorucci, M.; Khoroshiltseva, M.; Pontil, M.; Traviglia, A.; Del Bue, A.; James, S. Machine Learning for Cultural Heritage: A Survey. Pattern Recognit. Lett. 2020, 133, 102–108. [Google Scholar] [CrossRef]
  122. Münster, S.; Apollonio, F.I.; Bell, P.; Kuroczynski, P.; Di Lenardo, I.; Rinaudo, F.; Tamborrino, R. Digital Cultural Heritage Meets Digital Humanities. Int. Arch. Photogramm. Remote Sens. Spat. Inf. Sci. 2019, 42, 813–820. [Google Scholar] [CrossRef]
  123. Bell, P.; Ommer, B. Computer Vision und Kunstgeschichte—Dialog zweier Bildwissenschaften. In Digital Art History; Kuroczynski, P., Bell, P., Dieckmann, L., Eds.; arthistoricum.net: Heidelberg, Germany, 2019; pp. 61–78. [Google Scholar]
  124. Martinovic, A.; Knopp, J.; Riemenschneider, H.; Van Gool, L. 3d all the way: Semantic segmentation of urban scenes from start to end in 3d. In Proceedings of the IEEE Computer Vision & Pattern Recognition, Boston, MA, USA, 7–12 June 2015; pp. 4456–4465. [Google Scholar]
  125. Hackel, T.; Wegner, J.D.; Schindler, K. Fast semantic segmentation of 3D point clouds with strongly varying density. ISPRS Ann. 2016, 3, 177–184. [Google Scholar]
  126. Aiger, D.; Allen, B.; Golovinskiy, A. Large-Scale 3D Scene Classification with Multi-View Volumetric CNN. arXiv 2017, arXiv:1712.09216. [Google Scholar]
  127. n.b. ArchiMediaL. Enriching and Linking Historical Architectural and Urban Image Collections. Available online: http://archimedial.eu (accessed on 17 February 2024).
  128. Radovic, M.; Adarkwa, O.; Wang, Q.S. Object Recognition in Aerial Images Using Convolutional Neural Networks. J. Imaging 2017, 3, 21. [Google Scholar] [CrossRef]
  129. Khademi, S.; Mager, T.; Siebes, R. Deep Learning from History. In Research and Education in Urban History in the Age of Digital Libraries; UHDL, 2019; Niebling, F., Münster, S., Messemer, H., Eds.; Springer International Publishing: Cham, Switzerland, 2021; pp. 213–233. [Google Scholar]
  130. Maiwald, F. A Window to the Past through Modern Urban Environments—Developing a Photogrammetric Workflow for the Orientation Parameter Estimation of Historical Images; TU Dresden: Dresden, Germany, 2022. [Google Scholar]
  131. Gominski, D.; Poreba, M.; Gouet-Brunet, V.; Chen, L. Challenging Deep Image Descriptors for Retrieval in Heterogeneous Iconographic Collections. In Proceedings of the 1st Workshop on Structuring and Understanding of Multimedia heritAge Contents, Nice, France, 21 October 2019; pp. 31–38. [Google Scholar]
  132. Morelli, L.; Bellavia, F.; Menna, F.; Remondino, F. Photogrammetry now and then—From hand-crafted to deep-learning tie points. Int. Arch. Photogramm. Remote Sens. Spat. Inf. Sci. 2022, 48, 163–170. [Google Scholar] [CrossRef]
  133. 4dReply. Closing the 4D Real World Reconstruction Loop. Available online: https://cordis.europa.eu/project/id/770784 (accessed on 8 February 2022).
  134. Martin-Brualla, R.; Radwan, N.; Sajjadi, M.S.M.; Barron, J.T.; Dosovitskiy, A.; Duckworth, D. NeRF in the Wild: Neural Radiance Fields for Unconstrained Photo Collections. In Proceedings of the IEEE/CVF Conference on Computer Vision and Pattern Recognition, Nashville, TN, USA, 20–25 June 2021. [Google Scholar]
  135. Cho, J.; Zala, A.; Bansal, M. DALL-Eval: Probing the Reasoning Skills and Social Biases of Text-to-Image Generative Transformers. In Proceedings of the IEEE/CVF International Conference on Computer Vision, Paris, France, 2–6 October 2023; pp. 3043–3054. [Google Scholar]
  136. Mildenhall, B.; Srinivasan, P.P.; Tancik, M.; Barron, J.T.; Ramamoorthi, R.; Ng, R. NeRf: Representing scenes as neural radiance fields for view synthesis. Commun. ACM 2021, 65, 99–106. [Google Scholar] [CrossRef]
  137. Srinivasan, P.P.; Deng, B.; Zhang, X.; Tancik, M.; Mildenhall, B.; Barron, J.T. Nerf: Neural reflectance and visibility fields for relighting and view synthesis. In Proceedings of the IEEE/CVF Conference on Computer Vision and Pattern Recognition, Nashville, TN, USA, 20–25 June 2021; pp. 7495–7504. [Google Scholar]
  138. Li, Z.; Wang, Q.; Cole, F.; Tucker, R.; Snavely, N. DynIBaR: Neural Dynamic Image-Based Rendering. In Proceedings of the IEEE/CVF Conference on Computer Vision and Pattern Recognition, Vancouver, BC, Canada, 17–24 June 2023. [Google Scholar]
  139. Kaya, B.; Kumar, S.; Sarno, F.; Ferrari, V.; Gool, L. Neural Radiance Fields Approach to Deep Multi-View Photometric Stereo. arXiv 2021, arXiv:2110.05594. [Google Scholar]
  140. Kniaz, V.V.; Remondino, F.; Knyaz, V.A. Generative Adversarial Networks for Single Photo 3d Reconstruction. Int. Arch. Photogramm. Remote Sens. Spat. Inf. Sci. 2019, 42, 403–408. [Google Scholar] [CrossRef]
  141. Hermoza, R.; Sipiran, I. 3D Reconstruction of incomplete Archaeological Objects using a Generative Adversarial Network. In Proceedings of the Computer Graphics International 2018, Bintan Island, Indonesia, 11–14 June 2018; pp. 5–11. [Google Scholar]
  142. Nogales Moyano, A.; Delgado Martos, E.; Melchor, Á.; García Tejedor, Á.J. ARQGAN: An Evaluation of Generative Adversarial Networks’ Approaches for Automatic Virtual Restoration of Greek Temples. Expert Syst. Appl. 2021, 180, 115092. [Google Scholar] [CrossRef]
  143. Microsoft In Culture. See Ancient Olympia Brought to Life. 2021. Available online: https://www.linkedin.com/posts/microsoft_see-ancient-olympiabrought-tolife-activity-6864238527945814017-JWO0/?trk=public_profile_like_view (accessed on 10 February 2024).
  144. Zielke, T. Is Artificial Intelligence Ready for Standardization? In Proceedings of the Systems, Software and Services Process Improvement: 27th European Conference, EuroSPI 2020, Düsseldorf, Germany, 9–11 September 2020. [Google Scholar]
  145. Liu, C.; Wu, J.; Kohli, P.; Furukawa, Y. Raster-To-Vector: Revisiting Floorplan Transformation. In Proceedings of the IEEE International Conference on Computer Vision (ICCV), Venice, Italy, 22–29 October 2017; pp. 2195–2203. [Google Scholar]
  146. Oliveira, S.A.; Seguin, B.; Kaplan, F. dhSegment: A Generic Deep-Learning Approach for Document Segmentation. In Proceedings of the 2018 16th International Conference on Frontiers in Handwriting Recognition (ICFHR), Niagara Falls, NY, USA, 5–8 August 2018; pp. 7–12. [Google Scholar]
  147. Ignjatić, J.; Nikolić, B.; Rikalović, A.; Ćulibrk, D. Deep Learning for Historical Cadastral Maps Digitization: Overview, Challenges and Potential. Comput. Sci. Res. Notes 2018, 2803, 42–47. [Google Scholar]
  148. Petitpierre, R.; Kaplan, F.; di Lenardo, I. Generic Semantic Segmentation of Historical Maps. In Proceedings of the CEUR Workshop Proceedings, Amsterdam, The Netherlands, 17–19 November 2021; pp. 228–248. [Google Scholar]
  149. Petitpierre, R. Neural networks for semantic segmentation of historical city maps: Cross-cultural performance and the impact of figurative diversity. arXiv 2020, arXiv:2101.12478. [Google Scholar]
  150. Tran, A.; Zonoozi, A.; Varadarajan, J.; Kruppa, H. PP-LinkNet: Improving Semantic Segmentation of High Resolution Satellite Imagery with Multi-stage Training. In Proceedings of the 2nd Workshop on Structuring and Understanding of Multimedia heritAge Contents, Seattle, WA, USA, 12 October 2020; pp. 57–64. [Google Scholar]
  151. Crommelinck, S.; Höfle, B.; Koeva, M.; Yang, M.Y.; Vosselman, G. Interactive Boundary Delineation from UAV data. In Proceedings of the ISPRS Annals of the Photogrammetry, Remote Sensing and Spatial Information Sciences, Riva del Garda, Italy, 4–7 June 2018; pp. 81–88. [Google Scholar]
  152. Chen, Q.; Wang, L.; Wu, Y.; Wu, G.; Guo, Z.; Waslander, S.L. Aerial imagery for roof segmentation: A largescale dataset towards automatic mapping of buildings. ISPRS J. Photogramm. Remote Sens. 2018, 147, 42–55. [Google Scholar] [CrossRef]
  153. Crommelinck, S.; Koeva, M.; Yang, M.Y.; Vosselman, G. Application of Deep Learning for Delineation of Visible Cadastral Boundaries from Remote Sensing Imagery. Remote Sens. 2019, 11, 2505. [Google Scholar] [CrossRef]
  154. Hecht, R.; Meinel, G.; Buchroithner, M.F. Automatic identification of building types based on topographic databases—A comparison of different data sources. Int. J. Cartogr. 2015, 1, 18–31. [Google Scholar] [CrossRef]
  155. Betsas, T.; Georgopoulos, A. 3D Edge Detection and Comparison using Four-Channel Images. Int. Arch. Photogramm. Remote Sens. Spat. Inf. Sci. 2022, 48, 9–15. [Google Scholar] [CrossRef]
  156. Oliveira, S.A.; Lenardo, I.d.; Kaplan, F. Machine Vision Algorithms on Cadaster Plans. In Proceedings of the Conference of the International Alliance of Digital Humanities Organizations (DH 2017), Montreal, QC, Canada, 8–11 August 2017. [Google Scholar]
  157. Herold, H.; Hecht, R. 3D Reconstruction of Urban History Based on Old Maps; Springer: Cham, Switzerland, 2018; pp. 63–79. [Google Scholar]
  158. Ares Oliveira, S.; di Lenardo, I.; Tourenc, B.; Kaplan, F. A deep learning approach to Cadastral Computing. In Proceedings of the Digital Humanities Conference, Utrecht, The Netherlands, 8–12 July 2019. [Google Scholar]
  159. Heitzler, M.; Hurni, L. Cartographic reconstruction of building footprints from historical maps: A study on the Swiss Siegfried map. Trans. GIS 2020, 24, 442–461. [Google Scholar] [CrossRef]
  160. Marschner, S.; Shirley, P. Fundamentals of Computer Graphics, 4th ed.; A K Peters: Natick, MA, USA; CRC Press: Boca Raton, FL, USA, 2016. [Google Scholar]
  161. Schinko, C.; Krispel, U.; Gregor, R.; Schreck, T.; Ullrich, T. Generative Modellierung—Verknüpfung von Wissen und Form: Architektur, Generative Modellierung, Geometrische Datenverarbeitung, Produktdesign, Prozedurale Modellierung, Semantische Datenverarbeitung. In Der Modelle Tugend 2.0: Digitale 3D-Rekonstruktion als Virtueller Raum der Architekturhistorischen Forschung; Kuroczyński, P., Pfarr-Harfst, M., Münster, S., Eds.; arthistoricum.net: Heidelberg, Germany, 2019; pp. 295–311. [Google Scholar]
  162. Snickars, P. Metamodeling—3D-(re)designing Polhem’s Laboratorium mechanicum. In Der Modelle Tugend 2.0: Digitale 3D-Rekonstruktion als Virtueller Raum der Architekturhistorischen Forschung; Kuroczyński, P., Pfarr-Harfst, M., Münster, S., Eds.; arthistoricum.net: Heidelberg, Germany, 2019; pp. 509–528. [Google Scholar]
  163. Havemann, S.; Settgast, V.; Lancelle, M.; Fellner, D.W. 3D-Powerpoint—Towards a Design Tool for Digital Exhibitions of Cultural Artifacts. In Proceedings of the VAST 2007: The 8th International Symposium on Virtual Reality, Archaeology and Intelligent Cultural Heritage, Brighton, UK, 27–29 November 2007; pp. 39–46. [Google Scholar]
  164. Vaienti, B.; Petitpierre, R.; di Lenardo, I.; Kaplan, F. Machine-Learning-Enhanced Procedural Modeling for 4D Historical Cities Reconstruction. Remote Sens. 2023, 15, 3352. [Google Scholar] [CrossRef]
  165. Pfarr-Harfst, M.; Wefers, S. Digital 3D Reconstructed Models—Structuring Visualisation Project Workflows. In Digital Heritage. Progress in Cultural Heritage: Documentation, Preservation, and Protection; Lecture Notes in Computer Science; Springer: Cham, Switzerland, 2016; pp. 544–555. [Google Scholar]
  166. Farella, E.M.; Ozdemir, E.; Remondino, F. 4D Building Reconstruction with Machine Learning and Historical Maps. Appl. Sci. 2021, 11, 1445. [Google Scholar] [CrossRef]
  167. Kartta Labs. 2023. Available online: https://github.com/kartta-labs (accessed on 10 February 2024).
  168. Liu, S.; Bovolo, F.; Bruzzone, L.; Qian, D.; Tong, X. Unsupervised Change Detection in Multitemporal Remote Sensing Images. In Change Detection and Image Time Series Analysis 1; Wiley: Hoboken, NJ, USA, 2021; pp. 1–34. [Google Scholar] [CrossRef]
  169. Zhu, Z. Change detection using landsat time series: A review of frequencies, preprocessing, algorithms, and applications. ISPRS J. Photogramm. Remote Sens. 2017, 130, 370–384. [Google Scholar] [CrossRef]
  170. Goswami, A.; Sharma, D.; Mathuku, H.; Gangadharan, S.M.P.; Yadav, C.S.; Sahu, S.K.; Pradhan, M.K.; Singh, J.; Imran, H. Change Detection in Remote Sensing Image Data Comparing Algebraic and Machine Learning Methods. Electronics 2022, 11, 431. [Google Scholar] [CrossRef]
  171. Nebiker, S.; Lack, N.; Deuber, M. Building Change Detection from Historical Aerial Photographs Using Dense Image Matching and Object-Based Image Analysis. Remote Sens. 2014, 6, 8310–8336. [Google Scholar] [CrossRef]
  172. Henze, F.; Lehmann, H.; Bruschke, B. Nutzung historischer Pläne und Bilder für die Stadtforschungen in Baalbek/Libanon. Photogramm. Fernerkund. Geoinf. 2009, 3, 221–234. [Google Scholar] [CrossRef]
  173. Wang, Y. Change Detection from Photographs: Image Processing; Université Paul Sabatier: Toulouse, France, 2016. [Google Scholar]
  174. Zhang, T.; Nefs, H.; Heynderickx, I. Change detection in pictorial and solid scenes: The role of depth of field. PLoS ONE 2017, 12, e0188432. [Google Scholar] [CrossRef]
  175. Noh, H.; Ju, J.; Seo, M.; Park, J.; Choi, D.G. Unsupervised Change Detection Based on Image Reconstruction Loss. In Proceedings of the 2022 IEEE/CVF Conference on Computer Vision and Pattern Recognition Workshops (CVPRW), New Orleans, LA, USA, 19–20 June 2022; pp. 1351–1360. [Google Scholar]
  176. Kharroubi, A.; Poux, F.; Ballouch, Z.; Hajji, R.; Billen, R. Three Dimensional Change Detection Using Point Clouds: A Review. Geomatics 2022, 2, 457–485. [Google Scholar] [CrossRef]
  177. FUTURES4EUROPE. General AI. 2021. Available online: https://www.futures4europe.eu/general-ai (accessed on 1 December 2023).
  178. Salahuddin, Z.; Woodruff, H.C.; Chatterjee, A.; Lambin, P. Transparency of deep neural networks for medical image analysis: A review of interpretability methods. Comput. Biol. Med. 2022, 140, 105111. [Google Scholar] [CrossRef] [PubMed]
  179. Wikimedia. 2020. Available online: https://en.wikipedia.org/wiki/Extended_reality (accessed on 10 February 2024).
  180. Russo, M. AR in the Architecture Domain: State of the Art. Appl. Sci. 2021, 11, 6800. [Google Scholar] [CrossRef]
  181. Schoueri, K.; Papadopoulos, C.; Schreibman, S. Survey on 3D Web Infrastructures. Final Report. 2022. Available online: https://pure3d.eu/wp-content/uploads/2022/02/3D-Infrastructure-Survey-Report_PURE3D-1.pdf (accessed on 30 March 2023).
  182. Fung, N.; Schoueri, K.; Scheibler, C. Pure 3D: Comparison of Features Available on Aton, Smithsonian Voyager, 3DHOP, Kompakkt and Virtual Interiors; Technical Report; Maastricht University: Maastricht, The Netherlands, 2021. [Google Scholar]
  183. Bajena, I.; Dworak, D.; Kuroczyński, P.; Smolarski, R.; Münster, S. DFG-3D-Viewer—Development of an infrastructure for digital 3D reconstructions. In Proceedings of the DH2022 Conference Abstracts, DH2022 Local Organizing Committee, Tokyo, Japan, 25–29 July 2022. [Google Scholar]
  184. European Commission. Study on quality in 3D digitisation of tangible cultural heritage: Mapping parameters, formats, standards, benchmarks, methodologies, and guidelines. In VIGIE 2020/654 Final Study Report; Universitat Politècnica de València: València, Spain, 2022. [Google Scholar]
  185. George Artopoulos. Interactive Historic Nicosia at the Leventis Municipal Museum. Herit. Motion. 2020. Available online: https://heritageinmotion.eu/himentry/slug-c29fe2fbb5db8fb0d0cc2e44a26d5cd9 (accessed on 30 March 2023).
  186. Dörner, R.; Steinicke, F. Wahrnehmungsaspekte von VR. In Virtual und Augmented Reality (VR/AR); Dörner, R., Ed.; Springer: Berlin/Heidelberg, Germany, 2013; pp. 33–63. [Google Scholar]
  187. Kim, Y.M.; Rhiu, I. A comparative study of navigation interfaces in virtual reality environments: A mixed-method approach. Appl. Erg. 2021, 96, 103482. [Google Scholar] [CrossRef] [PubMed]
  188. Sagnier, C.; Loup-Escande, E.; Lourdeaux, D.; Thouvenin, I.; Vallery, G. User Acceptance of Virtual Reality: An Extended Technology Acceptance Model. Int. J. Hum. Comput. Interact. 2020, 36, 993–1007. [Google Scholar] [CrossRef]
  189. Tatzgern, M.; Kalkofen, D.; Schmalstieg, D. Dynamic compact visualizations for augmented reality. In Proceedings of the 2013 IEEE Virtual Reality (VR), Lake Buena Vista, FL, USA, 18–20 March 2013; pp. 3–6. [Google Scholar]
  190. Tatzgern, M.; Orso, V.; Kalkofen, D.; Jacucci, G.; Gamberini, L.; Schmalstieg, D. Adaptive information density for augmented reality displays. In Proceedings of the IEEE Virtual Reality (VR), Greenville, SC, USA, 19–23 March 2016; pp. 83–92. [Google Scholar]
  191. Büschel, W.; Reipschläger, P.; Dachselt, R. Improving 3D Visualizations. In Proceedings of the 2016 ACM Companion on Interactive Surfaces and Spaces, Niagara Falls, ON, Canada, 6–9 November 2016; pp. 63–69. [Google Scholar]
  192. Burmester, M.; Haasler, K.; Schippert, K.; Engel, V.; Tille, R.; Reinhardt, D.; Hurtienne, J. Lost in Space? 3D-Interaction-Patterns für einfache und positive Nutzung von 3D Interfaces. In Mensch und Computer 2018—Usability Professionals (Electronic Book); Hess, S., Fischer, H., Eds.; Gesellschaft für Informatik e.V. und German UPA e.V.: Bonn, Germany, 2018. [Google Scholar]
  193. Ress, S.; Cafaro, F.; Bora, D.; Prasad, D.; Soundarajan, D. Mapping History: Orienting Museum Visitors across Time and Space. Acm J. Comput. Cult. Herit. 2018, 11, 16. [Google Scholar] [CrossRef]
  194. Hornecker, E.; Ciolfi, L. Human-Computer Interactions in Museums. Synth. Lect. Hum. Centered Inform. 2019, 12, i-153. [Google Scholar] [CrossRef]
  195. Panou, C.; Ragia, L.; Dimelli, D.; Mania, K. An Architecture for Mobile Outdoors Augmented Reality for Cultural Heritage. Isprs Int. J. Geo-Inf. 2018, 7, 463. [Google Scholar] [CrossRef]
  196. Haahr, M. Creating location-based augmented-reality games for cultural heritage. In Proceedings of the Joint International Conference on Serious Games, Valencia, Spain, 23–24 November 2017; pp. 313–318. [Google Scholar]
  197. Maguid, Y. Ubisoft Creates VR Experience at Smithsonian’s Age-Old Cities Exhibition. 2020. Available online: https://news.ubisoft.com/en-us/article/6OUATm5pVU1tO6O72rTAAA/ubisoft-creates-vr-experience-at-smithsonians-ageold-cities-exhibition (accessed on 30 March 2023).
  198. Deterding, S.; Dixon, D.; Khaled, R.; Nacke, L. From game design elements to gamefulness: Defining ”gamification”. In Proceedings of the 15th International Academic MindTrek Conference: Envisioning Future Media Environments, Tampere, Finland, 28–30 September 2011; pp. 9–15. [Google Scholar]
  199. Miller, C. Digital Storytelling: A Creator’s Guide to Interactive Entertainment, 3rd ed.; Focal Press: Waltham, MA, USA, 2014. [Google Scholar]
  200. László, J. The Science of Stories: An Introduction to Narrative Psychology; Routledge: London, UK, 2008. [Google Scholar]
  201. Kahneman, D. Thinking, Fast and Slow; Penguin: London, UK, 2011. [Google Scholar]
  202. Herman, D. Storytelling and the sciences of mind: Cognitive narratology, discursive psychology, and narratives in face-to-face interaction. Narrative 2007, 15, 306–334. [Google Scholar] [CrossRef]
  203. Constantine, L.L.; Lockwood, L.A.D. Usage-centered engineering for Web applications. IEEE Softw. 2002, 19, 42–50. [Google Scholar] [CrossRef]
  204. Sylaiou, S.; Dafiotis, P. Storytelling in Virtual Museums: Engaging A Multitude of Voices. In Visual Computing for Cultural Heritage; Liarokapis, F., Voulodimos, A., Doulamis, N., Doulamis, A., Eds.; Springer Series on Cultural Computing; Springer International Publishing: Cham, Switzerland, 2020; pp. 369–388. [Google Scholar]
  205. Rizvic, S.; Okanovic, V.; Boskovic, D. Digital Storytelling. In Visual Computing for Cultural Heritage; Liarokapis, F., Voulodimos, A., Doulamis, N., Doulamis, A., Eds.; Springer Series on Cultural Computing; Springer International Publishing: Cham, Switzerland, 2020; pp. 347–367. [Google Scholar]
  206. Katifori, A.; Tsitou, F.; Pichou, M.; Kourtis, V.; Papoulias, E.; Ioannidis, Y.; Roussou, M. Exploring the Potential of Visually-Rich Animated Digital Storytelling for Cultural Heritage. In Visual Computing for Cultural Heritage; Liarokapis, F., Voulodimos, A., Doulamis, N., Doulamis, A., Eds.; Springer Series on Cultural Computing; Springer International Publishing: Cham, Switzerland, 2020; pp. 325–345. [Google Scholar]
  207. Partarakis, N.; Zabulis, X.; Antona, M.; Stephanidis, C. Transforming Heritage Crafts to Engaging Digital Experiences. In Visual Computing for Cultural Heritage; Liarokapis, F., Voulodimos, A., Doulamis, N., Doulamis, A., Eds.; Springer Series on Cultural Computing; Springer International Publishing: Cham, Switzerland, 2020; pp. 245–262. [Google Scholar]
  208. Liuzzo, P.; Mambrini, F.; Franck, P. Storytelling and Digital Epigraphy-Based Narratives in Linked Open Data. In Mixed Reality and Gamification for Cultural Heritage; Ioannides, M., Magnenat-Thalmann, N., Papagiannakis, G., Eds.; Springer International Publishing: Cham, Switzerland, 2017; pp. 507–523. [Google Scholar]
  209. Roque, M.I. Storytelling in Cultural Heritage: Tourism and Community Engagement. In Global Perspectives on Strategic Storytelling in Destination Marketing; IGI Global: Hershey, PA, USA, 2022; pp. 22–37. [Google Scholar]
  210. Glaser, M.; Lengyel, D.; Toulouse, C.; Schwan, S. Designing computer-based learning contents: Influence of digital zoom on attention. EtrD-Educ. Technol. Res. Dev. 2017, 65, 1135–1151. [Google Scholar] [CrossRef]
  211. Tversky, B. Visuospatial reasoning. In Handbook of Reasoning; Holyoak, K., Morrison, R., Eds.; Cambridge University Press: Cambridge, UK, 2005; pp. 209–249. [Google Scholar]
  212. Strothotte, T.; Masuch, M.; Isenberg, T. Visualizing Knowledge about Virtual Reconstructions of Ancient Architecture. In 1999 Proceedings Computer Graphics International; IEEE: Canmore, AB, Canada, 1999; pp. 36–43. [Google Scholar]
  213. de Boer, A.; Voorbij, J.B.; Breure, L. Towards a 3D Visualization Interface for Cultural Landscapes and Heritage Information. In Making History Interactive. 2009. Available online: https://rius.ac/index.php/rius/article/view/47 (accessed on 30 March 2023).
  214. Wood, J.; Isenberg, P.; Isenberg, T.; Dykes, J.; Boukhelifa, N.; Slingsby, A. Sketchy Rendering for Information Visualization. IEEE Trans. Vis. Comput. Graph. 2012, 18, 2749–2758. [Google Scholar] [CrossRef]
  215. Münster, S. Cultural Heritage at a Glance: Four case studies about the perception of digital architectural 3D models. In Proceedings of the 2018 3rd Digital Heritage International Congress (DigitalHERITAGE) Held Jointly with 2018 24th International Conference on Virtual Systems & Multimedia (VSMM 2018), San Francisco, CA, USA, 26–30 October 2018; pp. 1–4. [Google Scholar]
  216. Grau, O. Die Sehnsucht, im Bild zu Sein. Zur Kunstgeschichte der Virtuellen Realität; Humboldt-Universität zu Berlin: Berlin, Germany, 1999. [Google Scholar]
  217. Heeb, N.; Christen, J. Strategien zur Vermittlung von Fakt, Hypothese und Fiktion in der digitalen Architektur-Rekonstruktion. In Der Modelle Tugend 2.0: Digitale 3D-Rekonstruktion als Virtueller Raum der Architekturhistorischen Forschung; Kuroczyński, P., Pfarr-Harfst, M., Münster, S., Eds.; arthistoricum.net: Heidelberg, Germany, 2019; pp. 226–254. [Google Scholar]
  218. Sayeed, R.; Howard, T. State of the Art Non-Photorealistic Rendering (NPR) Techniques. In EG UK Theory and Practice of Computer Graphics; McDerby, M., Lever, L., Eds.; The Eurographics Association: Eindhoven, The Netherlands, 2006; pp. 1–10. [Google Scholar]
  219. Roussou, M.; Drettakis, G. Photorealism and Non-Photorealism in Virtual Heritage Representation. In VAST2003 4th International Symposium on Virtual Reality, Archaeology, and Intelligent Cultural Heritage; Arnold, D., Chalmers, A., Niccolucci, F., Eds.; Eurographics Publications: Aire-La-Ville, Switzerland, 2003; pp. 51–60. [Google Scholar]
  220. Spiegelhalter, D.; Pearson, M.; Short, I. Visualizing uncertainty about the future. Science 2011, 333, 1393–1400. [Google Scholar] [CrossRef]
  221. Pang, A.T.; Wittenbrink, C.M.; Lodha, S.K. Approaches to uncertainty visualization. Vis. Comput. 1997, 13, 370–390. [Google Scholar] [CrossRef]
  222. Mütterlein, J.; Hess, T. Immersion, Presence, Interactivity: Towards a Joint Understanding of Factors Influencing Virtual Reality Acceptance and Use. In Proceedings of the 23rd Americas Conference on Information Systems (AMCIS), Boston, MA, USA, 10–12 August 2017. [Google Scholar]
  223. Dudek, I.; Blaise, J.-Y.; De Luca, L.; Bergerot, L.; Renaudin, N. How was this done? An attempt at formalising and memorising a digital asset’s making-of. Digit. Herit. 2015, 2, 343–346. [Google Scholar]
  224. Apollonio, F.I.; Gaiani, M.; Sun, Z. 3D Modeling and Data Enrichment in Digital Reconstruction of Architectural Heritage. Int. Arch. Photogramm. Remote Sens. Spat. Inf. Sci. 2013, 40, 43–48. [Google Scholar] [CrossRef]
  225. Apollonio, F.I. Classification Schemes for Visualization of Uncertainty in Digital Hypothetical Reconstruction. In 3D Research Challenges in Cultural Heritage II: How to Manage Data and Knowledge Related to Interpretative Digital 3D Reconstructions of Cultural Heritage; Münster, S., Pfarr-Harfst, M., Kuroczyński, P., Ioannides, M., Eds.; Springer International Publishing: Cham, Switzerland, 2016; pp. 173–197. [Google Scholar]
  226. Lengyel, D.; Toulouse, C. Darstellung von unscharfem Wissen in der Rekonstruktion historischer Bauten. In Von Handaufmaß bis High Tech III. 3D in der Historischen Bauforschung; Heine, K., Rheidt, K., Henze, F., Riedel, A., Eds.; Verlag Philipp von Zabern: Darmstadt, Germany, 2011; pp. 182–186. [Google Scholar]
  227. Fornaro, P. 3D-Darstellungen in virtuellen Forschungsumgebungen: 3D-Visualisierung, Annotationen, Bildvergleich, Digitale Nachhaltigkeit, Kommentare, Reflection Transformation Imaging, Regionen in Bilddarstellungen, Reproduzierbarkeit digitaler Darstellungen, Virtuelle Forschungsumgebung, WebGL, Zitierfähigkeit. In Der Modelle Tugend 2.0: Digitale 3D-Rekonstruktion als Virtueller Raum der Architekturhistorischen Forschung; Kuroczyński, P., Pfarr-Harfst, M., Münster, S., Eds.; arthistoricum.net: Heidelberg, Germany, 2019; pp. 391–409. [Google Scholar]
  228. Yaneva, A. Scaling up and down: Extraction trials in architectural design. Soc. Stud. Sci. 2005, 35, 867–894. [Google Scholar] [CrossRef]
  229. Bernardini, W.; Barnash, A.; Kumler, M.; Wong, M. Quantifying visual prominence in social landscapes. J. Archaeol. Sci. 2013, 40, 3946–3954. [Google Scholar] [CrossRef]
  230. Polig, M.; Papacharalambous, D.G.; Bakirtzis, N.; Hermon, S. Assessing Visual Perception in Heritage Sites with Visual Acuity: Case study of the Cathedral of St. John the Theologian in Nicosia, Cyprus. Acm J. Comput. Cult. Herit. 2021, 14, 1–18. [Google Scholar] [CrossRef]
  231. Ogburn, D.E. Assessing the level of visibility of cultural objects in past landscapes. J. Archaeol. Sci. 2006, 33, 405–413. [Google Scholar] [CrossRef]
  232. Paliou, E. Visual Perception in Past Built Environments: Theoretical and Procedural Issues in the Archaeological Application of Three-Dimensional Visibility Analysis. In Digital Geoarchaeology; Siart, C., Forbriger, M., Bubenzer, O., Eds.; Natural Science in Archaeology; Springer International Publishing: Cham, Switzerland, 2018; pp. 65–80. [Google Scholar]
  233. Karelin, D.A.; Karelina, M.A. Methods of reconstructions’ presentation and the peculiarities of human perception → 3D reconstruction, angle of view, architecture, methodology, perspective, plane of projection, presentation, Rauschenbach, viewpoint, visualisation. In Der Modelle Tugend 2.0: Digitale 3D-Rekonstruktion als Virtueller Raum der Architekturhistorischen Forschung; Kuroczyński, P., Pfarr-Harfst, M., Münster, S., Eds.; arthistoricum.net: Heidelberg, Germany, 2019; pp. 186–201. [Google Scholar]
  234. Rauschenbach, B. Perspective Pictures and Visual Perception. Leonardo 1985, 18, 45–49. [Google Scholar] [CrossRef]
  235. Johnson, M.H. Phenomenological Approaches in Landscape Archaeology. Annu. Rev. Anthropol. 2012, 41, 269–284. [Google Scholar] [CrossRef]
  236. Mondini, D.; Ivanovici, V. (Eds.) Manipulating Light in Pre-Modern Times. Architectural, Artistic and Philosophical Aspects; Mendrisio Academy Press: Mendrisio, Switzerland, 2014. [Google Scholar]
  237. Happa, J.; Bashford-Rogers, T.; Wilkie, A.; Artusi, A.; Debattista, K.; Chalmers, A. Cultural heritage predictive rendering. Comput. Graph. Forum 2012, 31, 1823–1836. [Google Scholar] [CrossRef]
  238. Noback, A. Lichtsimulation in der digitalen Rekonstruktion historischer Architektur. Baugeschichte, Computervisualisierung, Lichtsimulation, Predictive Rendering. In Der Modelle Tugend 2.0: Digitale 3D-Rekonstruktion als Virtueller Raum der Architekturhistorischen Forschung; Kuroczyński, P., Pfarr-Harfst, M., Münster, S., Eds.; arthistoricum.net: Heidelberg, Germany, 2019; pp. 162–185. [Google Scholar]
  239. Noback, A.; Wittkopf, S. Complex Material Models in Radiance. In Proceedings of the 13th Radiance Workshop, London, UK, 1–3 September 2014. [Google Scholar]
  240. Papadopoulos, C.; Earl, G. Formal three-dimensional computational analyses of archaeological spaces. In Spatial Analysis and Social Spaces; Paliou, E., Lieberwirth, U., Polla, S., Eds.; De Gruyter: Berlin, Germany, 2014; pp. 135–166. [Google Scholar]
  241. Happa, J.; Mudge, M.; Debattista, K.; Artusi, A.; Goncalves, A.; Chalmers, A. Illuminating the past: State of the art. Virtual Real. 2010, 14, 155–182. [Google Scholar] [CrossRef]
  242. Happa, J.; Artusi, A. Studying Illumination and Cultural Heritage. In Visual Computing for Cultural Heritage; Liarokapis, F., Voulodimos, A., Doulamis, N., Doulamis, A., Eds.; Springer Series on Cultural Computing; Springer International Publishing: Cham, Switzerland, 2020; pp. 23–42. [Google Scholar]
  243. Apollonio, F.I.; Fallavollita, F.; Foschi, R. The Critical Digital Model for the Study of Unbuilt Architecture. In Research and Education in Urban History in the Age of Digital Libraries; UHDL, 2019; Niebling, F., Münster, S., Messemer, H., Eds.; Springer International Publishing: Cham, Switzerland, 2021; pp. 3–24. [Google Scholar]
  244. Healey, C.G. Choosing effective colours for data visualization. In Proceedings of the Seventh Annual IEEE Visualization, San Francisco, CA, USA, 27 October–1 November 1996; pp. 263–270. [Google Scholar]
  245. Boochs, F. COSCH—Colour and Space in Cultural Heritage, A New COST Action Starts. In Proceedings of the EuroMed, Lemesos, Cyprus, 29 October–3 November 2012. [Google Scholar]
  246. Martos, A.; Cachero, R. Acquisition and Reproduction of Surface Appearance in Architectural Orthoimages. Int. Arch. Photogramm. Remote Sens. Spat. Inf. Sci. 2015, 40, 139–146. [Google Scholar] [CrossRef]
  247. Dhanda, A.; Reina Ortiz, M.; Weigert, A.; Paladini, A.; Min, A.; Gyi, M.; Su, S.; Fai, S.; Santana Quintero, M. Recreating Cultural Heritage Environments for Vr Using Photogrammetry. Int. Arch. Photogramm. Remote Sens. Spat. Inf. Sci. 2019, 42, 305–310. [Google Scholar] [CrossRef]
  248. Rey, G.D. Lernen mit Multimedia. Die Gestaltung Interaktiver Animationen; Universitätsbibliothek Trier: Trier, Germany, 2008. [Google Scholar]
  249. Paliou, E.; Wheatley, D.; Earl, G. Three-dimensional visibility analysis of architectural spaces: Iconography and visibility of the wall paintings of Xeste 3 (Late Bronze Age Akrotiri). J. Archaeol. Sci. 2011, 38, 375–386. [Google Scholar] [CrossRef]
  250. Fanini, B.; Cinque, L. Encoding immersive sessions for online, interactive VR analytics. Virtual Real. 2020, 24, 423–438. [Google Scholar] [CrossRef]
  251. Pintó, R.; Ametller, J. Students’ difficulties in reading images. Comparing results from four national research groups. Int. J. Sci. Educ. 2002, 24, 333–341. [Google Scholar] [CrossRef]
  252. Limp, W.F. Towards a strategy for evaluating heritage visualizations. In Proceedings of the 37th Computer Applications and Quantitative Methods in Archaeology Conference, Williamsburg, VA, USA, 22–26 March 2009. [Google Scholar]
  253. Wagemans, J. Historical and Conceptual Background: Gestalt Theory; Leuven. 2008. Available online: https://gestaltrevision.be/storage/files/1/oxford_handbook/Wagemans-Historical_and_conceptual_background_Gestalt_theory.pdf (accessed on 30 March 2023).
  254. Goldstein, E.B. Blackwell Handbook of Sensation and Perception; Wiley-Blackwell: Hoboken, NJ, USA, 2005. [Google Scholar]
  255. Gibson, J.J. The Perception of the Visual World; Houghton Mifflin: Oxford, UK, 1950. [Google Scholar]
  256. Ortega-Alcázar, I. Visual Research Methods. In International Encyclopedia of Housing and Home; Elsevier: San Diego, CA, USA, 2012; pp. 249–254. [Google Scholar]
  257. Grissom, S.; McNally, M.F.; Naps, T. Algorithm visualization in CS education: Comparing levels of student engagement. In Proceedings of the ACM Symposium on Software Visualization, San Diego, CA, USA, 11–13 June 2003. [Google Scholar]
  258. Nutt, P.C.; Wilson, D. Handbook of Decision Making; Wiley-Blackwell: Oxford, UK, 2010. [Google Scholar]
  259. Arnheim, R. Visual Thinking; Rütten & Loening: München, Germany, 1969. [Google Scholar]
  260. Margolis, E. The SAGE Handbook of Visual Research Methods; Sage: New York, NY, USA, 2011. [Google Scholar] [CrossRef]
  261. Stanczak, G. Visual Research Methods; Sage: New York, NY, USA, 2007. [Google Scholar] [CrossRef]
  262. Brill, J.M.; Kim, D.; Branch, R.M. Visual Literacy Defined—The Results of a Deiphi Study: Can IVLA (Operationally) Define Visual Literacy? J. Vis. Lit. 2007, 27, 47–60. [Google Scholar] [CrossRef]
  263. Avgerinou, M. Towards A visual literacy index. In Exploring the Visual Future: Art Design, Science & Technology; Griffin, R.E., Williams, V.S., Jung, L., Eds.; IVLA: Loretto, PA, USA, 2001; pp. 17–26. [Google Scholar]
  264. James, S. ‘Visual competence’ in archaeology: A problem hiding in plain sight. Antiquity 2015, 89, 1189–1202. [Google Scholar] [CrossRef]
  265. Mirzoeff, N. The Right to Look. Crit. Inq. 2011, 37, 473–496. [Google Scholar] [CrossRef]
  266. Pauwels, L. An integrated model for conceptualising visual competence in scientific research and communication. Vis. Stud. 2008, 23, 147–161. [Google Scholar] [CrossRef]
  267. Hug, T. Media competence and visual literacy—Towards considerations beyond literacies. Period. Polytech. Soc. Manag. Sci. 2012, 20, 115–125. [Google Scholar] [CrossRef]
  268. Hattwig, D.; Bussert, K.; Medaille, A.; Burgess, J. Visual Literacy Standards in Higher Education: New Opportunities for Libraries and Student Learning. Portal-Libr. Acad. 2013, 13, 61–89. [Google Scholar] [CrossRef]
  269. Peters, G. Aesthetic Primitives of Images for Visualization. In Proceedings of the 11th International Conference on Information Visualisation, Zurich, Switzerland, 2–6 July 2007; pp. 316–325. [Google Scholar]
  270. Nasar, J.L. Urban Design Aesthetics. The evaluative qualitites of building exteriors. Environ. Behav. 1994, 26, 377–401. [Google Scholar] [CrossRef]
  271. Groat, L.; Despres, C. The significance of architectural theory for environment design research. In Advances in Environment, Behavior and Design; Zube, E.H., Moore, G.T., Eds.; Plenum: New York, NY, USA, 1990; pp. 3–53. [Google Scholar]
  272. Styhre, A. Disciplining professional vision in architectural work. Learn. Organ. 2010, 17, 437–454. [Google Scholar] [CrossRef]
  273. Goodwin, C. Professional Vision. Am. Anthropol. 1994, 96, 606–633. [Google Scholar] [CrossRef]
  274. Simon, H.A. Invariants of human behavior. Annu. Rev. Psychol. 1990, 41, 1–19. [Google Scholar] [CrossRef]
  275. Tversky, B. Spatial Schemas in Depictions. In Spatial Schemas and Abstract Thought; Gattis, M., Ed.; MIT Press: Cambridge, UK, 2002; pp. 79–112. [Google Scholar]
  276. Muenster, D.; Muenster, S.; Dietz, R. Digital Humanities for pupils. First steps towards a research lab for children. Int. Arch. Photogramm. Remote Sens. Spat. Inf. Sci. 2023, 48, 1105–1111. [Google Scholar] [CrossRef]
  277. Smolarski, R.; Messemer, H.; Münster, S. 3D-Rekonstruktion von historischer Industriearchitektur in Jena um 1900—Ergebnisse eines Studierendenwettbewerbs. In Visual History und Geschichtsdidaktik. (Interdisziplinäre) Impulse und Anregungen für Praxis und Wissenschaft; Britsche, F., Greven, L., Eds.; Wochenschau Verlag: Frankfurt, Germany, 2023. [Google Scholar]
  278. Münster, D.L.; Münster, S. Designing Learning Tasks and Scenarios on Digital History for a Research Lab for Pupils; Münster, S., Pattee, A., Kröber, C., Niebling, F., Eds.; Research and Education in Urban History in the Age of Digital Libraries; Springer: Cham, Switzerland, 2023; pp. 220–232. [Google Scholar]
  279. Hessel, J.; Lee, L.; Mimno, D. Unsupervised Discovery of Multimodal Links in Multi-image, Multi-sentence Documents. In Proceedings of the 2019 Conference on Empirical Methods in Natural Language Processing and the 9th International Joint Conference on Natural Language Processing (EMNLP-IJCNLP), Hong Kong, China, 3–7 November 2019. [Google Scholar]
  280. Bender, B. The Impact of Integration on Application Success and Customer Satisfaction in Mobile Device Platforms. Bus. Inf. Syst. Eng. 2020, 62, 515–533. [Google Scholar] [CrossRef]
  281. Reips, U.-D. Internet-Based Psychological Experimenting:Five Dos and Five Don’ts. Soc. Sci. Comput. Rev. 2002, 20, 241–249. [Google Scholar] [CrossRef]
  282. Bearman, D.; Geber, K. Transforming cultural heritage institutions through new media. Mus. Manag. Curatorship 2008, 23, 385–399. [Google Scholar] [CrossRef]
  283. ORCID. 2023. Available online: https://orcid.org/ (accessed on 30 March 2023).
  284. Bond, A.; Bond, F. GeoNames Wordnet (gnwn): Extracting wordnets from GeoNames. In Proceedings of the 10th Global Wordnet Conference, Wroclaw Poland: Global Wordnet Association, Wroclaw, Poland, 23–27 July 2019; Vossen, P., Fellbum, C., Eds.; Global Wordnet Association: Amsterdam, The Netherlands, 2019; pp. 387–393. [Google Scholar]
  285. Creative Commons. Creative Commons About CC Licenses. Available online: https://creativecommons.org/about/cclicenses/ (accessed on 30 March 2023).
  286. Münster, S.; Christen, J.; Pfarr-Harfst, M. Modellathon “Digitale 3D-Rekonstruktion” (Workshop). In Proceedings of the 5. Jahrestagung der Digital Humanities im Deutschsprachigen Raum (DHd 2018), Cologne, Germany, 26 February—2 March 2018. [Google Scholar]
  287. European Commission. The Digital Competence Framework 2.0. Available online: https://ec.europa.eu/jrc/en/digcomp/digital-competence-framework (accessed on 10 February 2024).
  288. Jiao, C.; Heitzler, M.; Hurni, L. A fast and effective deep learning approach for road extraction from historical maps by automatically generating training data with symbol reconstruction. Int. J. Appl. Earth Obs. Geoinf. 2022, 113, 102980. [Google Scholar] [CrossRef]
  289. Kirillov, A.; Mintun, E.; Ravi, N.; Mao, H.; Rolland, C.; Gustafson, L.; Xiao, T.; Whitehead, S.; Berg, A.C.; Lo, W.-Y.; et al. Segment Anything. arXiv 2023, arXiv:2304.02643. [Google Scholar]
  290. Maiwald, F.; Bruschke, J.; Schneider, D.; Wacker, M.; Niebling, F. Giving Historical Photographs a New Perspective: Introducing Camera Orientation Parameters as New Metadata in a Large-Scale 4D Application. Remote Sens. 2023, 15, 1879. [Google Scholar] [CrossRef]
  291. Schönberger, J.L.; Frahm, J. Structure-from-Motion Revisited. In Proceedings of the IEEE Conference on Computer Vision and Pattern Recognition (CVPR), Las Vegas, NV, USA, 27–30 June 2016; pp. 4104–4113. [Google Scholar] [CrossRef]
  292. DeTone, D.; Malisiewicz, T.; Rabinovich, A. SuperPoint: Self-Supervised Interest Point Detection and Description. In Proceedings of the 2018 IEEE/CVF Conference on Computer Vision and Pattern Recognition Workshops (CVPRW), Salt Lake City, UT, USA, 18–22 June 2018; pp. 337–349. [Google Scholar]
  293. Sarlin, P.-E.; DeTone, D.; Malisiewicz, T.; Rabinovich, A. SuperGlue: Learning Feature Matching with Graph Neural Networks. In Proceedings of the IEEE/CVF Conference on Computer Vision and Pattern Recognition, Seattle, WA, USA, 13–19 June 2020; pp. 4938–4947. [Google Scholar]
  294. Tyszkiewicz, M.; Fua, P.; Trulls, E. DISK: Learning local features with policy gradient. Adv. Neural Inf. Process. Syst. 2020, 33, 14254–14265. [Google Scholar]
  295. Lindenberger, P.; Sarlin, P.-E.; Pollefeys, M. LightGlue: Local Feature Matching at Light Speed. arXiv 2023, arXiv:2306.13643. [Google Scholar]
  296. Lindenberger, P.; Sarlin, P.-E.; Larsson, V.; Pollefeys, M. Pixel-Perfect Structure-from-Motion with Featuremetric Refinement. In Proceedings of the IEEE/CVF International Conference on Computer Vision, Montreal, QC, Canada, 11–17 October 2021. [Google Scholar] [CrossRef]
  297. Aichholzer, O.; Aurenhammer, F. Straight skeletons for general polygonal figures in the plane. In Proceedings of the Computing and Combinatorics: Second Annual International Conference, COCOON’96, Hong Kong, China, 17–19 June 1996; pp. 117–126. [Google Scholar]
  298. Sugihara, K. Straight Skeleton for Automatic Generation of 3-D Building Models with General Shaped Roofs; Václav Skala-UNION Agency: Plzen, Czech Republic, 2013. [Google Scholar]
  299. Sugihara, K.; Khmelevsky, Y. Roof report from automatically generated 3D building models by straight skeleton computation. In Proceedings of the 2018 Annual IEEE International Systems Conference (SysCon), Vancouver, BC, Canada, 24–26 April 2018; pp. 1–8. [Google Scholar]
  300. OSM. 2023. Available online: https://wiki.openstreetmap.org/wiki/Key:roof:shape (accessed on 10 February 2024).
  301. Yu, Z.; Chen, A.; Antic, B.; Peng, S.; Bhattacharyya, A.; Niemeyer, M.; Tang, S.; Sattler, T.; Geiger, A. SDFStudio: A Unified Framework for Surface Reconstruction. 2022. Available online: https://github.com/autonomousvision/sdfstudio (accessed on 10 February 2024).
  302. Li, Z.; Müller, T.; Evans, A.; Taylor, R.H.; Unberath, M.; Liu, M.-Y.; Lin, C.-H. Neuralangelo: High-Fidelity Neural Surface Reconstruction. In Proceedings of the IEEE/CVF Conference on Computer Vision and Pattern Recognition, Vancouver, BC, Canada, 17–24 June 2023. [Google Scholar]
  303. Yariv, L.; Hedman, P.; Reiser, C.; Verbin, D.; Srinivasan, P.P.; Szeliski, R.; Barron, J.T.; Mildenhall, B. BakedSDF: Meshing Neural SDFs for Real-Time View Synthesis. arXiv 2023, arXiv:2302.14859. [Google Scholar]
  304. Régimbeau, G. Image source criticism in the age of the digital humanities. In Heritage and Digital Humanities: How Should Training Practices Evolve? Lit: Paris, France, 2014; pp. 179–194. [Google Scholar]
  305. Utescher, R.; Pattee, A.; Maiwald, F.; Bruschke, J.; Hoppe, S.; Münster, S.; Zarrieß, S. Exploring Naming Inventories for Architectural Elements for Use in Multi-modal Machine Learning Applications. In Proceedings of the Workshop on Computational Methods in the Humanities (COMHUM 2022), Lausanne, Switzerland, 9–10 June 2022. [Google Scholar]
  306. Baca, M.; Gill, M. Encoding multilingual knowledge systems in the digital age: The getty vocabularies. In Proceedings of the North American Symposium on Knowledge Organization, Los Angeles, CA, USA, 18–19 June 2015; pp. 41–63. [Google Scholar]
  307. Schmidt, S.C.; Thiery, F.; Trognitz, M. Practices of linked open data in archaeology and their realisation in Wikidata. Digital 2022, 2, 333–364. [Google Scholar] [CrossRef]
  308. Bruschke, J.; Kröber, C.; Utescher, R.; Niebling, F. Towards Querying Multimodal Annotations Using Graphs. In Research and Education in Urban History in the Age of Digital Libraries; UHDL, 2023; Münster, S., Pattee, A., Kröber, C., Niebling, F., Eds.; Springer: Cham, Switzerland, 2023; pp. 65–87. [Google Scholar]
  309. Münster, S.; Maiwald, F.; Bruschke, J.; Kröber, C.; Dietz, R.; Messemer, H.; Niebling, F. Where are we now on the Road to 4D Urban History Research and Discovery? ISPRS Ann. Photogramm. Remote Sens. Spat. Inf. Sci. 2021, 8, 109–116. [Google Scholar] [CrossRef]
  310. Prieto, I.; Izkara, J.L. Visualization of 3D City models on mobile devices. In Proceedings of the 17th International Conference on 3D Web Technology (Web3D ‘12), Los Angeles, CA, USA, 4–5 August 2012; pp. 101–104. [Google Scholar]
  311. GlTF—Runtime 3D Asset Delivery. Available online: https://www.khronos.org/gltf (accessed on 19 July 2021).
  312. Brettle, J.; Galligan, F. Introducing Draco: Compression for 3D graphics. Google Open Source Blog 2017, 19, 2021. [Google Scholar]
  313. Fan, H.; Zipf, A.; Fu, Q.; Neis, P. Quality assessment for building footprints data on OpenStreetMap. Int. J. Geogr. Inf. Sci. 2014, 28, 700–719. [Google Scholar] [CrossRef]
  314. Vrandečić, D.; Krötzsch, M. Wikidata: A free collaborative knowledgebase. Commun. ACM 2014, 57, 78–85. [Google Scholar] [CrossRef]
  315. Gualtieri, M. Best Practices in User Experience (UX) Design; Forrester Research: Cambridge, MA, USA, 2009. [Google Scholar]
  316. Stokes, R. E-Marketing: The Essential Guide to Marketing in a Digital World; Quirk Education Pty (Ltd.): Cape Town, South Africa, 2008. [Google Scholar]
  317. Partala, T.; Saari, T. Understanding the most influential user experiences in successful and unsuccessful technology adoptions. Comput. Hum. Behav. 2015, 53, 381–395. [Google Scholar] [CrossRef]
  318. Bruschke, J.; Maiwald, F.; Münster, S.; Niebling, F. Browsing and Experiencing Repositories of Spatially Oriented Historic Photographic Images. Stud. Digit. Herit. 2018, 2, 138–149. [Google Scholar] [CrossRef]
  319. Schindler, G.; Dellaert, F. 4D cities: Analyzing, visualizing, and interacting with historical urban photo collections. J. Multimed. 2012, 7, 124–131. [Google Scholar] [CrossRef]
  320. Dewitz, L.; Kröber, C.; Messemer, H.; Maiwald, F.; Münster, S.; Breitenstein, M.; Bruschke, J.; Niebling, F. Historic Photos and Visualizations—Potentials For Research. Int. Arch. Photogramm. Remote Sens. Spat. Inf. Sci. 2019, 42, 405–412. [Google Scholar] [CrossRef]
  321. Bruschke, J.; Wacker, M.; Niebling, F. Comparing Methods to Visualize Orientation of Photographs: A User Study. In Research and Education in Urban History in the Age of Digital Libraries; Niebling, F., Münster, S., Messemer, H., Eds.; Springer International Publishing: Cham, Switzerland, 2021; pp. 129–151. [Google Scholar]
  322. Fitzmaurice, G.; Matejka, J.; Mordatch, I.; Khan, A.; Kurtenbach, G. Safe 3D Navigation. In Proceedings of the 2008 Symposium on Interactive 3D Graphics and Games, Redwood City, CA, USA, 15–17 February 2008; pp. 7–15. [Google Scholar]
  323. Kröber, C.; Hammel, K.; Schade, C.; Filz, N.; Dewitz, L. User Involvement for Application Development: Methods, Opportunities and Experiences from Three Different Academic Projects. In Research and Education in Urban History in the Age of Digital Libraries; Springer: Cham, Switzerland, 2021; pp. 46–83. [Google Scholar]
  324. Time Machine. A Proof-of-Concept of the Time Machine Community. Available online: https://www.timemachine.eu/proof-of-concept-the-time-machine-community/ (accessed on 10 February 2024).
  325. Google. Photorealistic 3D Tiles Overview. Available online: https://developers.google.com/maps/documentation/tile/3d-tiles-overview?hl=en (accessed on 10 February 2024).
  326. Lombardi, M. Sustainability of 3D Heritage Data: Life Cycle and Impact. Archeol. E Calc. 2023, 34, 339–356. [Google Scholar] [CrossRef]
  327. European Commission. Commission Recommendation on a Common European Data Space for Cultural Heritage; European Commission: Brussels, Belgium, 2021. [Google Scholar]
  328. Münster, S.; Prechtel, N. Beyond Software. Design Implications for Virtual Libraries and Platforms for Cultural Heritage from Practical Findings. In Digital Heritage. Progress in Cultural Heritage: Documentation, Preservation, and Protection; Ioannides, M., Magnenat-Thalmann, N., Fink, E., Žarnić, R., Yen, A.-Y., Quak, E., Eds.; Springer: Cham, Switzerland, 2014; Volume LNCS 8740, pp. 131–145. [Google Scholar]
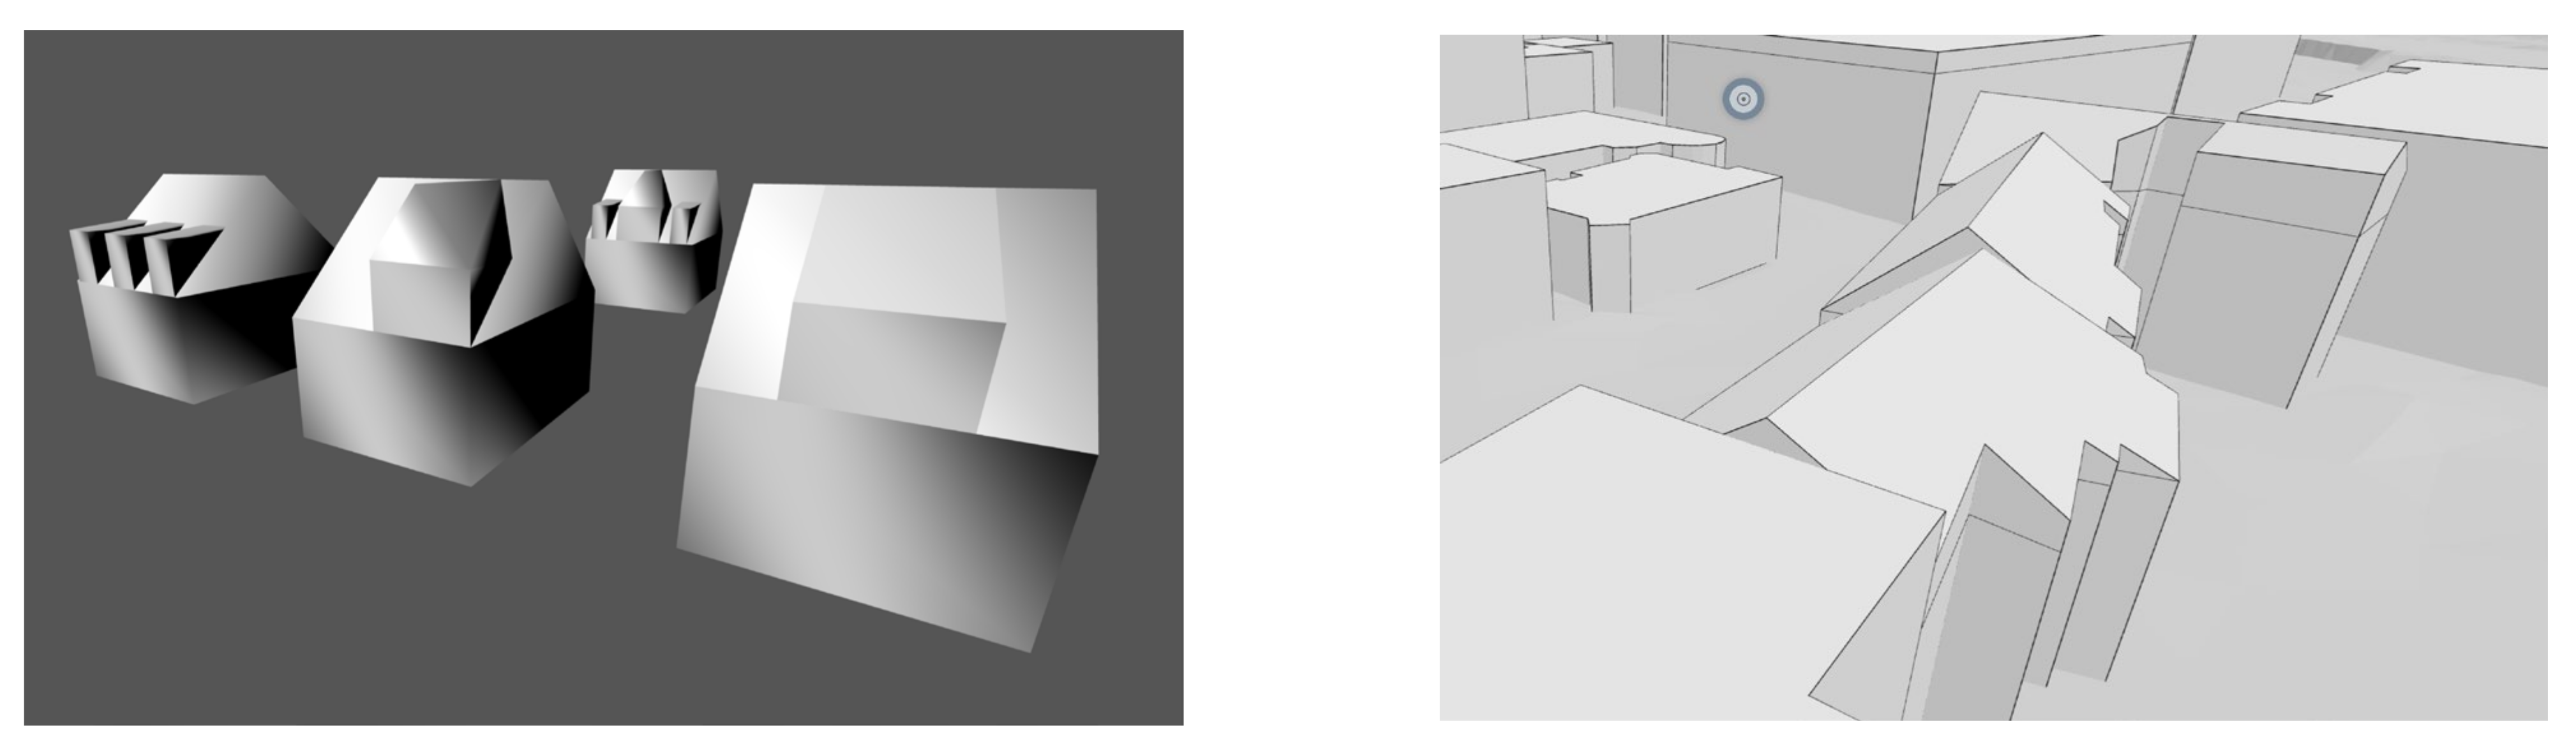
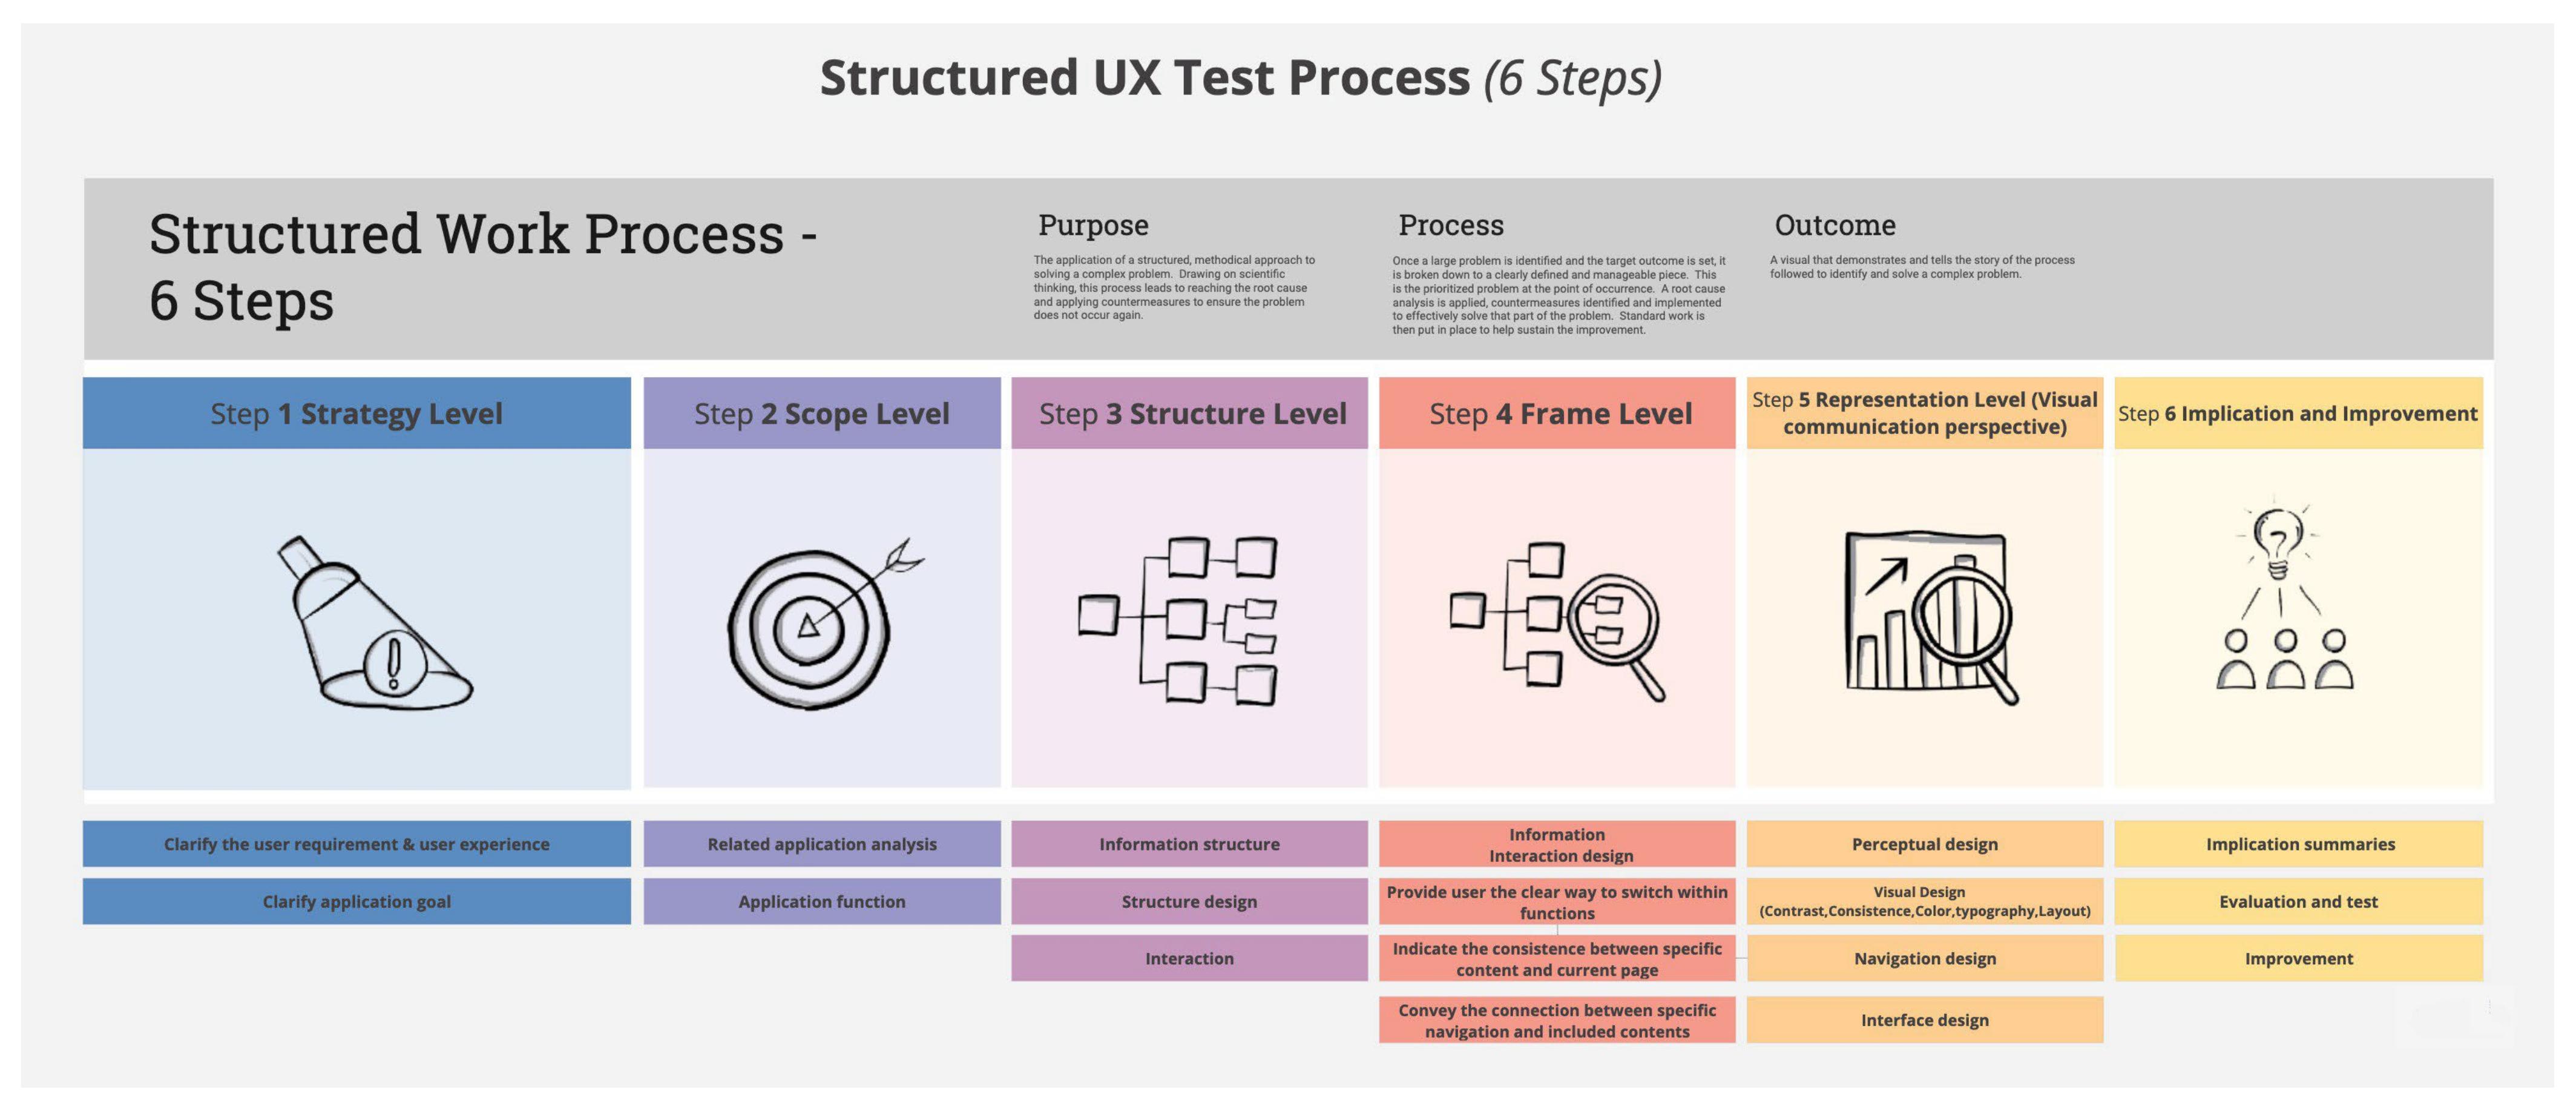
Figure 1. (Left): Screenshot of the website for the contest entitled “Jena at its most beautiful ever” (https://das-schoenste-jena.de/ (accessed on 17 February 2024)); (Right): Screenshot of the re-photo application (https://4dcity.org (accessed on 17 February 2024)).
Applsci 14 01992 g001
Figure 2. 3DHeritage Workflow Scheme.
Applsci 14 01992 g002
Figure 3. VGG-16-based training and validation accuracy and loss for classification of architectural exteriors/others.
Applsci 14 01992 g003
Figure 4. (Left): Three-dimensional reconstruction of the Michaelisplatz in Vienna, including the former Burgtheater (Marleen DeKramer, Anna Schuller, Magdalena März); (Right): 3D reconstruction of the Carl Zeiss AG Jena building prior to 1914 (Christine Käfer and Lilia Gaivan).
Applsci 14 01992 g004
Figure 5. Properties of the colored historical map of Jena in 1936 including red building footprints, black text, a blue river, and green spaces.
Applsci 14 01992 g005
Figure 6. The left image shows example patches of the 1936 map. The middle image shows building footprint extraction using manual labelling and ArcGIS Pro. The right image shows the result retrieved by Segment Anything.
Applsci 14 01992 g006
Figure 7. Automatically oriented images obtained from Google Street View. The image is shown with a semi-transparent overlay over the environment and OpenStreetMap 3D models behind it. From (left) to (right): three scenes in Italy in Pisa, Bologna, and Massa.
Applsci 14 01992 g007
Figure 8. Two SfM reconstructions calculated using SuperPoint + SuperGlue with bundle adjustment in COLMAP. Each red pyramid represents one photograph and its orientation and camera parameters. (Left): Reconstruction using 257 contemporary images of Charlottenburg, Berlin, from Wikimedia Commons. (Right): Reconstruction of the former regional court in Dresden from 41 historical images retrieved from a private archive.
Applsci 14 01992 g008
Figure 9. Types of roofs (image [300]).
Applsci 14 01992 g009
Figure 10. Sequencing a roof (left); segmenting complex roof structures into smaller segments (right).
Applsci 14 01992 g010
Figure 12. A reconstruction of the National Maritime Museum in Amsterdam using an oriented image, texture projection, and an LoD2 building model.
Applsci 14 01992 g012
Figure 13. Two photographs of the Semperoper, Dresden, from 1953 (top left) and 1954 (top right). The change in appearance of the roof is translated into inaccuracies and artifacts in the final dense cloud (bottom) calculated in Agisoft Metashape.
Applsci 14 01992 g013
Figure 14. Neural rendering of the Semperoper using exclusively historical photographs and NeuS Facto.
Applsci 14 01992 g014
Figure 15. An SfM reconstruction of the center of Budapest exclusively using historical photographs. Each red pyramid represents one photograph and its orientation and camera parameters.
Applsci 14 01992 g015
Figure 16. Example of an annotated Wikipedia article within the 4D browser application.
Applsci 14 01992 g016
Figure 17. Segmented and annotated image of the Kronentor (Crown Gate) of the Dresden Zwinger.
Applsci 14 01992 g017
Figure 18. Example of a word cloud consisting of architectural terms of a scholarly text (left) and the corresponding 4D view (right) within the 4D browser application (websited in this figure accessed on 3 December 2023).
Applsci 14 01992 g018
Figure 19. Technology stack and communication layout: the backend application queries and serves custom data to the frontend applications, but also requests and caches data from external APIs.
Applsci 14 01992 g019
Figure 20. Computing weights for (a) a historical photograph and (b) a 3D city model by rendering (c) color-coded buildings and (d) a depth map.
Applsci 14 01992 g020
Figure 21. Information architecture of the UX test process.
Applsci 14 01992 g021
Figure 22. Information architecture of the 4D City application.
Applsci 14 01992 g022
Figure 23. Flowchart analysis of the 4D City application.
Applsci 14 01992 g023
Figure 24. User journey map of the 4D City application.
Applsci 14 01992 g024
Figure 25. Different visualizations of distributions of images. Red indicates higher concentrations of positions, coverage, or angles.
Applsci 14 01992 g025
Figure 26. Screenshot of the Dresden Zwinger in the 4D Browser (left) and Neumarkt in 4D City (right).
Applsci 14 01992 g026
Figure 27. Screenshot of the Jena marketplace in the 4D Browser (left) and 4D City (right).
Applsci 14 01992 g027
Figure 28. Screenshot of the National Maritime Museum in Amsterdam in the 4D Browser (left) and 4D City (right).
Applsci 14 01992 g028
Figure 29. Screenshots of the 4D Browser and 4D City baseline coverage without any curated material.
Applsci 14 01992 g029
Table 1. Data collection and retrieval approaches used by the Jena4D group.
Crowdsourced Image CollectionCrowdsourced 3D
Digitization
Data Retrieval PipelineHackathonsSchool Projects
Applsci 14 01992 i001Applsci 14 01992 i002Applsci 14 01992 i003Applsci 14 01992 i004Applsci 14 01992 i005
(b) Participatory virtual history knowledge bases, co-designed by citizens [80,276](c) 3D heritage as combined low-end guided workflow to capture photographs of endangered heritage via smartphone and server-based 3D modelling [81](a) Location-based data retrieval from open image and 3D repositories and information resources [81](d) “Modelathon” as an international student 3D reconstruction competition in 2018 and 2020 [277](e) A student presents her digital project to pupils [276,278]
Table 2. Workflow for footprint extraction, photo orientation, and parametric generation of textured 3D building models.
Footprint Extraction from Historical MapsSpatialization of Images3D Parametric Models3D ModellingData Enrichment
Applsci 14 01992 i006Applsci 14 01992 i007Applsci 14 01992 i008Applsci 14 01992 i009Applsci 14 01992 i010
(a) Georeference historical plans and extract building footprints(b) Detect similar views via overlapping segments in photographs. Calculate the relative position via a feature-based orientation/positioning pipeline(c) Create low LoD models by extrapolating footprint to building walls, generating roof shapes, and projecting photo texture to the façade(d) Create higher LoD 3D geometries from imagery for better documentation (e) Enriching data and connecting to other sources require an overarching ontology and the detection of and map links to text, image, and 3D data
Table 3. Frontend applications.
4D City Application4D Browser Application
Applsci 14 01992 i011Applsci 14 01992 i012
Browser-based mobile application showing textured 3D models of historical buildings and points of interest.Graphical user interface of the 4D browser application.
Table 4. Sources and number of retrieved datasets (10/2023).
TypeSourceGridNumber Retrieved
Points of interestTriposo1000 m radius1684
Google Place Search3 × 3 queries within grid
5 top results
1092
Wikipedia Not cached
ImagesFlickr1000 m radius8526
EuropeanaWithin grid3227
MapillaryWithin grid3961
Wikimedia Commons10,000 m radius448
Google Street View3 × 3 queries
3 images (120° FoV) per position
2310
3D ModelsSketchfabKeyword search using a location name retrieved via Geonames2.736
EuropeanaKeyword search using a location name retrieved via Geonames906
Mainz 3DFull dataset64
Urban History 4DFull dataset214
After retrieval, a series of scripts perform the renaming of files to gain unique filenames and store the metadata in an SQL database.
Table 5. Example of courses created (images: Sophie-Luisa Hopf, Marlene Kropp).
Tell Us What It Was Like: Oral History ProjectObjects Tell Stories, We ListenCulture of Remembrance Rethought: Digitization of Stolpersteine
Applsci 14 01992 i013Applsci 14 01992 i014Applsci 14 01992 i015
Topic: Young people critically examine the oral history method, research topics in modern history, conduct contemporary witness interviews, and prepare them using digital tools.

Objectives: Understand the construct nature of historical narratives and be able to research independently using digital resources and critically reflect on the information obtained.

Realization: Project week in a youth center, 5 days, participants aged 13–18

Results: Contemporary witness interviews; POIs in the 4D City application; self-evaluation; results of qualitative surveys of teachers and learners

Link: https://www.db-thueringen.de/receive/dbt_mods_00059138 (accessed on 10 February 2024)
Topic: Children select historical everyday objects such as old kitchen utensils or tools; examine their function and history; and describe, draw, and digitize them using photography and 3D scans.

Objectives: Acquire a basic understanding of source-oriented historical learning and get to know and reflect on the first methods of digitization.

Realization: Afternoon work group in a primary school, six sessions, participants aged 7–10

Results: Drawings, photos, 3D scans; POIs in the 4D City application; results of qualitative surveys of teachers and learners; self-evaluation

Link: https://www.db-thueringen.de/receive/dbt_mods_00059136?q=Gegenst%C3%A4nde%20erz%C3%A4hlen (accessed on 10 February 2024)
Topic: Pupils research the life stories of Holocaust victims commemorated by Stolpersteine (“stumbling stones”), create short biographies, and present them on the web.

Objectives: Learn about regional remembrance culture in a creative way and acquire skills in digital source research and text presentation on the web.

Realization: Afternoon working group in the DH Lab, six sessions, participants aged 11

Results: Texts, images; POIs in the 4D City application; results of qualitative surveys of teachers and learners self-evaluations

Link: https://www.db-thueringen.de/receive/dbt_mods_00059137?q=Stolpersteine (accessed on 10 February 2024)
Disclaimer/Publisher’s Note: The statements, opinions and data contained in all publications are solely those of the individual author(s) and contributor(s) and not of MDPI and/or the editor(s). MDPI and/or the editor(s) disclaim responsibility for any injury to people or property resulting from any ideas, methods, instructions or products referred to in the content.

