Location via proxy:   [ UP ]  
[Report a bug]   [Manage cookies]                
Article

The Impact of Multiple Thermal Cycles Using CMT® on Microstructure Evolution in WAAM of Thin Walls Made of AlMg5

by
Vinicius Lemes Jorge
1,
Felipe Ribeiro Teixeira
1,
Sten Wessman
2,3,
Americo Scotti
1,3,* and
Sergio Luiz Henke
4
1
Center for Research and Development of Welding Processes, Federal University of Uberlandia, Uberlândia 38400-901, MG, Brazil
2
Swerim AB, Box 7047, SE-164 07 Kista, Sweden
3
Department of Engineering Science, University West, SE-461 86 Trollhättan, Sweden
4
Mechanical Department, Federal University of Parana, Curitiba 81531-980, PR, Brazil
*
Author to whom correspondence should be addressed.
Metals 2024, 14(6), 717; https://doi.org/10.3390/met14060717
Submission received: 29 May 2024 / Revised: 10 June 2024 / Accepted: 13 June 2024 / Published: 17 June 2024

Abstract

:
Wire Arc Additive Manufacturing (WAAM) of thin walls is an adequate technology for producing functional components made with aluminium alloys. The AlMg5 family is one of the most applicable alloys for WAAM. However, WAAM differs from traditional fabrication routes by imposing multiple thermal cycles on the material, leading the alloy to undergo cyclic thermal treatments. Depending on the heat source used, thermal fluctuation can also impact the microstructure of the builds and, consequently, the mechanical properties. No known publications discuss the effects of these two WAAM characteristics on the built microstructure. To study the influence of multiple thermal cycles and heat source-related thermal fluctuations, a thin wall was built using CMT-WAAM on a laboratory scale. Cross-sections of the wall were metallographically analysed, at the centre of a layer that was re-treated, and a region at the transition between two layers. The focus was the solidification modes and solubilisation and precipitations of secondary phases. Samples from the wall were post-heat treated in-furnace with different soaking temperatures and cooling, to support the results. Using numerical simulations, the progressive thermal cycles acting on the HAZ of one layer were simplified by a temperature sequence with a range of peak temperatures. The results showed that different zones are formed along the layers, either as a result of the imposed thermal cycling or the solidification mode resulting from CMT-WAAM deposition. In the zones, a band composed of coarse dendrites and an interdendritic phase and another band formed by alternating sizes of cells coexisted with the fusion and heat-affected zones. The numerical simulation revealed that the thermal cycling did not significantly promote the precipitation of second-phase particles.

1. Introduction

One of the aluminium alloys of highest interest for WAAM (Wire Arc Additive Manufacturing) is the alloy containing approximately 5 wt% Mg and minor contents of sensitive elements, such as Fe, Cu, and Mn. According to Ryen et al. [1], non-heat-treatable aluminium alloys, such as AA5xxx systems, constitute a class of alloys that owe their strength mainly to solid solution elements and small grain sizes. In some cases, the AlMg alloy strength is also relayed in dispersion strengthening. One way or the other, this alloy is characterised by holding relatively high tensile strength, ductility, and corrosion resistance, especially in seawater. Due to these characteristics, this alloy is widely used in shipbuilding, but also in automotive and railway industries.
Zielińska-Lipiec et al. [2], Ren et al. [3], and Su et al. [4] complement the above description by citing that those alloys are formed by an α-phase matrix (solid solution of Mg in Al) and a second β-phase (Al3Mg2). Ryen et al. [1] still mention that introducing foreign atoms into a crystal lattice invariably increases the strength of the material. Therefore, solution hardening results from an interaction between the mobile dislocations and the solute atoms. However, the most relevant mechanisms for substitutional alloying of aluminium are the elastic interactions due to the following: (a) the solute size misfit, where the solute atom differs from the matrix atoms in size which creates a strain field around the atom and (b) the modulus misfit, where the difference in binding force between the solute atoms and the matrix atoms results in a hard or soft “spot” in the matrix. The presence of solute atoms increases the initial yield stress and reduces the dynamic recovery rate of dislocations.
From the standard phase equilibrium diagram in Figure 1, an alloy with 5 wt% Mg is expected to have a second phase (Al3Mg2) at room temperature, since the Mg solubility is low at low temperatures. A faster cooling rate of the material would change the phase equilibrium, and a higher amount of solid solution of Mg may occur (as an α-phase matrix, in the case of non-Al3Mg2 precipitation).
Thus, one can expect that the WAAM deposition with the AWS ER5356 wire could produce walls with an α-phase matrix and a β-phase (Al3Mg2) at room temperature, in which the ratio of α-phase matrix and β-phase depends on the precipitation kinetic, unpredictable via equilibrium diagrams. It is worth mentioning that, according to Prakash [5], the formation of the second β-phase (Al3Mg2) produces only a slight hardening in Al–Mg alloys, so the heat treatment of these alloys produces no beneficial technological properties with structural hardening based on precipitation or ageing. The β-phase (Al3Mg2) formation may be the reason why Davis [6] states that Al–Mg (5xxx) series, ranging from 0.5 to 6 wt% of Mg, corresponds to the main aluminium alloys that are strengthened by alloying elements in solid solution (often coupled with cold work).
Through a characterisation involving scanning electron microscopy (SEM) and X-ray diffraction (XRD) analyses, Su et al. [4] found in WAAM with Al–Mg alloys that fine dark particles formed along the grain boundaries and in their interior correspond to the β-phase. As seen in Figure 2, according to the authors, the particles with black colour (A and C) are β-phase (Al3Mg2), and the grey colour background is formed by α-phase (B). However, it is important to state that the solidification microstructure may play an important role in the alloy performance if the materials do not undergo post-processing, such as rolling or heat treatment. In this regard, WAAM is a special manufacturing process. The resultant properties of the build are based on the solidification of layers over layers. Due to cost hindrances, mechanical or thermal post-treatment is avoided as much as possible.
One of the most popular WAAM technologies for building up thin walls uses CMT® (Cold Metal Transfer) as a heat source. CMT® is a patented (Artelsmair [7]) version of the GMAW (Gas Metal Arc Welding) process that controls short-circuiting metal transfer through current and wire feeding (the droplet detaches from the pool to end the short-circuit by a wire retraction-controlled movement). For more information on CMT®, see, for instance, Selvi et al. [8]. In this regard, CMT-WAAM has two fundamental features that affect the solid-state phase transformation of an AlMg5 alloy. The first fundamental feature is heat accumulation, which delays the cooling rate of the wall, in particular within the low-temperature range. This is due to the predominance of conduction as the heat transfer mechanism, as illustrated in Figure 3. The heat from the pool dissipates mainly downwards, not favouring concurrent natural radiation and convection to the environment. However, considering the conductive area to be small (thin walls), the heat diffusivity is low. In WAAM, this phenomenon of heat distribution is commonly referred to as heat accumulation. Moreover, heat accumulation at lower temperatures might promote precipitation and precipitation coarsening.
The second fundamental feature is the cycling self-heat treatment the wall undergoes during sequential layer depositions. This cycling self-heat treatment is due to multiple cycles; the concept is illustrated in Figure 4. Let us consider the two measurement positions in this figure at the layer number n − 2 (Ln−2), in the wall deposition direction (Z direction). During layer number n − 1 (Ln−1) deposition, the position closer to the fusion line of the depositing layer will reach a temperature close to the melting point of the alloy. Let us suppose reaching 560 °C (this temperature could be, for instance, 625 °C, if the position were even closer to the fusion line). Meanwhile, the position farther from the fusion line will result in a smaller peak temperature. Let us say, 400 °C. Whatever the microstructures were at those positions, these peak temperatures are potentially able to solubilise the β-phase (Al3Mg2) in the Al matrix (α-phase). Depending on the cooling rate, there might be a re-precipitation, or not, of the β-phases. It must be stated that Figure 4 is composed of schematics. The actual fusion line positions and peak temperatures are a function of the wall width and material, heat input, and other bead formation-related parameters.
Following this reasoning, these same positions mentioned above will undergo other thermal cycles during the deposition of the subsequent layers, such as layer number n (Ln). However, as the distances of the positions to the heat source become longer, the peak temperatures will be smaller. In this case, the position closer to the fusion line of the layer n will reach, for instance, a temperature close to the solubilisation temperature of the alloy. Let us suppose that it reaches 240 °C, while the position farther from the fusion line will get a smaller peak temperature, such as 150 °C. Therefore, the same material will suffer a new heat treatment. But now, the existing β-phases will potentially not solubilise during heating; instead, they can overage or have phase precipitation during cooling to room temperature. All of this depends on the cooling rates and the permanence time at the given temperatures.
Accordingly, another layer deposited on the top of layer number n (Ln), i.e., a hypothetic layer number n + 1 (not shown in Figure 4), will also experience other thermal cycles, with even smaller peak temperatures (as the distances of the positions to the heat source become too long), with additional heat to maintain the heat accumulation and refrain the layer from fast cooling. On the other hand, another two measuring points hypothetically located on layer number n − 1 (Ln−1) would follow the same thermal pattern, and so on. As a consequence of this thermal pattern, the whole wall will hold microstructures caused by peak temperatures below the solubilisation temperature, yet under the history of other peak temperatures (multiple heat treatments of solubilisation and precipitation). Exceptions will include the microstructures of the top layer (as a deposited solidification microstructure) and the previous layer (which undergoes only one thermal cycle). However, along with the layer height, each position at a given layer will sustain a different thermal history (different multiple peak temperatures and permanence in a specific temperature range) and, consequently, different microstructures. Bands of similar thermal histories may take place or not (they can be randomly distributed). Unfortunately, knowing the thermal history at each location of the wall is a challenge, because it will depend on several factors, such as layer heights, dilution, size of the heat-affected zone and, naturally, the constancy of the layer’s size and heat diffusion (remembering, most of these factors are a function on the welding parameters, and, accordingly, the heat input).
Finally, but not less important than the others, the third fundamental related to using CMT-WAAM when depositing AlMg5 is the influence of the thermal fluctuations on the solidification mode. The obtained solidification mode (e.g., planar, cellular, or dendritic) can be explained based on the relationships between the parameters of temperature gradient G at the solid–liquid interface and growth rate R. It is known (Kou [9], p. 165) that G/R influences the solidification mode and the product G×R affects the refinement scale of the structures. One can say that segregated phases will occur between them as well. Therefore, fluctuations induced during depositions may lead to variations in such parameters, resulting in different microstructural morphologies.
As seen in Figure 5, another typical characteristic of CMT® is two semi-cycles reversing with high power at arcing time (higher heat delivery to the pool due to arc anodic region) and very-low power during short-circuiting time (only heat production by Joule effect). The in-phase profile of I (current) and U (voltage) governed by the synergic line of the equipment justify this P (arc power) profile. This power trace behaviour tends to provide a thermal pulsation to the pool, similar to that from Pulsed-GMAW. During the thermal pulsation, one can expect variations in G/R and G×R parameters. As mentioned, these parameters determine the solidification mode, the structure refinement, and the segregated phase between them in the weld and WAAM. This implies that intercalated bands of finer and coarser dendrites (or another mode), along with segregations, may appear in the wall produced with CMT-WAAM.
Therefore, this study aimed at assessing the influence of multiple thermal cycles in AlMg5 alloy Wire Arc Additive Manufacturing (WAAM) and the heat source profile from CMT on the microstructure evolution of a thin wall. The target is a focus on the microstructure, specifically solidification modes, as well as on solubilisation and precipitations of secondary phases during the build of thin walls using an AWS ER5356 wire.

2. Methodology and Experimental Procedure

The methodology employed to reach this work’s objective was based on comparisons between the microstructures of a thin wall wire arc additive manufactured with an AlMg5 alloy and of the same material from the wall that underwent different customised post-heat treatments in a furnace (furnace-based physical simulations). Wall cross-section samples were taken at different positions in the building direction (Z direction), to account for the effect of multiple thermal cycles typical of thin-wall WAAM. The temperature and time of the furnace-based physical simulation were selected based on the Al–Mg equilibrium diagram and some delineated hypotheses, which will be discussed with the results. Numerical simulations were also employed as a methodological step to support the result discussions and the theory raised.

2.1. The WAAM Thin Wall Building and Metallurgical Characterisation

The Cold Metal Transfer (CMT®) variant of the GMAW process (synergic line code 1678) was used to deposit the thin wall with an AWS AlMg5 wire (see Table 1), ϕ = 1.2 mm, under a contact-tube-to-work distance (CTWD) of 12 mm. An ultra-pure argon grade 5.0 (99.999% purity) was used as a shielding gas. A dedicated nozzle was used to provide additional protection to the shielding from the conventional torch nozzle (Lemes et al. [10]), at the front and rear of the arc. Figure 6 illustrates this experimental torch arrangement with the supplementary shielding gas (SSG) system. The Ar5.0 was also used at the dedicated nozzle at 15 L/min (covering both sides). It is worth noting that, generally, Ar5.0 is not recommended as a shielding gas for aluminium welding, due to its low oxidation potential, which limits electron emission from the plate. Additionally, the high purity of Ar is excessively costly for arc welding purposes. Despite these arguments, the usage of Ar5.0 for shielding gas and SSG was justified to prevent the formation of oxides from external sources, which could disturb the equilibrium to form a β-phase in the deposit (although arc stability was also satisfied with Ar5.0, this feature was not the most important in the experimental procedure).
The built thin wall comprised thirty 200 mm-long layers. A wire arc additively manufactured thin wall is considered here when one track per layer and no torch oscillation in the transverse direction is used in the deposition (potentially reaching from 2 up to 10 mm wide). An aluminium bar (240 mm × 50 mm × 6.4 mm) was used as a substrate, positioned in a fixture with its narrow side facing upward, as depicted in Figure 6. This substrate positioning simulates a pre-wall setup, to maintain a relatively consistent heat flux from the initial layers onward. Bi-directional deposition was employed, in which each layer started from the wall edges (right and left) when a target interlayer temperature (IT) of 50 °C was reached (under natural cooling). IT was monitored over the deposited layer top surface at 30 mm ahead of the arc centreline (wire position) by an infrared pyrometer (Mikron MI-PE140, measurement range between 30 and 1000 °C, resolution of 0.1 °C and acquisition rate of 10 Hz). The same procedure performed in this current work is detailed in Teixeira et al. [11].
The metallurgical evaluation of samples from the wall, as illustrated in Figure 7a, was carried out via metallographic examination (optical microscopy) and microhardness profiling. After cutting, grinding, and polishing the transverse cross-sections, a 1.5 mm × 6 mm Vickers microhardness map was initially swept in the mid-height of the cross-sections of each sample (as shown in Figure 7b). The dimension of 6 mm was selected to make it possible to analyse two completed layers and one interlayer region (given a maximum layer height obtained of 2.6 mm). It is important to note that in parts manufactured with WAAM, as long as an interlayer temperature is adopted and maintained throughout the deposition for the same parameter conditions, the same microstructural and hardness behaviour is expected throughout the entire central height region of the wall. The indenter employed a load of 200 gf for 15 s, with a distance between indentations of 0.5 mm and 0.25 mm in the horizontal and vertical directions, respectively. After the microhardness test, the samples were etched in a solution of 20% HF + 80% H2O, for an immersion time of 35 s. Subsequently, a macrograph of the entire wall and micrographs at various magnifications from distinct regions of the wall were captured utilising an optical microscope.

2.2. In-Furnace Simulation and Metallurgical Characterisation

The post-heat treatments in samples taken from the built wall were meant to physically simulate how subsequent thermal cycles could modify the as-deposited microstructure. The in-furnace simulation conditions are described in Table 2. A laboratory Muffle furnace was used. With a longer soaking time (arbitrarily defined as 10 min) and the difference between its thermal profile and the actual WAAM thermal history, this approach was devised to be a steadier and more controllable way than WAAM for studying the phenomena.
A non-encapsulated 0.6 mm-diameter (each wire) type K thermocouple was fixed onto the surface of each sample. For that, a tiny hole was drilled into the aluminium sample surface, so the end of the thermocouple could penetrate and be clamped by deformation using a punch tool. For slow cooling post-heat treatment, the sample was removed immediately from the furnace after the soak time and left for cooling outside (still air). For fast cooling post-heat treatment, in turn, a container with water at room temperature (around 24 °C) was used (it was placed close to the furnace door, to make a faster sample transfer from the furnace to the recipient). Figure 8 demonstrates how water cooling was more effective than in still air following the in-furnace procedure (a difference of more than 25 min to room temperature and 6 min to reach 100 °C).

2.3. Computational Thermodynamics

Computational simulations were carried out using Thermo-Calc (Sundman et al. [12]) for equilibrium calculations and Scheil solidification simulations (Scheil [13]), with the TCAL8.2 database for thermodynamics. The diffusion module DICTRA (Andersson et al. [14]) within Thermo-Calc was utilised to capture the influence of multiple thermal cycles and different cooling rates on one layer position. For that, DICTRA requires, besides the thermodynamic database, a mobility database for the diffusion data. The MOBFE8 steel database was used in the lack of a dedicated aluminium mobility database. However, the diffusion calculations were limited to Al-4.8Mg, the major components of the alloy under study in this current work, and the liquid phases, α-phase and β-phase. It is reasonable to assume that the MOBFE8 database provides adequate diffusion data for liquid and the α-phase in the Al–Mg system, while diffusion in the stochiometric β-phase will be nil. The DICTRA setup assumed one-dimensional planar growth and a cell size of 10 µm, i.e., a grain size of 20 µm, reasonably reflecting metallography results. Equilibrium was obtained with Thermo-Calc, representing 0 °C/s, whereas cooling rates from 0.01 to 1000 °C/s were simulated using DICTRA, starting at 800 °C and finishing at 100 °C. At the start, there was only a liquid phase. The solid α- and β-phases were expected to precipitate and grow during solidification, through continued cooling in the solid state. The thermodynamics, segregation, and diffusion determine the precipitation and growth of the solid phases and the disappearance of the liquid phase during the cooling sequence.

3. Results and Discussion

Figure 9 features a thin wall with typically low dilution and a short heat-affected zone (HAZ). Two positions were targeted on the wall macrograph for analysis. The first one (Figure 9a) corresponds to the last layer deposited, i.e., the wall region that did not suffer heat treatment from subsequent layers (see also layer Ln in Figure 4). The second position under focus refers to a sample located at the wall half-height layer region (Figure 9b), in which the microstructure has been influenced by multiple thermal cycles due to the successive layers deposited (reheated affected zone). See also layers Ln−2 in Figure 4).
Still regarding Figure 9, different shades can be observed along the wall. Considering the transition lines between layers, it is noted that there is a region formed by alternating light and dark bands above each of these lines, in a banding pattern. These bandings are suspected to be due to a thermal oscillation-related phenomenon during solidification, which were not destroyed by the thermal cycles from the subsequent layer. Below the transition lines, supposedly the heat-affected zone (HAZ), one can also observe a region with a lighter area, resulting from the partial dissolution of precipitates caused by the heat generated from the deposition of the subsequent layer. This statement is based on the difference in the macrostructure of this region compared to the top layer, which was not affected by reheating.
In addition, one can suppose from Figure 9 that the refusion of the previous layer by the subsequent layer is less than 100%. In fact, it is much less. From the difference of heights, one would guess about 20–30%, so that even the reheat treatment by a subsequent layer does not affect the banding from a previous layer. Estimating layer refusion correctly is not trivial when the fusion line is not clearly visible. The best technique is to track down a chemical element variation between the pre-wall and the subsequent layers, but this approach needs to be planned before starting. Therefore, this 20–30% estimation is reasonable for Al alloy GMA-WAAM of thin walls. A low layer refusion, and consequently short HAZ, justifies why the fusion lines were not heat retreated at high temperatures and vanished.
To understand better the existence of these bandings and the multiple HAZs, optical microscope (OM) analyses were carried out over these two zones and the microstructure of the samples after in-furnace simulated heat treatments (Section 2.2). These analyses are described in the following section.

3.1. Upmost Layer Characteristics

The microstructure of the top layer obviously did not undergo subsequent reheating. Therefore, considering this microstructure from optical microscopy (OM), banding is observed in the lower part of the macrograph (just above the last layer fusion line) rather than a homogenous macrostructure. According to Carrard [15], this banded structure consists of a regular succession of dark and light stripes, lying approximately parallel to the solid–liquid front. The fact that no heat treatment was imposed by a subsequent layer (that one is the last layer) eliminates the possibility of such banding resulting from a thermal cycling mechanism. Kurz and Trivedi [16] classified bands based on the formation mechanism: (1) different scales of the same microstructure; (2) periodically varying composition; (3) different microstructures of the same phase; (4) different phases; and (5) different phases and microstructures. As depicted in Figure 10, an alternation between cell sizes, characterising mechanism (1), can be observed.
According to Kurz and Trivedi [16], these instabilities, observed in welding and laser treatment, become very evident when the interface velocity is smaller than the velocity of the unstable flow; nonsteady fluid flow interacts with the thermal and solute boundary layers. Therefore, a steady state cannot be reached at the growth front, and quasi-periodic changes in the scale of the microstructure, for example, of the cells, result. Hwa et al. [17], while conducting depositions of 316 L stainless steel using additive manufacturing with LASER, attribute the formation of these bands to the instabilities generated by the recoil pressure imposed by the laser beam and the impingement of the liquid surface caused by the argon gas jet. Above the mentioned banded zone up to the top, the squared area in Figure 10 points out the predominance of a structure with equiaxed dendritic morphology and interdendritic eutectics (Al3Mg2). This microstructure suggests a high degree of constitutional supercooling, which arises from a decreased G/R ratio in this region.

3.2. Central Layer Characteristics

Figure 11 illustrates a wall central layer (at its half-height) region broken out in different predominate morphologies that compose individual zones. The first zone is named the partially melted zone (PMZ), with peak temperatures within the solidus and liquidus of the alloy, where an α-phase (solid) and liquid co-exist at the end of the heating. Therefore, the metallurgical transformations in the PMZ involve the liquid phase. The second zone is the heat-affected zone (HAZ), in which the peak temperature range is lower than that in the PMZ; consequently, the transformations in a HAZ occur in the solid state. The following downward zone is the fusion zone (FZ). The fusion zone essentially represents the fundamental solidification structure of the metal post-solidification (liquid to solid transformation), subject to further transformation, solid–solid, depending on the material. When FZ is still present in layers that underwent multiple thermal cycles (re-treated), the temperature reached was insufficient for visible metallurgical transformations. The fourth zone, also identified in the central wall layers, was named the banded zone (BZ), already described in Section 3.1.
To characterise the wall at a half-height region, two positions were taken in this area (at a layer centre and the transition between two layers). Figure 12 illustrates the first case. The original microstructure (when this layer was the topmost layer during the deposition sequence) in this region was, as seen in Section 3.1, typically of equiaxed dendritic morphology. Multiple thermal cycles from subsequently deposited layers reheated this material portion at high temperatures, characterising a HAZ. As a consequence, the constituents turned finer.
Using numerical simulations, the progressive thermal cycles acting on the HAZ of one layer were simplified by a temperature sequence with peak temperatures of 500, 400, 300, and 150 °C. A heating rate of 200 °C/s and a cooling rate of 20 °C/s were applied to the peak temperatures. The resulting phase fractions as a function of time are given in Figure 13. One can observe no changes in the α- and β-phase fractions along the duration of the four simulated cycles. However, even during the 500 °C cycle period, some liquid phase appeared, likely due to the melting of the interdendritic eutectics, whose melting point is 450 °C (Figure 1). These simulation results generally agree with the experimental results (OM). The cyclic simulation results in Figure 13 clearly indicate that while the β-phase is melted during the 500 °C sequence, it instantly reforms at about equal fraction. The subsequent cycles at 400, 300, and 150 °C have no influence on the β-phase fraction. The explanation for this is that the stochiometric β-phase has a melting temperature of about 450 °C, so any temperature below this will have zero influence on the phase fraction, thus remaining constant.
Consider now the transition between two layers, reproduced in Figure 14. Upon closer inspection at higher magnification, one can observe larger and more frequent black particles gathered in a narrow distance range just below the fusion line. Before starting to analyse the results, it is important to state that there is a relationship between particle size, distribution and distance between them and the cells/dendrites that are formed. The latter, in turn, is related to the mechanism and the region where solidification occurs. For example, the dendrites in the PMZ were previously coarse dendrites at the previous layer before being partially melted by the subsequent layer. They were already large, evidenced by the spacing between them. Hence, the interdendritic particles or eutectics between the dendrites are also larger in volume. One reason for dendrite enlargement upon reheating could be phase growth through coalescence, following the Ostwald ripening phenomenon. Additionally, precipitation of other phases or eutectics, which are less saturated than Al3Mg2 or are even over-aging, may occur in these regions simultaneously.
The band of coarser particles below the fusion line, on the other hand, means a material region reheated at very-high peak temperatures for the alloy, ranging from approximately 585 °C and 630 °C, due to the subsequent layer deposition. In this temperature range, liquid and α-phase co-exist at the end of the heating. This α + L temperature range (Figure 1) characterises the partially melted zone (PMZ).
When the PMZ is progressively cooled by heat transfer to the remaining wall (downstream in the Z direction), L solidifies as α-Al, simultaneously with the eutectics in the interdendritic spaces (depending on the temperature reached inside the PMZ and heating/cooling rates, only eutectic will melt and solidify). It is important to say that the same material position, before this heating event by the subsequent layer, was already formed of eutectics (Al3Mg2 + α) over an Al matrix (α-phase), that is, in a FZ. The PMZ revealed the presence of coarser cells, as also identified in the work of Holesinger et al. [18]. Due to the thermal history cycles, conditions are created to have eutectic coarsening. This is the reason for having this characteristic band of larger eutectics in the PMZ in all layers.
Figure 14 still shows that below the PMZ the heat input by the subsequent layer still affects the material, whose morphology was initially of a fusion zone aspect with no reheating by subsequent thermal cycles, creating a solid-state heat-affected zone (HAZ). The lack of dendritic or cellular structure boundaries in the HAZ results from partial solubilisation promoted by the thermal cycle of the deposited bead above this region. In the high-temperature heat-affected zone (HAZ) below the partially melted zone (PMZ), in addition to coarse dendrites, there is partial dissolution of the particles. This dissolution is most noticeable at low magnification, where regions of lighter shade are observed at the top of the layers that underwent thermal cycles from a subsequent layer. In the fusion zone (FZ), below the heat-affected zone (HAZ), the cells and dendrites, on the other hand, are finer. Consequently, the interdendritic phases are less voluminous. Cells and dendrites are refined due to significant supercooling during the deposition of the subsequent layer onto the previously cold solidified layer.
The fusion zones (FZ) in the wall centre (subsequent layers along the wall-building direction) are, as commented in Section 3.1, composed of a dendritic matrix (α-phase) with interdendritic particles (likely Al3Mg2 eutectics). They are not reheated by the subsequently deposited layers, at least not at a temperature where visible metallurgical transformation could occur (in theory, above the solubilisation line of Figure 1). However, in practice, partial solubilisation might occur in the FZ of the wall half-height layers.
The banded zone (BZ) formed beneath the FZ in the intermediate layers, as depicted in Figure 15, reveals the alternating cellular structures with different sizes. As pointed out in Section 3.1, this variation can be attributed to fluctuations in growth rates at the solidification front caused by thermal oscillation. This thermal oscillation may arise due to the short-circuiting transfer in CMT-WAAM, wherein arc energy transitions from high to low levels (see Figure 5).

3.3. In-Furnace Simulated Sample Characteristics

As detailed in Section 2.2, heat treatments on the material deposited by WAAM were applied in the samples located at the centre of the wall building direction. The heat treatment was analogous to a solubilisation treatment (at two soak temperatures, 300 °C and 500 °C), followed by cooling in still air (slower cooling rate), simulation SIM-1, or in water (faster cooling rate), simulations SIM-2 and SIM-3 (Table 2). One must consider that the solubilisation treatment will not change the solidification mode, that is, the dendrites or cells will still be maintained. However, a secondary rearrangement of the dendrites or cell boundaries, and consequently the interdendritic spaces, are expected (depending on the soaking temperature and time), as well as solubilisation, formation, and coarsening of the eutectics (depending on the soaking temperature and time and the cooling rate). As seen in the phase diagram (Figure 1), the precipitation of the β-phase occurs below 250 °C.
Figure 16 shows the microstructure for the sample SIM-1, in which the in-furnace simulation was employed with the soak temperature just above the β-phase solubilisation line and the cooling in still air. Figure 17, in turn, illustrates the SIM-2 case, which used the same soak temperature and a cooling performed in water. Dark particles can be observed in both samples (similar to that in the WAAM deposited condition, Figure 12). However, no significant differences are noted between these two samples, suggesting either that solubilisation did not take place at 300 °C × 10 min, or the eutectics formed again at the same place (no rearrangement of the dendrites). One way or the other, the cooling rate (still air or water) did not govern the eutectic formation kinetics. No significant difference was ascertained between these simulated samples and the original wall on the OM level. This latter finding suggests that the thermal cycles promoted by a subsequent layer on the previous layer will not change the microstructure morphology when reheating the material at less than 300 °C.
Considering that a higher temperature would be necessary to modify the microstructure, the third heat treatment (SIM-3) was carried out at 500 °C for 10 min, followed by cooling in water. In equilibrium, this soak temperature keeps the material still in the solid state, not in that of the partially melted zone (PMZ), as seen in Figure 1. However, there may be incipient melting, given that the eutectic temperature, according to the AlMg phase diagram, is 450 °C. This, in principle, would justify the presence of particles that still remain in the microstructure after cooling.
Figure 18 shows the cross-section of the sample submitted to this new post-heat treatment. As can be seen, the black particles in the frame of the highest magnification are now homogeneously distributed, rather than gathered in bands. The matrix (α-phase) lost the dendritic structure, and turned into almost equiaxial grains (in fact, one can say that the equiaxial grains existed before, but the dendritic structure did not allow them to be easily identified). This morphology suggests that the heat-affected zone (HAZ) promoted by a subsequent layer on the previous layer centre will have its own features, of a material reheated at less than the solidus temperature up to approximately 300 °C. One interesting point of this analysis is that the banded zone (BZ) does not appear inside the HAZ of each layer because the particles are forced to scatter. However, the BZ also does not occur below the HAZ, but above the fusion line.
To evaluate the pertinence of this in-furnace simulation, a microhardness test was applied to all samples. It can be seen in Figure 19 that the hardness is equal or very close among the different conditions. The maps show that most hardness values are between 73 and 81 HV (light-blue and green regions, respectively). Since the variation in the amount and size of the eutectics (α + Al3Mg2) did not affect the microhardness (considering the standard deviations), it can be said that the predominant hardening mechanism continued to be through solid solution. Using the same filler metal (AWS ER5356), Zhu et al. [19] presented results within the same range (72 to 77 HV), even using three different trajectory strategies. However, Köhler et al. [20] found lower values (66 to 72 HV) when studying the influence of the idle time between layers and deposition parameters
Using other deposition materials, despite also being a precipitation-hardenable alloy, Hou et al. [21] also found homogeneous hardness values throughout the microstructure in the WAAM deposition of an Al–Mg–Sc–Zr alloy. In contrast, Kannan et al. [22], when fabricating an Al–Cu alloy wall using WAAM, observed hardness variations between 68 and 86 HV. According to these authors, this difference is attributed to microstructural characteristics involving columnar and dendritic structures along the build direction. Due to the presence of precipitated θ-phases, the hardness is higher in the equiaxed dendritic regions, and less hardness is observed in the columnar dendrites. In other words, the equiaxed region has more grain boundaries and a higher density of precipitated phases compared to the columnar dendritic areas. Yuan et al. [23] observed significant hardness variations in an AA7075 alloy, ranging from 110 to 145 HV. According to these authors, this variation was caused by differences in the quantity and morphology of precipitated phases, influenced by the thermal cycles of WAAM.

4. General Discussion

First of all, one must keep in mind that all layers in this work were deposited with the same parameters and at the same condition. Then, the same layer and pool sizes (widths and heights) were expected in the building direction. That being said, a microstructure variation that occurred only between the top layer (the last deposited layer), maybe also at one or two layers below the top one, and the preceding layers (the numerous previous layers) is easily understood, considering the potential effect of the subsequent thermal cycles on the earlier layers. However, the results showed that in each of the layers which were heat-treated by the multiple thermal cycles, when using a pulsing-like energy heat source (see Figure 5), more than the traditional heat-affected zone effect on the previous pass, as in arc welding, occurred. That is, a thin wall built up with AlMg5 via WAAM presented unique microstructural-related regions, as illustrated in Figure 11. Each of the zones presents a particular morphology characteristic.
In the partially melted zone (PMZ), where solid and liquid phases exist side-by-side, a band of coarse dendrites and interdendritic phases is formed in each subsequent layer during cooling to room temperature. The heat-affected zone (HAZ) exists, as expected, below the PMZ. In the imposed HAZ over each layer, the eutectics are finer, as a result of the partial dissolution of the interdendritic phase (existing previously, when the layer was the top layer) at which the material portion was exposed to high temperatures. Even in the fusion zone (FZ), which is the remaining FZ that still exists in a thermally retreated layer, a gradual microstructure change is observed from the banded zone towards the top of the layer. Near the banded zone, a cellular structure was identified, while the top region of the layer presented a dendritic morphology. This change is related to the increase in constitutional supercooling described by G/R, with such a relationship decreasing towards the top of the layer.
The last zone is named the banded zone (BZ), as illustrated at the bottom of the layer in Figure 11. The BZ banding is due to a mechanism different from the band in the PMZ. The likely cause for the banding at the BZ is thermal oscillation imposed by the specific arc used (CMT®), with a characteristic arc power pulsing profile. The effect of pulsed current on the pool solidification in aluminium arc welding is known. It is worth stating that this banding also happens under the FZ of the top layer, yet it is weaker (Figure 10). That is, the banding existing in the top layer was kept in the subsequent layers. However, the thermal cycles may have intensified each narrow band, even if the temperature peak was lower. Not least likely, the cause for the increased banding contrast in the thermally cycled layers could be the dissolution of the finer particles due to thermal cycling.
Based on thermal treatment simulations performed on the WAAM-obtained wall, only the treatment conducted at 500 °C for 10 min resulted in significant changes in the microstructure. This treatment eliminated the solidification structure, resulting practically in an AlMg solid solution. Treatments at 300 °C for 10 min were insufficient to promote significant microstructural alterations. Considering that the mechanism involved in substitutional diffusion is directly related to time and temperature, these parameters were insufficient to induce microstructural changes. This fact reveals that higher temperatures are necessary to induce microstructural alterations at the optical microscopy level during thermal cycling, even for shorter durations.
The above-mentioned phenomena emphasise the role played by the technique (CMT®) used to transfer heat and feedstock to build a layer over layer. The hypothesis is that the unique power cycle delivered via CMT® (Figure 5) governs the heat oscillation responsible for the banding at the BZ. It is correct to say that another aluminium alloy, instead of that used in this work, AlMg5 for short, would produce different zones identified and shown in Figure 11. Bulky parts, rather than thin walls, also tend to create zones that are distinct from those characterised in this work. However, the importance of the alloy as an engineering material is recognised. Thin walls are probably frequently used in GMA-WAAM when topology optimisation is employed in the part designs. CMT® is likely the most popular technique for GMA-WAAM. Then, the outcomes of this work related to these specific conditions are valuable.
Anyway, for these boundary conditions (material, technique, and thin wall), one can expect that the mechanical properties in each region (different zones) would differ. The impact of these differences in such a short distance (approximately 2 mm from the layer heights) needs to be studied in detail, but it is not in the scope of this current work. This subject will be conducted as a future work. The same is true about the influence of the typical CMT® power cycles, as a thermal pulsation agent, on the microstructure evolution.

5. Conclusions

The aim of the work described in this paper was to assess the influence of multiple thermal cycles and heat source features on the microstructure evolution in the Wire Arc Additive Manufacturing (WAAM) building direction of an AlMg5 alloy thin wall. This study focused on the solidification modes and the eutectic-type constituent’s solubilisation and precipitations while building the walls using an AWS ER5356 wire with CMT® equipment. The analyses of the microstructure evolution were based on metallographic sampling of the thin wall built using the mentioned wire and the characteristic cyclic power oscillation of the heat source. These analyses were supported by subjecting the wall samples to in-furnace simulation heat treatments and numerical simulation of the solidification transformation. From that, the following was concluded:
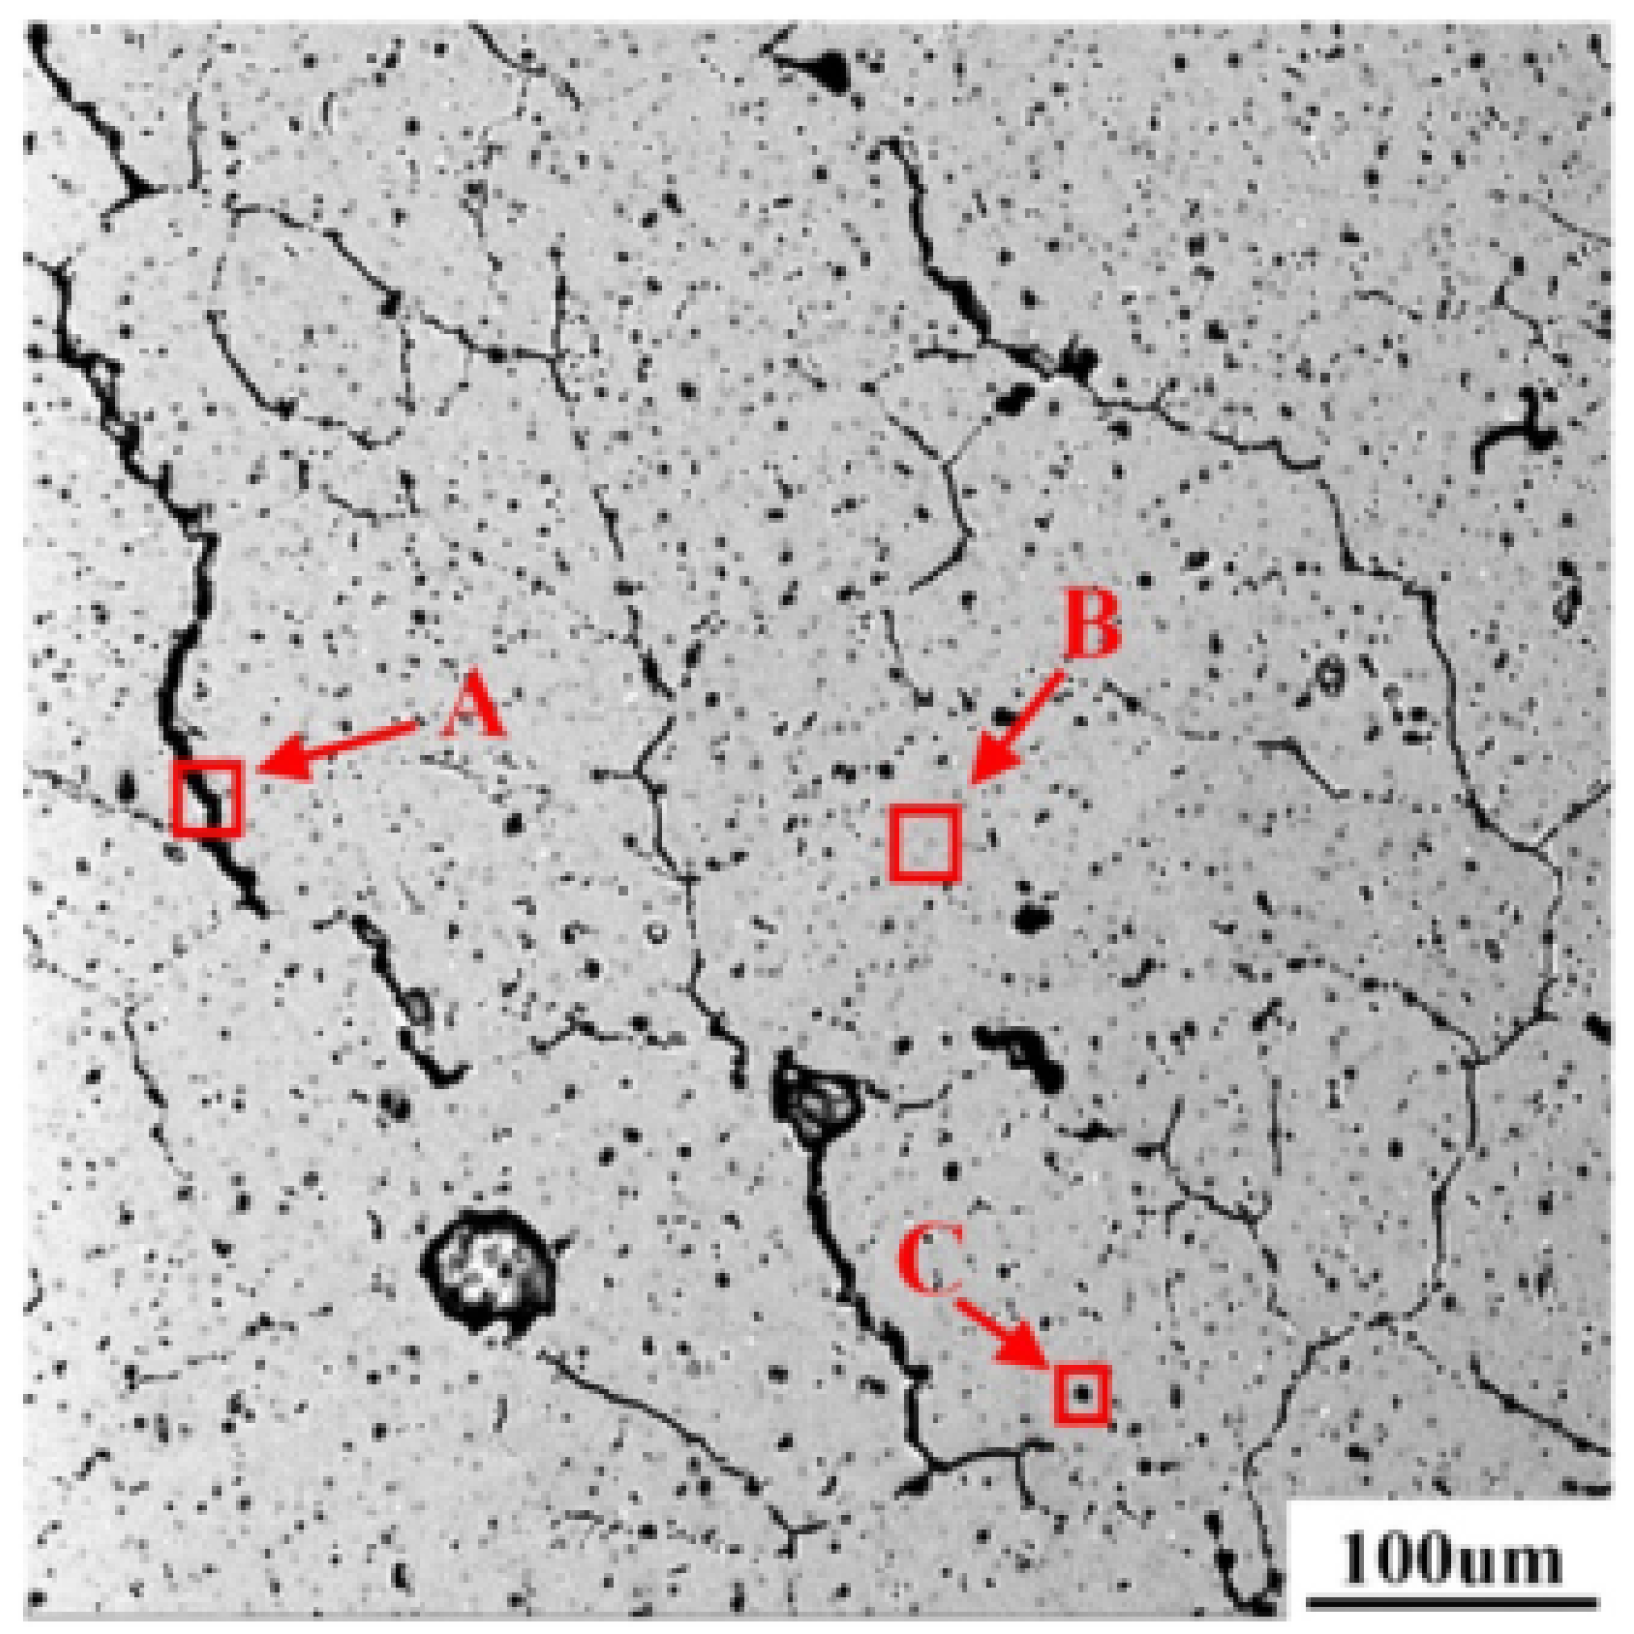
  • The CMT® equipment and its dedicated synergic line for this alloy deliver arc power in a cyclic pulsing way. Evidence indicates that the power waveform and the differences between the low- and high-power cycles are sufficient to induce heat oscillation and alterations in the solidification front, thereby promoting the formation of a banded structure on a macroscopic scale at the lower part of the pool. Microscopically, the banded structure is formed by different sizes of cells. In addition, the structure in the fusion zone also exhibits the presence of cellular and dendritic substructures extending from the fusion line towards the top of the layer. This change is related to the increase in constitutional supercooling described with G/R, with such a relationship decreasing towards the top of the layer;
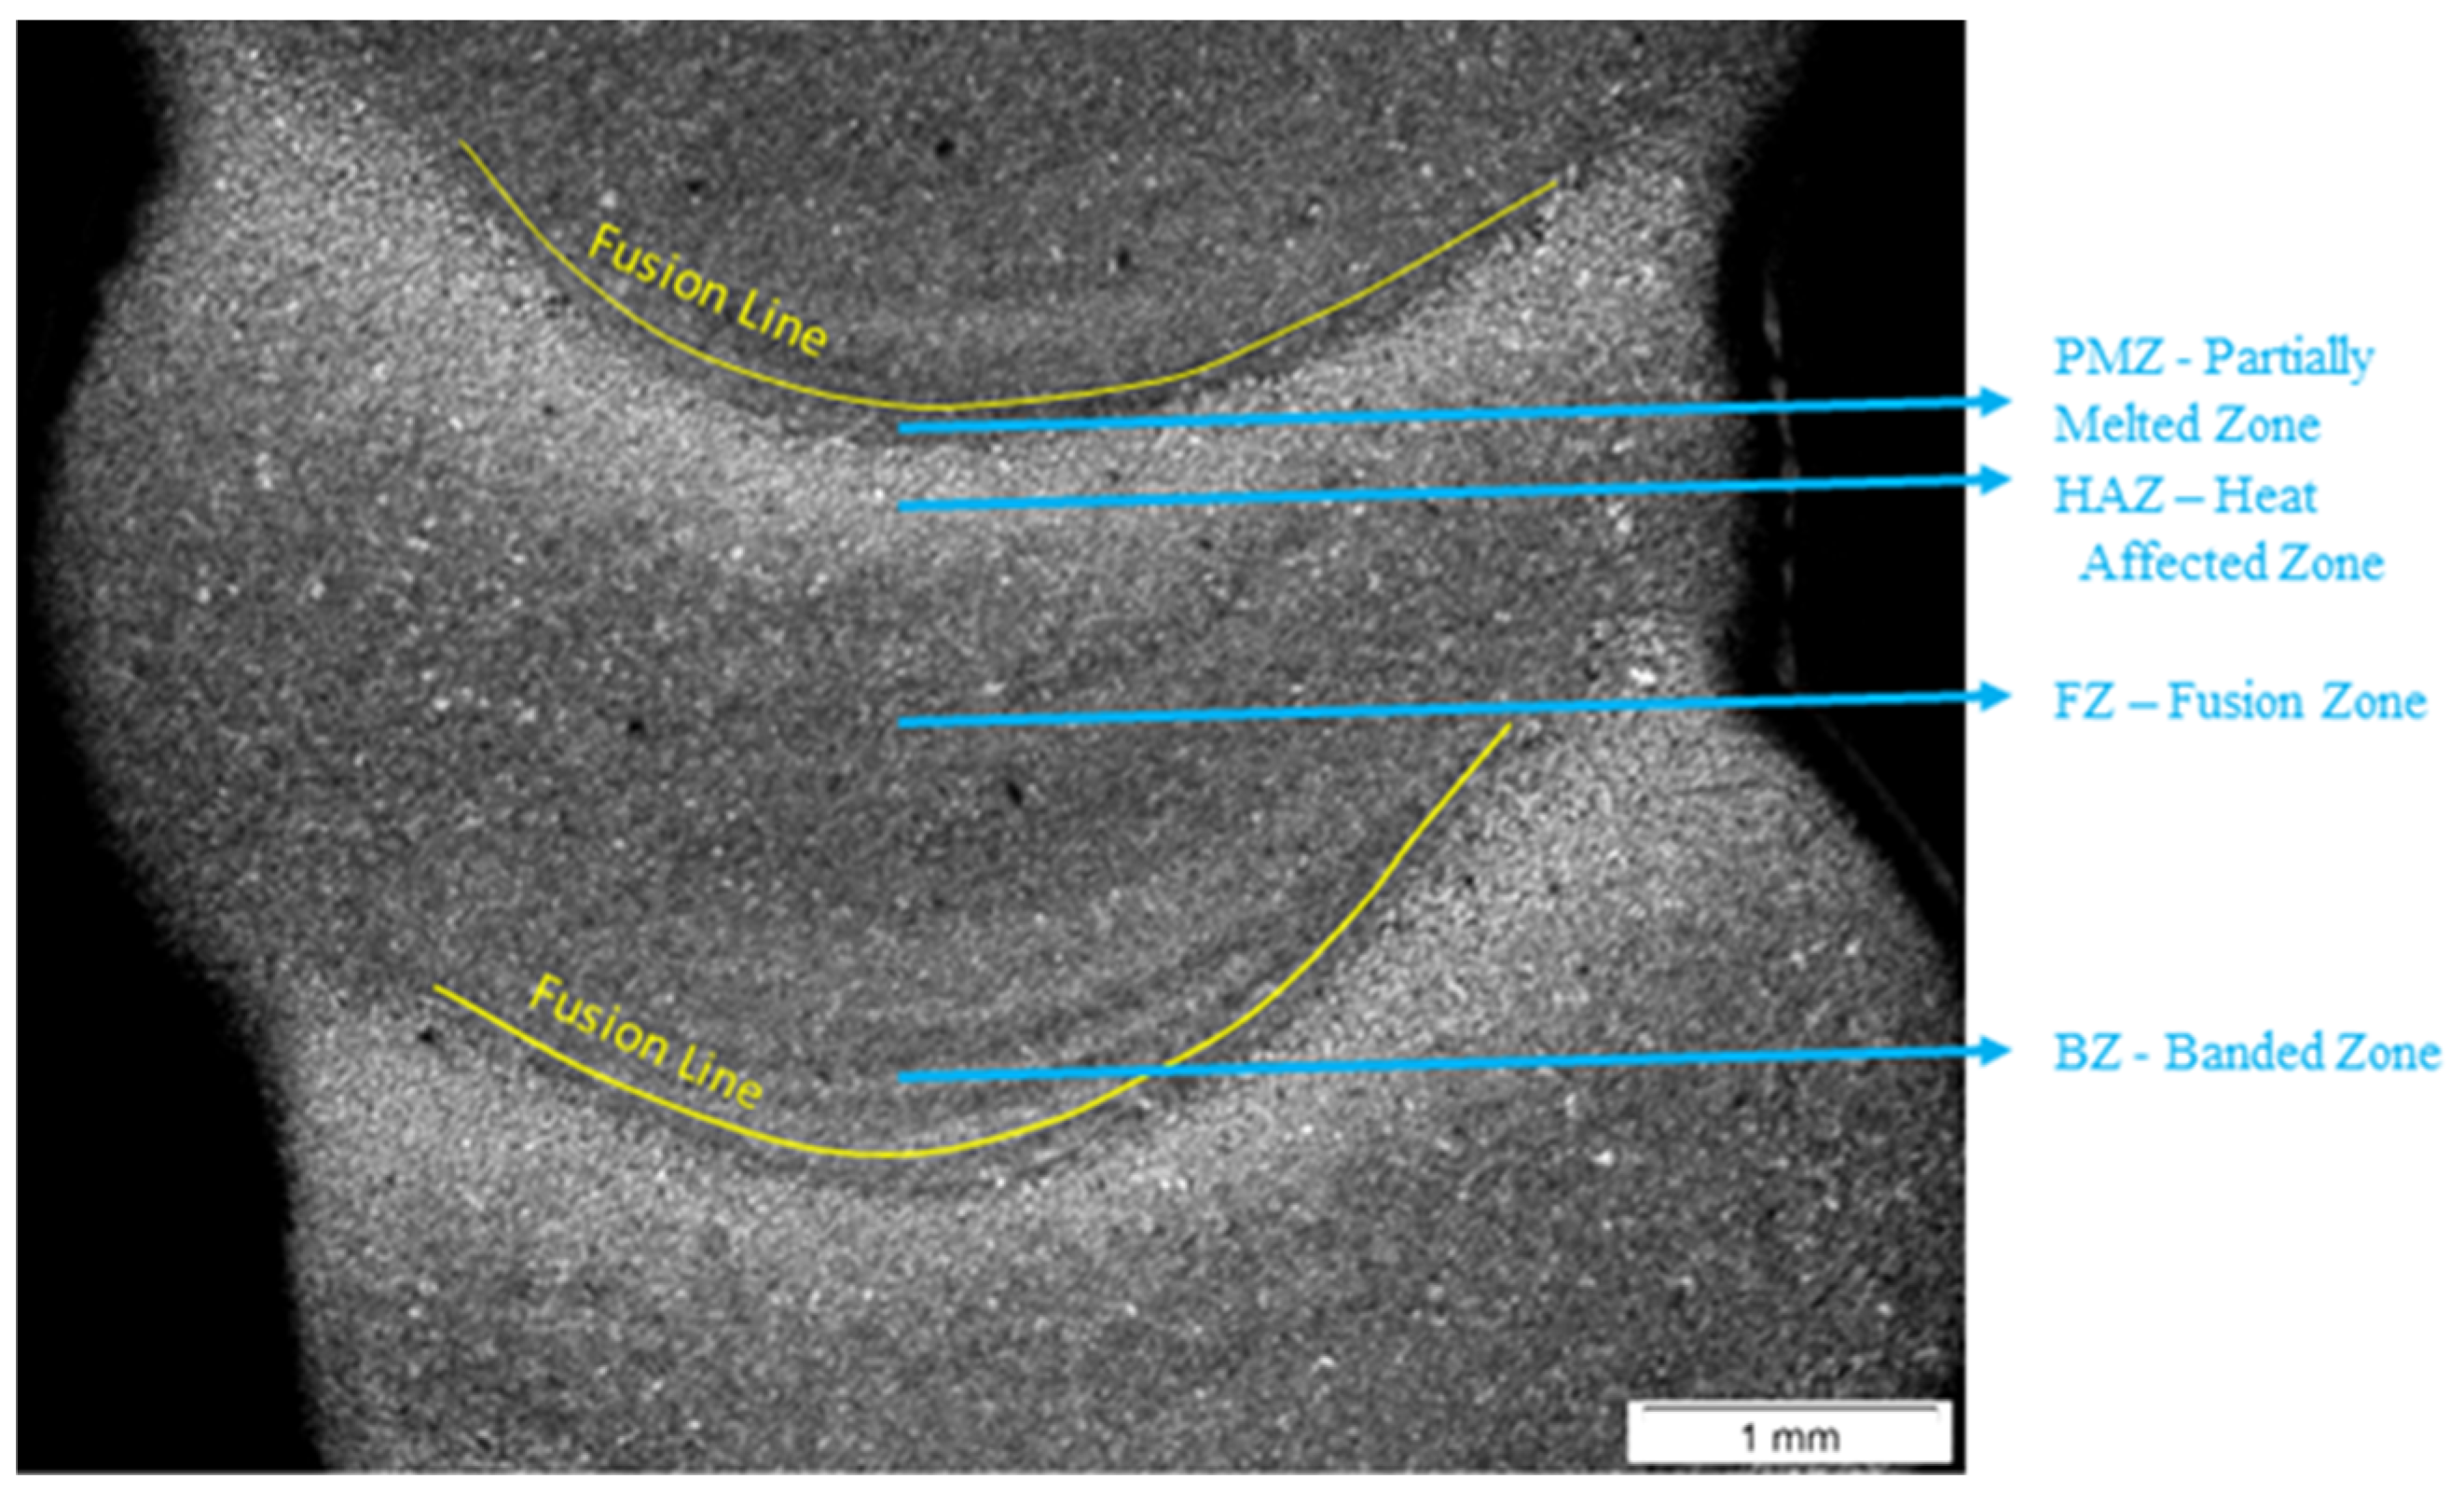
  • The multiple thermal cycles imposed by subsequently deposited layers also change the morphologies of the original microstructure (as that existing in the top layer), in such a way that, depending on the peak temperature reached, different morphological zones appear in each layer;
  • The subsequent thermal cycles on the previous layer create several morphological zones in each layer (replicated throughout the building direction, except in the top layer), with different characteristics;
  • In the zone closest to the fusion line of the subsequent layer (upper region of the layer), where the peak temperature is at the highest temperature, within the solidus–liquidus temperature for this alloy, a partially melted zone (PMZ) is formed as a band composed of coarse dendrites and an interdendritic phase;
  • In the below zone, the heat-affected zone (HAZ), partial dissolution of the interdendritic phase occurs;
  • Following that comes the fusion zone (FZ), where the original as-deposited microstructure, with no reheat treatment, is preserved, and the cells/dendrites and the interdendritic phases are fine;
  • In the region at the base of each layer, a banded zone forms by alternating sizes of cells. Due to the thermal cycling, the cells still undergo partial dissolution of the interdendritic phases, further highlighting the presence of the bands in relation to the original ones formed in the top layer;
  • These four distinct zones in each layer, whose extension and area depend naturally on the combination of heat source energy and heat dissipation (related mainly to wall width and interlayer temperatures), are prone to complex mechanical properties of the wall (the impact of which is the subject of future work), different from the same wall built by other techniques (casting, machining, etc.);
  • Numerical simulation studies revealed that the thermal cycling imposed on the solidified material did not significantly promote the precipitation of second-phase particles.
It is worth mentioning that not all zones and/or different microstructure morphologies other than the unique evolution of this work would occur in WAAM of AlMg5 thin wall if different parameters (consequently, imposing other heat inputs, dilutions, and heat distribution) and/or different heat source suppliers (with stronger or weaker effects of thermal pulsation) are used. Therefore, other layer microstructure architectures can be found in similar work.

Author Contributions

Conceptualization: S.L.H., A.S., V.L.J., F.R.T. and S.W.; methodology: S.L.H. and A.S.; software: S.W.; material preparation and data collection: V.L.J. and F.R.T.; investigation: V.L.J. and F.R.T.; validation: V.L.J., F.R.T., A.S. and S.L.H.; data curation: V.L.J. and F.R.T.; writing—original draft preparation: V.L.J. and F.R.T.; writing—review and editing: V.L.J., F.R.T., S.W., A.S. and S.L.H.; supervision: A.S. and S.L.H.; project administration: A.S.; funding acquisition: A.S. All authors have read and agreed to the published version of the manuscript.

Funding

This work was supported by the National Council for Scientific and Technological Development—CNPq (306053/2022-5) and the Coordination for the Improvement of Higher Education Personnel—CAPES (Finance Code 001).

Data Availability Statement

The datasets generated during and/or analysed during the current study are available from the corresponding author on reasonable request.

Acknowledgments

The authors would like to thank the Federal University of Uberlandia, Brazil, for their generous support in providing laboratory infrastructure and essential materials, which significantly contributed to the success of this research. They also thank White Martins (https://www.whitemartins.com.br/, accessed on 12 June 2024), through William Macedo and Katarina Fernandes, and GMW Welding (https://www.gmw.com.br/, accessed on 12 June 2024), in the person of Adilson Moreno, for supplying shielding gases and wire, respectively.

Conflicts of Interest

Author Sten Wessman is employed by the research centre Swerim AB. The remaining authors declare that the research was conducted in the absence of any commercial or financial relationships that could be construed as a potential conflict of interest.

References

  1. Ryen, Ø.; Holmedal, B.; Nijs, O.; Nes, E.; Sjölander, E.; Ekström, H.E. Strengthening mechanisms in solid solution aluminum alloys. Metall. Mater. Trans. 2006, 37, 1999–2006. [Google Scholar] [CrossRef]
  2. Zielińska-Lipiec, A.; Dubiel, B.; Czyrska-Filemonowicz, A. Microstructure of the complex metallic β-Al3Mg2 phase. Inżynieria Materiałowa 2010, 31, 562–564. [Google Scholar]
  3. Ren, L.; Gu, H.; Wang, W.; Wang, S.; Li, C.; Wang, Z.; Zhai, Y.; Ma, P. Effect of Mg Content on Microstructure and Properties of Al–Mg Alloy Produced by the Wire Arc Additive Manufacturing Method. Materials 2019, 12, 4160. [Google Scholar] [CrossRef] [PubMed]
  4. Su, C.; Chen, X.; Gao, C.; Wang, Y. Effect of heat input on microstructure and mechanical properties of Al-Mg alloys fabricated by WAAM. Appl. Surf. Sci. 2019, 486, 431–440. [Google Scholar] [CrossRef]
  5. Prakash, V. Physical metallurgy of Aluminium Alloys. In Symposium on Non-Ferrous Metals Technology; NML Jamshedpur: Jamshedpur, India, 1968; pp. 138–147. Available online: http://eprints.nmlindia.org/3781 (accessed on 15 January 2023).
  6. Davis, J.R. & Associates. Aluminum and Aluminum Alloys, 6th ed.; ASM International Materials Park; ASM International: Materials Park, OH, USA, 2007; 544p, ISBN 978-0-87170-496-2. [Google Scholar]
  7. Artelsmair, J. Welding Method and Welding Device for Carrying out Said Welding Method. Applicant Fronius Welding Machines Produktion GMBH & CO. Patent International Number WO 00/64620, 26 April 2000. [Google Scholar]
  8. Selvi, S.; Vishvaksenan, A.; Rajasekar, E. Cold metal transfer (CMT) technology—An overview. Def. Technol. 2018, 14, 28–44. [Google Scholar] [CrossRef]
  9. Kou, S. Welding Metallurgy, 2nd ed.; John Wiley & Sons Inc: Hoboken, NJ, USA, 2003; pp. 216–241. [Google Scholar]
  10. Lemes, V.J.; Teixeira, F.R.; Scotti, A.; Scotti, F.M.; Siewert, E. The significance of supplementary shielding in WAAM of aluminium thin walls. J. Manuf. Process. 2023, 106, 520–536. [Google Scholar] [CrossRef]
  11. Teixeira, F.R.; Scotti, F.M.; Jorge, V.L.; Scotti, A. Combined Effect of The Interlayer Temperature with Travel Speed on Features of Thin Wall WAAM under Two Cooling Approaches. Int. J. Adv. Manuf. Technol. 2023, 126, 273–289. [Google Scholar] [CrossRef]
  12. Sundman, B.; Jansson, B.; Andersson, J.-O. The Thermo-Calc databank system. Calphad 1985, 9, 153–190. [Google Scholar] [CrossRef]
  13. Scheil, E. Bemerkungen Zur Schichtkristallbildung. Z. Metallkunde 1942, 34, 70–72. [Google Scholar] [CrossRef]
  14. Andersson, J.-O.; Höglund, L.; Jönsson, B.; Ågren, J. Fundamentals and Application of Ternary Diffusion; Purdy, C.R., Ed.; Pergamon Press: New York, NY, USA, 1990; 153p. [Google Scholar]
  15. Carrard, M.; Gremaud, M.; Zimmermann, M.; Kurz, W. About the banded structure in rapidly solidified dendritic and eutectic alloys. Acta Metall. Mater. 1992, 40, 983–996. [Google Scholar] [CrossRef]
  16. Kurz, W.; Trivedi, R. Banded solidification microstructures. Metall. Mater. Trans. A 1996, 27, 625–634. [Google Scholar] [CrossRef]
  17. Hwa, Y.; Kumai, C.S.; Devine, T.M.; Yang, N.; Yee, J.K.; Hardwick, R.; Burgmann, K. Microstructural banding of directed energy deposition-additively manufactured 316L stainless steel. J. Mater. Sci. Technol. 2021, 69, 96–105. [Google Scholar] [CrossRef]
  18. Holesinger, T.G.; Carpenter, J.S.; Lienert, T.J.; Patterson, B.M.; Papin, P.A.; Swenson, H.; Cordes, N.L. Characterisation of an Aluminum Alloy Hemispherical Shell Fabricated via Direct Metal Laser Melting. JOM 2016, 68, 1000–1011. [Google Scholar] [CrossRef]
  19. Zhu, K.; Wang, J.; Zhang, W.; Zhu, X.; Lu, X. Effect of deposition strategies on microstructures, defects and mechanical properties of 5356 aluminum alloy by wire arc additive manufacturing. Trans. Nonferrous Met. Soc. China 2024, 34, 423–434. [Google Scholar] [CrossRef]
  20. Köhler, M.; Hensel, J.; Dilger, K. Effects of Thermal Cycling on Wire and Arc Additive Manufacturing of Al-5356 Components. Metals 2020, 10, 952. [Google Scholar] [CrossRef]
  21. Hou, X.; Zhao, L.; Ren, S.; Peng, Y.; Ma, C.; Tian, Z.; Qu, X. A comparative study on Al-Mg-Sc-Zr alloy fabricated by wire arc additive manufacturing with controlling interlayer temperature and continuous printing: Porosity, microstructure, and mechanical properties. J. Mater. Sci. Technol. 2024, 193, 199–216. [Google Scholar] [CrossRef]
  22. Kannan, A.R.; Rajkumar, V.; Vasudevan, S.V.; Jerome, P.; Oh, T.H. Microstructure, hardness, and electrical resistivity of Al-Cu alloy fabricated via wire arc additive manufacturing. Mater. Today Commun. 2024, 39, 108582. [Google Scholar] [CrossRef]
  23. Yuan, T.; Li, Y.; Chen, S.; Ren, X.; Zhao, P.; Zhao, X.; Shan, H. Microstructural evolution and mechanisms affecting the mechanical properties of wire arc additively manufactured Al-Zn-Mg-Cu alloy reinforced with high-entropy alloy particles. J. Alloys Compd. 2024, 992, 174582. [Google Scholar] [CrossRef]
Figure 1. Standard Al–Mg phase equilibrium diagrams.
Metals 14 00717 g001
Figure 2. Scanning electron micrograph of CMT-WAAM obtained with the AWS ER5356 filler wire. A and C are particles of β-phase (Al3Mg2); B is the grey colour background that corresponds to the α-phase (Reprinted with permission from ref. [4]. 2024 Elsevier (License Number 5797940990297).
Metals 14 00717 g002
Figure 3. Schematic of the heat transfer mechanisms in WAAM of thin walls (Qcond is predominantly in thin walls).
Metals 14 00717 g003
Figure 4. Schematics of multiple thermal cycles in multi-layer WAAM of a thin wall and of the peak temperatures and the corresponding temperature in a phase diagram of an Al–Mg 5% alloy (where L stands for layer and n for the sequential position of the layer).
Metals 14 00717 g004
Figure 5. A sample of 5 power cycles typical of Al alloy depositions with CMT-WAAM (1.2-mm AWS ER5356 wire, Ar5.0, wire feed speed = 4.7 m/min and deposition speed = 35 cm/min).
Metals 14 00717 g005
Figure 6. Supplementary shielding gas system, composed of two additional shielding gas nozzles coupled to a GMAW conventional torch nozzle (CTN): note the honeycomb diffuser at the extra nozzles exits to make the shielding flow more lamellar.
Metals 14 00717 g006
Figure 7. (a) Positions of 50 mm long × 10 mm wide × ≈ 6.4 mm thick samples extracted from the wall, one for the as-deposited condition transverse cross-section analysis and the three others for in-furnace physical simulations. (b) Illustration of the microhardness maps on a cross-section.
Metals 14 00717 g007
Figure 8. Monitored temperatures during cooling of the in-furnace samples, quenched from 300 °C × 10 min in water and still air.
Metals 14 00717 g008
Figure 9. Macrographs of the wall cross-section target for analyses: (a) wall top layer (fusion zone without being reheated by subsequent layers) and (b) wall half-height layers (multiple reheated zone).
Metals 14 00717 g009
Figure 10. OM macrograph of the wall top layer, in which the banded zone is identified inside the blue square via magnification (alternated size of cellular structure) and the red square reveals equiaxed dendrites and cells.
Metals 14 00717 g010
Figure 11. The wall half-height layer cross-section, denoted by different zonas according to the peak temperature reached by the thermal cycle imposed by the subsequent layer.
Metals 14 00717 g011
Figure 12. OM micrographs with progressive magnification from a layer sample at the wall half-height layer in an as-deposited condition (without post-heat treatment), highlighting the HAZ (heat-affected zone).
Metals 14 00717 g012
Figure 13. (a) Programmed simulation of the cycled thermal cycles, with a heating rate of 200 °C/s and cooling rate of 20 °C/s. (b) Phase fraction as a function of time for the cyclic DICTRA simulation.
Metals 14 00717 g013
Figure 14. OM micrographs with progressive magnification from a sample of the transition at the wall half-height (reheat treated affected zone) in an as-deposited condition (without post-heat treatment), highlighting the presence of a band of coarse eutectics below the fusion line (in the PMZ).
Metals 14 00717 g014
Figure 15. OM microstructure of the BZ (banded zone—Figure 11), sampling a layer at the wall half-height in an as-deposited condition (without post-heat treatment), revealing the solidification banding (fine and coarse dendrites or cells and eutectics) due to thermal pulsation.
Metals 14 00717 g015
Figure 16. Micrographs with progressive magnification from the transition between layers at a wall half-height after post-heat treatment at 300 °C for 10 min and cooled in still air.
Metals 14 00717 g016
Figure 17. Micrographs with progressive magnification from the transition between layers at the wall half-height after post-heat treatment at 300 °C for 10 min and cooled in water.
Metals 14 00717 g017
Figure 18. Micrographs with progressive magnification from the transition between layers at the wall half-height after post-heat treatment at 500 °C for 10 min and cooled in water.
Metals 14 00717 g018
Figure 19. Hardness maps taken from the samples of the wall at a half-height layer that either underwent or did not receive a post-heat treatment (HT) at different peak temperatures and cooling media (WC stands for water cooling and SA stands for still air cooling).
Metals 14 00717 g019
Table 1. Chemical composition (wt%) of the AWS ER5356 wire provided by the wire supplier (optical emission spectroscopy (OES) analysis).
SiFeCuMnMgCrZnTiBeVAl
0.05130.10930.00170.14134.80120.12960.00340.09790.00010.0104Bal.
Table 2. Experimental matrix for the in-furnace simulations using samples taken from the wall.
SimulationSoak Temperature
(°C)
Soak Time
(min)
Cooling Media (at Room Temperature)
SIM-130010Still air
SIM-230010Water
SIM-350010Water
Disclaimer/Publisher’s Note: The statements, opinions and data contained in all publications are solely those of the individual author(s) and contributor(s) and not of MDPI and/or the editor(s). MDPI and/or the editor(s) disclaim responsibility for any injury to people or property resulting from any ideas, methods, instructions or products referred to in the content.

