Location via proxy:   [ UP ]  
[Report a bug]   [Manage cookies]                
Article

Assessment of Rooftop Photovoltaic Potential Considering Building Functions

1
School of Geography and Ocean Science, Nanjing University, Nanjing 210023, China
2
Key Laboratory of Virtual Geographic Environment (Ministry of Education of PRC), Nanjing Normal University, Nanjing 210023, China
3
Jiangsu Provincial Key Laboratory of Geographic Information Science and Technology, Nanjing University, Nanjing 210023, China
4
Jiangsu Center for Collaborative Innovation in Geographical Information Resource Development and Application, Nanjing University, Nanjing 210023, China
5
International Research Center of Big Data for Sustainable Development Goals, Beijing 100094, China
*
Author to whom correspondence should be addressed.
Remote Sens. 2024, 16(16), 2993; https://doi.org/10.3390/rs16162993
Submission received: 26 July 2024 / Revised: 12 August 2024 / Accepted: 13 August 2024 / Published: 15 August 2024
(This article belongs to the Section Environmental Remote Sensing)

Abstract

:
Urban expansion and fossil fuel dependence have led to energy and environmental concerns, highlighting the need for sustainable solutions. Rooftop photovoltaic (RPV) systems offer a viable solution for urban energy transition by utilizing idle rooftop space and meeting decentralized energy needs. However, due to limited information on building function attributes, detailed assessments of RPV potential at the city scale are still complicated. This study introduces a cost-effective framework that combines big Earth data and deep learning to evaluate RPV potential for various investment entities. We introduced a sample construction strategy that considers built environment and location awareness to improve the effectiveness and generalizability of the framework. Applied to Shanghai, our building function recognition model achieved 88.67%, 88.51%, and 67.18% for accuracy, weighted-F1, and kappa, respectively. We identified a potential installed capacity of 42 GW with annual electricity generation of 17 TWh for industrial and commercial, 16 TWh for residential, and 10 TWh for public RPVs. The levelized cost of electricity ranges from 0.32 to 0.41 CNY/kWh, demonstrating that both user-side and plant-side grid parity was achieved. This study supports sustainable development by providing detailed urban energy assessments and guiding local energy planning. The methods and findings may offer insights for similar studies globally.

1. Introduction

Over the past century, urban expansion and economic development have heavily relied on fossil fuels, leading to energy shortages and environmental concerns [1]. In response to these challenges, countries increasingly focus on sustainable development and have developed corresponding Sustainable Development Goals (SDGs) [2]. Solar photovoltaic (PV) is considered one of the most competitive renewable energy technologies [3], crucial for increasing the share of renewable energy and improving energy affordability. Consequently, it plays a significant role in achieving SDG 7: “Affordable and Clean Energy” [4].
In built-up areas, ground space for further development is limited due to high-intensity land use, making building rooftops ideal for utilizing solar energy resources [5]. Rooftop photovoltaic (RPV) systems can be deployed on various buildings, contributing considerable power generation potential through intensive small-scale installations [6]. Additionally, RPV systems can be directly connected to energy consumers, effectively accommodating the increasingly decentralized energy demand [7]. To support policymakers’ plans for renewable energy utilization and better leverage PV technology for urban sustainable development, it is crucial to conduct detailed geospatial assessments of RPVs’ technical and economic potential.
The decentralized deployment of RPV systems increases the complexity of relevant assessments, with the biggest challenge being the acquisition of detailed building information [8]. Existing studies have created large-scale building footprint data through high-resolution Earth observation, providing precise spatial information on rooftop boundaries [9,10,11]. However, due to the heterogeneity of urban environments and constraints of computational cost, there have been few studies on large-scale extraction of building attribute information (such as structure and function) [12,13], which is insufficient to meet the increasingly refined assessment needs [14]. This limitation particularly prevents providing clear references on RPVs’ technical and economic potential for different investment entities, such as residential and industrial-commercial (I&C) sectors. Therefore, to conduct more detailed assessments of RPV potential and support more targeted energy planning, the key challenge is to further enrich the attribute information based on existing building footprint data.
Currently, big Earth data and artificial intelligence technologies provide strong support for inner-city environment sensing [15,16], offering new opportunities for fine-grained assessments of RPV potential. User-generated content from public map services or social media platforms greatly enriches the attribute features of buildings [17]. However, further exploration is needed to effectively extract attribute information from these publicly available big Earth data and integrate it into existing building datasets. The key challenge lies in expanding the limited distribution of building attribute information across the entire urban space [18]. While integrating deep learning methods for building attribute recognition using remote sensing imagery and user-generated content is expected to provide an efficient solution [19], it is still necessary to strategize the acquisition of more representative samples to reduce input costs and optimize prediction outcomes.
The main objective of this study is to integrate multiple geospatial data sources and utilize deep learning methods to develop a cost-effective and generic framework for assessing the technical and economic potential of RPV deployment by different user entities. During this process, we propose a strategy for constructing training samples based on geospatial features to enhance sample representativeness, thereby improving the generalization and accuracy of the building function recognition model. Taking Shanghai, China, as a case study, this study maps and analyzes the spatial distribution of residential and I&C RPV potential at high resolution. The results demonstrate the effectiveness of the proposed framework and further provide decision support for urban energy transition and sustainable planning.

2. Materials and Methods

The research framework, as shown in Figure 1, consists of two main parts: building function recognition and RPV potential assessment. For building function recognition, the process begins with overlay analysis of open-source building footprint and function data to derive samples of ground truth and samples to be predicted. Surrounding environmental and spatial information is integrated by cropping corresponding remote sensing images at different scales centered on sample building outlines. The deep learning modeling dataset is constructed using the cropped ground truth samples and divided into training, validation, and test datasets via random stratified sampling. Multiple training datasets are created using under-sampling to mitigate imbalances in building functions, which are then used to construct an ensemble deep learning model for identifying functions of building samples to be predicted. For RPV potential assessment, the process begins with determining the rooftop area suitable for PV deployment based on availability assumptions. To assess the technical and economic potentials of RPV, technical parameters, solar radiation, and economic factors are considered. Finally, the spatial distribution patterns of RPV potentials are analyzed to provide insights for future RPV deployment. Section 2.1, Section 2.2 and Section 2.3 elaborate upon the data and methods used in detail.

2.1. Study Area and Data
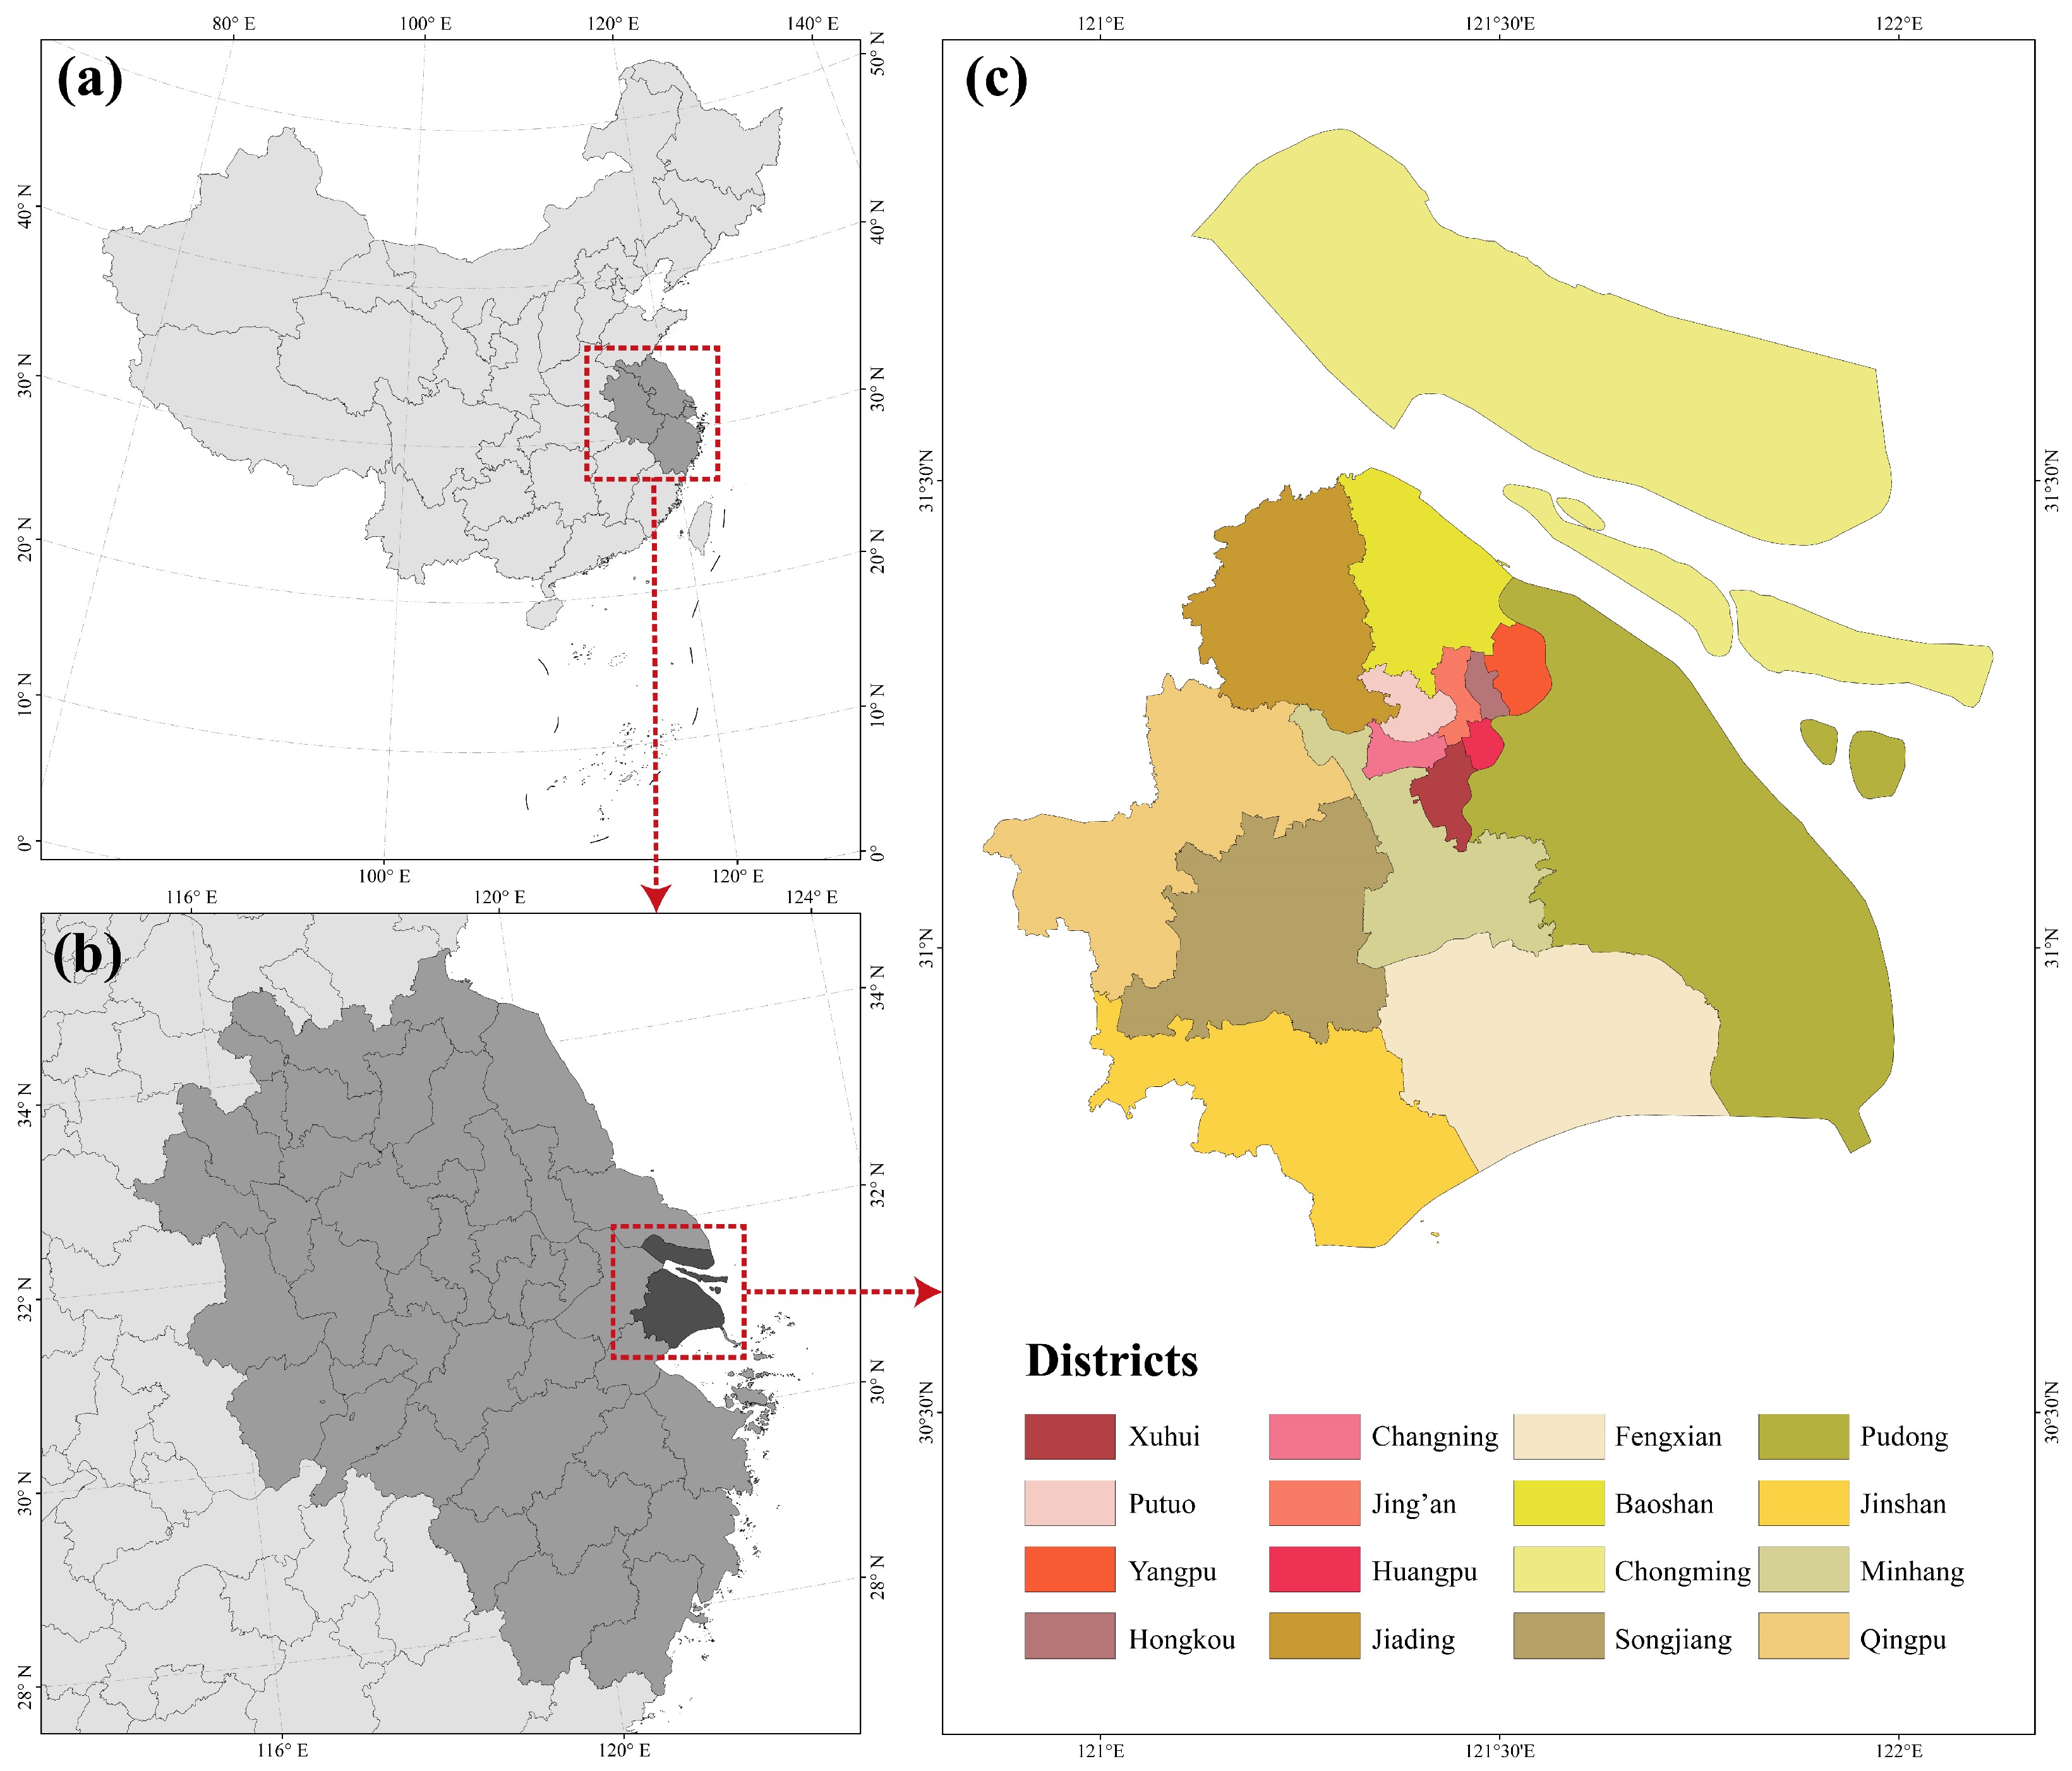
2.1.1. Study Area

The study area is located in Shanghai, China. As one of China’s municipalities, Shanghai is a global finance, trade, and shipping center. As of 2023, Shanghai has 16 districts, with a total area of 6341 km2 and a resident population of 24.87 million (Figure 2) [20]. The city’s rapid economic expansion and high urbanization rate have led to complex spatial structures and diverse urban layouts [21]. In the subtropical humid climate zone along China’s eastern coast, it experiences significant seasonal variations in solar radiation [12]. Characterized by dense building construction, high energy demand, and rich solar resources, Shanghai is a typical region with urgent needs and great potential for a transition to clean energy [22]. Its experience can serve as a valuable reference for sustainable development in similar cities worldwide, making it an ideal study area for this work.

2.1.2. Satellite Imagery

Satellite imagery used in this study was obtained from Google Earth (Figure 3a). Google Earth Satellite (GES) imagery, with its wide coverage, rapid update, and low acquisition cost, has been widely used for geoscience data creation and geospatial knowledge discovery [23]. The GES imagery used in this study has a resolution of approximately 0.6 m/pixel, which enables detailed visualization of building rooftop features, thereby supporting subsequent building function recognition. Users can download GES imagery for Shanghai using Google’s open map service (https://www.google.com/earth, accessed on 15 March 2022). The quality of GES imagery varies with the imaging system, imaging time, and environmental factors. The variation in image quality may interfere with the process of model training and application. Therefore, it is necessary to standardize GES imagery to achieve uniform quality. This study uses gamma correction and contrast limited adaptive histogram equalization (CLAHE) to deal with brightness anomalies and contrast deficiencies in Shanghai’s GES imagery, respectively [7].

2.1.3. Building Footprint

The building footprints in Shanghai are derived from high-quality publicly available vectorized data of rooftops in 90 Chinese cities released in previous work [24]. The dataset was produced based on deep learning semantic segmentation model and high-resolution multi-source remote sensing imagery. It was validated on a total of 180 km2 samples from different regions, with an overall accuracy of 97.95% and an F1 score of 83.11% [10]. Considering the temporal matching of the input data, we obtained an updated version of the dataset from the developer, which was based on the remote sensing images acquired in 2022 (Figure 3b).

2.1.4. Urban Function

The building function attributes were sourced from Baidu Maps’ areas of interest (AOI). AOI data represent areal geographic entities on maps and include at least four basic types of information: name, address, category, and geographic coordinate [25]. These data provide detailed insights into the functions of various urban land uses (Figure 3c). AOI data are advantageous due to their wide coverage, rapid updates, and rich content. The AOI data for Shanghai can be downloaded and extracted through Baidu’s open map service (https://lbsyun.baidu.com/, accessed on 15 October 2022).

2.1.5. Solar Radiation

Surface solar radiation data was obtained from a long-term series of global high-resolution surface solar radiation dataset (July 1983–December 2018) [26]. The dataset has a temporal resolution of 3 h and a spatial resolution of 10 km (Figure 3d). It is generated using improved physical parameterization schemes with inputs from ISCCP-HXG cloud products, ERA5 reanalysis data, and MODIS aerosol and albedo products. Validation and comparison have shown that the accuracy of this dataset is generally higher than that of mainstream global satellite radiation products, such as ISCCP-FD, GEWEX-SRB, and CERES [27].

2.2. Recognition of Building Functions

2.2.1. Pre-Processing for Building Function Recognition

To ensure the quality of the AOI data, pre-processing, including data cleaning and organizing, was performed. Data cleaning involved deleting AOIs with duplicate collections, missing attributes, or unclear pointers (e.g., categories such as entrances and exits, administrative landmarks, and indoor facilities). Data organizing involved adjusting the classification system of the original AOIs based on the classification standards of urban land use and the practical needs of PV assessment. The rules for classifying the functions of buildings in this study are shown in Table 1. We followed a basic but widely accepted classification scheme [28], aggregating the original AOIs into four main categories: commercial, residential, public, and industrial. This classification was used for building function recognition. Due to the similar socioeconomic characteristics of industrial and commercial RPV systems [29], these two categories are further combined as I&C for PV potential assessment.

2.2.2. Construction of Datasets Based on Built Environment and Location Awareness

Recognizing the functional type of a building from satellite imagery relies on both the physical form of the individual building and the surrounding environment (e.g., neighboring buildings and the surrounding landscape). In this study, we expanded outward from the bounding rectangle of individual buildings, clipping image patches of different scales by changing the expansion radius. This approach incorporated more surrounding environmental information into the image patches (Figure 4). When changing the scale of the image patches, neighboring buildings were often included. This can interfere with the deep learning model, making it unclear which building’s category to identify. To address this issue, the study employed a Gaussian kernel function to represent the spatial information of the buildings and adjust the neural network’s attention [30], as shown in Figure 4 and Formula (1).
G ( x , y ) = 1 2 π σ 2 e x 2 + y 2 2 σ 2
There were 350,000 buildings assigned functional attributes by the AOIs, which accounted for about 25% of all buildings. Among the acquired samples, the I&C category (9%) is significantly less than the residential category (79%). The imbalance of sample categories can lead to a noticeable bias in the deep learning recognition model [31]. To address this issue, the study used stratified random sampling to divide sample buildings into training, validation, and test datasets in an 8:1:1 ratio. Additionally, to mitigate the imbalance in functional attributes, we compared two common resampling strategies: over-sampling and under-sampling [32]. Over-sampling increases the number of samples for the underrepresented classes by sampling more data from those classes, while under-sampling reduces the number of samples from the overrepresented classes. To make full use of the available samples, multiple datasets were generated to train an ensemble deep learning model.

2.2.3. Training and Application of Building Function Recognition Model

This study selects residual convolutional neural networks (ResNet) to build the deep learning model for building function recognition. ResNet is a type of deep residual network that has achieved excellent performance on multiple image recognition benchmark datasets and has proven effective in addressing the gradient vanishing problem that arises with increasing network depth [33]. The common ResNet series includes ResNet-50 and ResNet-101; the larger the number, the more complex the network and the greater the computational requirements [33]. Considering both the performance of the network and the time cost of deployment, this study chose ResNet-50 and ResNet-101 for subsequent experiments. By inputting the constructed datasets in Section 2.2.2 into the ResNet networks for training, testing, and validation, we compared models based on different Gaussian kernel function parameters, expansion radius, network frameworks, and sampling methods (see Section 3.1.2). Finally, we obtained models that achieve optimal performance for building function recognition. By applying the optimal models to the imagery of the area to be predicted, the city-wide recognition of building functions was realized.

2.2.4. Performance Evaluation of Building Function Recognition Model

This study used the kappa coefficient and weighted-F1 to evaluate the performance of the building function recognition model. Both kappa and weighted-F1 range from 0 to 1, with higher values indicating better recognition performance. Kappa is a multivariate statistical index based on the confusion matrix to assess recognition accuracy, reflecting the consistency between predictions and true values. The calculation for kappa can be conducted through Formula (2) [34]:
Kappa   = P 0 P e 1 P e
where P 0 represents the observed agreement and P e represents the expected agreement by chance. They can be calculated by Formulas (3) and (4), respectively:
P 0 = i = 1 c   G i i N × 100 %
where c represents the number of categories, G i i represents the number of test samples of category i that are correctly categorized into category i (i = 1, 2, …, c), and N is the total number of samples in the test dataset.
P e = 1 N 2 i = 1 c   j = 1 c   G i j × j = 1 c   G j i
where G i j represents the number of test samples of category i that are categorized into category j, and G j i represents the number of test samples of category j that are categorized into category i.
The F1 score is a common metric to evaluate a model’s performance in binary classification tasks. It is the harmonic mean of precision and recall. Weighted F1 is an extension of the F1 score for multiclassification tasks, where the F1 score for each category is calculated independently. When averaging, it weights the F1 scores according to the number of instances in each category, making it suitable for handling category imbalances. Weighted F1 can be calculated through Formula (5) [35]:
F 1 W e i g h t e d = 2 Precision weighted Recall weighted Precision weighted + Recall weighted
where Precision weighted is the weighted precision of each category and Recall weighted is the weighted recall of each category. They can be calculated through Formulas (6) and (7), respectively:
Precision weighted = i = 1 c   T P i T P i + F P i × w i c
Recall weighted = i = 1 c   T P i T P i + F N i × w i c
where c represents the number of categories. T P i , F P i , and F N i represent the number of true positives, false positives, and false negatives in the recognition results for the ith category, respectively. w i represents the percentage of the ith category.

2.3. Assessment of RPV Potential

2.3.1. Assessment of RPV Technical Potential

The refined building footprint used in this study supports estimating the total rooftop area. However, due to various geographical constraints, only a small portion of the total rooftop area is suitable for RPV installation. Here, we used a conversion factor to transform the total rooftop area into the available rooftop area. The conversion factor accounts for several factors that limit RPV installation, including other uses of the rooftop (e.g., air conditioning units, chimneys), mutual shading between buildings, unfavorable rooftop orientations, and spacing between PV arrays. According to a study of renewable energy availability in 139 countries around the world [36], a rooftop area conversion factor C r o o f t o p of 35%, which applies to China, was used in this study.
To assess the technical potential of RPVs, uniform assumptions were made for the RPV systems involved in this study. Based on a recent literature review [37], the average energy efficiency of RPV systems C s y s t e m was determined to be 0.8. Based on the current technological level of the PV industry [38], the scale of the PV application and the performance parameters were determined, including a panel conversion efficiency C p a n e l of 20% and a power rating P r a t e d of 200 W/m2. Based on these assumptions, the potential installed capacity, C i n s t a l l , was calculated using Formula (8), as follows:
C i n s t a l l = P r a t e d × S × C r o o f t o p
where P r a t e d is the rated power of the PV panel per unit area, S is the total rooftop area, and C r o o f t o p is the conversion factor for calculating the available rooftop area for PV installation.
The solar radiation received by the RPV system, R s o l a r , was calculated using Formula (9), as follows:
R s o l a r = S × C r o o f t o p × G H I
where GHI is the annual global horizontal irradiance received by the RPV system.
The annual power generation, G p o w e r , of the RPV system was estimated using Formula (10):
G p o w e r = R s o l a r × C p a n e l × C s y s t e m
where C p a n e l is the conversion efficiency of the PV panel, C s y s t e m is the overall efficiency of the PV system.

2.3.2. Assessment of RPV Economic Potential

This study evaluated the economic potential of RPVs by focusing on their ability to achieve grid parity, an important indicator of the economic feasibility of renewable energy [39]. Grid parity means that the price of renewable energy is at or lower than that of traditional energy, allowing renewable energy projects to be economically competitive without government subsidies and compete equally with traditional power sources in the power grid [40]. In this study, we defined grid parity as the unsubsidized cost per kWh of electricity generated by RPV systems being less than or equal to the retail or factory cost of grid electricity.
To quantify the selected indicators, we first calculated the levelized cost of electricity (LCOE) for RPV using Formula (11) [39]:
L C O E = C i n i + n = 1 N   C e x p ( 1 + r ) n / n = 1 N   G p o w e r × ( 1 y ) n ( 1 + r ) n
where N is the lifetime of the PV system, assumed to be 20 years. r is the discount rate, assumed to be 8%. y is the decay rate of PV efficiency, assumed to be 0.6% per year. G p o w e r is the amount of electricity generated by the PV system in the initial year. C i n i and C e x p are the initial investment and the annual expenditure of the RPV system, respectively, which can be calculated according to Formulas (12) and (13):
C i n i = P i n i × C i n s t a l l
where P i n i is the initial investment cost per unit of installed capacity for RPVs. For I&C and public RPV systems, this is about 3.38 CNY/W [41]. For residential RPV systems, which do not incur grid connection or primary or secondary equipment costs, it is assumed to be 2.92 CNY/W.
C e x p = P e x p × C i n s t a l l
where P e x p is the operation and maintenance cost of the RPV system per unit of installed capacity, which is about 0.05 CNY/W/year [41].
The grid parity capability of RPVs involves two aspects: user-side grid parity and plant-side grid parity. User-side grid parity refers to the scenario where the cost of PV electricity is equal to or lower than the cost of purchasing electricity from the grid company, making it more cost-effective for users to use PV electricity. Plant-side grid parity refers to the scenario where the cost of PV electricity is equal to or lower than the price at which local coal-fired power plants sell electricity to the grid company, allowing the grid company to profit more from purchasing PV electricity. The user-side grid parity index G P I u and the plant-side grid parity index G P I p were measured by the ratio of LCOE for RPVs to the grid retail electricity price and the benchmark price of desulfurized coal, respectively. These can be calculated using Formulas (14) and (15) [39]:
G P I u = L C O E / M P
G P I p = L C O E / C P
where MP represents the grid retail electricity price. For simplification, we only considered average rates without time-of-use or tiered pricing. The rates were set for different building types: 0.94 CNY/kWh for I&C buildings, 0.62 CNY/kWh for residential buildings, and 0.64 CNY/kWh for public buildings [42]. CP is the benchmark price of desulfurized coal, set at 0.42 CNY/kWh [42]. Values of less than 1 for the grid parity indices mean that grid parity has been achieved, and smaller values mean better RPV economic feasibility.

3. Results

3.1. Building Function Recognition

3.1.1. Experimental Configuration

The experiments were implemented using the PyTorch 2.0 [43] framework on two NVIDIA Tesla V100 GPUs. To determine the appropriate expansion radius for cropping remote sensing images, the expansion radius was set to 0, 25, 50, 75, 100, 125, 150, 175, and 200 m. Due to the varying sizes of buildings, their bounding rectangles and the sizes of the expanded image patches were also inconsistent. To facilitate deep learning model training and prediction, this study performed statistical analysis on the dimensions of images at different scales and fixed the image patches of the same scale to appropriate sizes commonly used in deep learning, as shown in Table 2. The network configuration and training settings during the training phase are detailed in Table 3.

3.1.2. Deep Learning Model Construction and Comparison

To validate the effectiveness of the proposed method and select appropriate hyperparameters, multiple experiments were conducted in this section. First, we tested the integration of spatial prior information about buildings (represented using a Gaussian kernel function) into the image patches. This experiment was based on image patches with an expansion radius of 50 m (224 × 224 pixels)—testing the effectiveness of incorporating spatial prior information of buildings—and selecting the optimal Gaussian kernel function parameters and the method of integrating spatial prior information with image patches. The results are shown in Table 4. The results indicate that incorporating building spatial information into the image patches can improve the accuracy of deep learning recognition, with significant improvements across various metrics. This suggests that explicitly adding spatial information can effectively adjust the deep learning model’s attention, facilitating the recognition of the functional type of specific buildings when the image patch contains multiple buildings.
Additionally, for the Gaussian kernel function, we focused on two key hyperparameters: σ and the transition threshold T. The standard deviation σ in the x and y directions of the image patch was set as a multiple of the expansion radius. The Gaussian kernel function values in this study were normalized to weight values between 0 and 1 (see Figure 4). A value of 0 may suppress the image information, so truncation can be performed when the weights are T (i.e., weights less than T are set to T). For the experiments, σ was set to 0.5, 1, and 2, while T was set to 0, 0.3, 0.5, and 0.7. The building spatial information was added as an additional band to the image (i.e., the image contains four bands of red, green, blue, and building spatial information).
To reduce the time cost of the experiments, we first fixed T and selected the optimal σ. Then, we fixed σ and selected the optimal T. The results showed that the highest recognition accuracy was achieved when σ was set to 1 times the expansion radius and T was set to 0. This indicates that for recognizing building attributes, the surrounding environment information is quite important, while the distant environment information might not be as helpful. Additionally, we tested incorporating spatial information as weights applied to the RGB bands separately, but the results indicated that this approach was less effective compared to adding spatial information as an extra band.
Based on the selected Gaussian kernel function parameters and information superposition methods, this study tested the deep learning recognition accuracy of image patches with different expansion radius. The results are shown in Table 5. When the expansion radius was 100 m, the recognition accuracy was the highest. Accuracy decreased when the expansion radius was either less than or more than 100 m. This indicates the importance of incorporating the surrounding environment of buildings through the expansion radius for determining building functional type. It also suggests that an excessively large expansion radius may introduce additional interference, causing negative effects on deep learning inference.
To address the imbalance in building functional types, we tested several methods. Given that this experiment involved more complex models and bigger datasets, we increased the number of training epochs to three times that of the previous experiments, totaling 36 epochs. Based on the optimal parameters from the previous experiments, we first replaced ResNet-50 with the more complex ResNet-101, hoping that this neural network could extract more complex feature information from the images. However, the results showed that the overall accuracy of ResNet-101 was lower than that of Res-Net50 (Table 6). Although ResNet-101 outperformed ResNet-50 in predicting commercial types (Table 7), its accuracy was still insufficient.
Therefore, we introduced over-sampling and under-sampling strategies to augment the training datasets. Here, over-sampling refers to increasing the number of instances in the minority class to match or approximate the number of instances in the majority class, while under-sampling indicates reducing the number of instances in the majority class to balance it with the minority class. Both methods improved the performance of the imbalanced samples, achieving similar results to ResNet-101 for different categories. Since the training dataset for under-sampling was lighter than that for over-sampling (approximately 60,000 image patches for the former and 1.1 million for the latter), we performed multiple rounds of under-sampling to generate multiple training datasets. We then trained multiple ResNet-50 models separately and combined their decision results through voting. We found that the accuracy was highest when 25 models were ensembled, and the accuracy gradually plateaued when the number of models exceeded 25 (Figure 5). This method achieved higher overall accuracy than the initial ResNet-50, with significant improvements in predicting commercial and industrial categories (Table 7).
The physical features of commercial and industrial buildings in remote sensing images have relatively low distinguishability. In particular, industrial and commercial functions can coexist in some industrial parks, further blurring their boundaries. Combining industrial and commercial buildings can simplify the model and reduce the number of categories, lowering the recognition difficulty and improving the model’s stability and accuracy. Additionally, in energy management scenarios, the power generation costs for industrial and commercial buildings are similar, merging these two categories helps simplify analysis and decision-making processes [39]. Therefore, this study merges the industrial and commercial building categories into I&C. After merging, the recognition performance was as follows: accuracy of 88.67%, weighted F1 of 88.51%, kappa of 67.18%; additionally, the F1 score for the I&C category is 65.23%.

3.1.3. Building Function Distribution Analysis

The total rooftop area in Shanghai is 605 km2, with residential buildings accounting for 37% (224 km2), I&C buildings accounting for 41% (246 km2), and public buildings accounting for 22% (135 km2). The spatial distribution of building functions varies significantly due to the impact of geographic conditions on urban development, resulting in a landscape gradient from the city center to the periphery (Figure 6). Specifically, in the city center (Huangpu, Xuhui, Changning, Jing’an, Putuo, Hongkou, and Yangpu Districts), residential buildings are more densely distributed, making up about 61% of the total building area in this region. Conversely, in the city periphery (Baoshan, Jiading, Minhang, Songjiang, Qingpu, Fengxian, Jinshan, Chongming, and Pudong Districts), residential buildings are more dispersed, accounting for only 35%.
In addition, for the city center and periphery, I&C buildings account for 24% and 42%, respectively. This disparity arises because commercial buildings tend to cluster at multiple points within the city center. Still, their total area remains relatively small due to intensive land use and high land prices. In contrast, industrial buildings require more land and are typically found on the city’s outskirts to reduce costs. Public buildings account for a slightly higher proportion in the city periphery (23%) than the city center (15%) due to the broader distribution of cultural, tourism, and educational land use in suburban areas. Overall, the recognition results of this study align with the general land use patterns of urban development. It also shows that the proposed method can be quickly generalized at a city scale and performs well in districts with different characteristics. When it is to be extended to other cities, we suggest fine-tuning the existing model by adding new feature samples to enhance its applicability in the target city.

3.2. RPV Potential Assessment

3.2.1. RPV Technical Potential Assessment

The conversion of the total rooftop area to the available rooftop area was implemented through the rooftop area conversion factor, which considers multiple geographic constraints including orientation, shadows, shading, etc. (see Section 2.3.1). The total rooftop area available for PV deployment in Shanghai is 212 km2, representing a potential installed capacity of 42 GW and an annual electricity generation potential of 43 TWh. Among these, the annual electricity generation potential for I&C, residential, and public rooftops is 17, 16, and 10 TWh, respectively. In 2020, the total electricity consumption in Shanghai was 158 TWh, with 26 TWh for urban and rural residential use, 78 TWh for the secondary industry, and 53 TWh for the tertiary industry [44]. This suggests that about 27% of the city’s electricity consumption could be met if the full potential of RPVs is exploited. Specifically, for I&C and public buildings across the city, RPV electricity generation is expected to meet over 20% of their energy demand. For residential buildings, the figure is even above 60%. These results demonstrate the significant energy benefits of utilizing urban rooftop spaces for PV installations.
Figure 7 shows the detailed scale of RPV installed and electricity generation potential in Shanghai. A certain number of buildings (accounting for about 9% of the total building area) have an installed potential exceeding 1 MW. These buildings, suitable for large-scale RPV deployment, have a total installed potential of up to 4 GW. Most of them are I&C (87%), with smaller portions being public (12%) and residential (1%). Spatially, these high-potential buildings are predominantly located in the city’s peripheral areas (98%).

3.2.2. RPV Economic Potential Assessment

Evaluation results show that the average LCOE for RPVs in Shanghai is 0.36 CNY/kWh. However, the LCOE varies across districts and building types, ranging from 0.32 to 0.41 CNY/kWh. Specifically, the average LCOE for residential, I&C, and public buildings is 0.34, 0.38, and 0.38 CNY/kWh, respectively. Given a constant initial investment cost, the LCOE is mainly influenced by regional radiation conditions. Figure 8 shows the detailed LCOE distribution for RPVs. The LCOE for residential RPV systems ranges from 0.32 to 0.36 CNY/kWh, while that for I&C and public buildings ranges from 0.36 to 0.41 CNY/kWh.
In the past, feed-in tariff subsidies have been the main economic driver for RPV deployment in most regions [45]. However, our analysis indicates that buildings with different functions in Shanghai can achieve grid parity on both user-side and plant-side without subsidies in 2020. The average user-side grid parity index in Shanghai is 0.53, while the plant-side grid parity index is 0.85. User-side grid parity means that RPV systems are more economically attractive to end-users, which will facilitate the widespread adoption of distributed PV systems. Plant-side grid parity indicates that RPVs can compete with traditional power generation approaches, which will support the green transition of local power structures. Achieving both user-side and plant-side grid parity demonstrates that Shanghai has the potential to develop RPV extensively and gain multiple benefits in terms of energy, economy, and society.
Specifically, the average user-side grid parity index ( G P I u ) values for residential, I&C, and public buildings are 0.54, 0.40, and 0.59 CNY/kWh, respectively. The G P I u is determined by both the LCOE of RPVs and the retail price of grid electricity. Due to the higher electricity prices for I&C and public buildings, their grid parity capability is more prominent under similar solar radiation conditions. Figure 9a shows the detailed distribution of G P I u . For residential, I&C, and public RPVs, G P I u ranges from 0.52 to 0.58 CNY/kWh, 0.39 to 0.44 CNY/kWh, and 0.57 to 0.64 CNY/kWh, respectively. The average plant-side grid parity index ( G P I p ) values for residential, I&C, and public buildings are 0.80, 0.90, and 0.90 CNY/kWh, respectively. The G P I p is determined by both the LCOE of RPVs and the coal benchmark electricity price. Figure 9b shows the detailed distribution of G P I p . For residential, I&C, and public RPVs, G P I p ranges from 0.77 to 0.86 CNY/kWh, 0.39 to 0.44 CNY/kWh, and 0.39 to 0.44 CNY/kWh, respectively.

4. Discussion

4.1. Exploitation of Theoretical Potential

This study utilized multi-source geospatial data and deep learning methods to recognize the functions of urban buildings, quantifying the technical and economic potential of RPVs for residential, I&C, and public buildings. This provides strong support for detailed energy assessments at the city scale and could inspire similar work in developing countries lacking available and reliable urban information. Although this work focuses on evaluating the theoretical potential of RPV systems, it provides decision-making references for more targeted energy planning in practice.
Firstly, this study considers solar radiation conditions and the available rooftop area for PV installation, clarifying the spatial differences in resource distribution within the city. This provides policymakers with theoretical references for devising appropriate plans to determine the installation locations of RPV systems to maximize potential energy and economic benefits. For example, identifying and prioritizing I&C buildings with potential installed capacity exceeding 1 MW can facilitate the rapid deployment of PV systems and promote economies of scale.
Secondly, this study categorizes buildings by different functions, clarifying the potential benefits different user entities can obtain from developing RPVs and providing detailed spatial references. Given the significant variations in energy costs and demands among residential, I&C, and public buildings, this study supports future efforts to better match the supply and demand of RPV electricity under varying geographical and economic conditions across regions. It also aids in the implementation of more targeted fiscal policies for renewable energy.
Finally, our findings indicate that RPVs are already economically attractive without feed-in tariff subsidies for residential, I&C, and public buildings in Shanghai and have achieved grid parity. In the future, as the investment cost of RPV systems continues to decrease, the impact of regional solar radiation differences on the LCOE of RPVs will gradually deepen. Our data and methods provide a pathway for investors and policymakers to better consider these differences at a detailed scale, identify cost-optimal locations, and develop policy measures accordingly.

4.2. Limitations and Uncertainties

The method of building function recognition proposed in this study was based on single types (including I&C, residential, and public). The current recognition results do not consider the mixed functions of buildings, only considering the dominant functional type of individual buildings based on AOI. This limitation led to some uncertainties in the results. Identifying mixed functions of buildings is a more complex task [46]. In the future, incorporating multiple spatial data sources such as social media data and street view images may provide a comprehensive and multidimensional perspective to better sense building functions [47].
When assessing the receivable solar radiation, we did not consider the effect of building height and rooftop morphology due to the lack of 3D urban information. Including these parameters in future studies would help better identify the factors affecting the energy potential of each building type and assist in designing corresponding development plans [48]. Additionally, the assessments utilized multi-year average solar radiation without considering the impact of short-term solar radiation fluctuations on PV electricity generation. Using solar radiation data with higher temporal resolution in future studies would help optimize the supply-demand balance of RPV systems across different types of buildings [49]. Although the currently applied rooftop availability conversion factor considers multiple geographical constraints, it quantifies the nationwide average. Exploring differences in rooftop availability at the city level is also critical for future studies.
The RPV electricity generation potential in this study represents a theoretical value under assumed conditions. More factors need to be analyzed for actual installation and operation. For instance, it is necessary to learn the systemic impact of increased PV penetration on grid stability and electricity prices from both technical and economic perspectives. Notably, to fully exploit the potential of RPVs, future studies need to further explore how to improve the flexibility of RPV power generation. For example, combining RPV systems with energy storage technologies or promoting complementarity between renewable energy sources. Additionally, evaluating different economic scenarios (such as changes in electricity price structures and adjustments to additional taxes and fees) is crucial to uncover the potential opportunities and threats for future RPV development.

5. Conclusions

In this study, we developed a low-cost and generic framework by integrating big Earth data and deep learning method to conduct detailed assessments of RPV potential at the city scale. Meanwhile, we proposed a sample construction strategy considering geospatial characteristics to improve the generalizability and accuracy of the deep learning building function recognition model. In Shanghai, the proposed strategy effectively optimized building function recognition and addressed sample imbalances. The accuracy, weighted F1, and kappa for building function recognition were 88.67%, 88.51%, and 67.18%, respectively. In 2020, we identified a total RPV installed potential of 42 GW, representing annual electricity generation potentials of 17, 16, and 10 TWh for I&C, residential, and public buildings, respectively. Moreover, the LCOE of RPVs without subsidy ranges from 0.32 to 0.41 CNY/kWh, depending on the geographical location and function of the buildings. This indicates that RPVs in Shanghai have achieved grid parity on both the user and the plant sides.
While applying our framework in Shanghai, challenges such as data quality and alignment with local policies highlighted the need for adaptability and stakeholder collaboration. These experiences underscored the importance of iterative refinement to meet local needs while advancing broader SDGs. Our assessments significantly contribute to SDG 7 by enhancing solar energy deployment, support SDGs 9 and 11 through improved urban planning, and advance SDG 13 by promoting sustainable energy consumption and mitigating carbon emissions. Overall, the methods, data, and results provided offer support for fostering sustainable urban development and may serve as a reference for similar efforts in other regions.

Author Contributions

Conceptualization, Z.Z., Y.P. and M.C.; data curation, Z.Z. and Z.S.; formal analysis, Z.Z. and Z.S.; funding acquisition, Y.P. and M.C.; investigation, Z.Z. and Z.S.; methodology, Z.Z. and Z.Q.; project administration, Y.P.; resources, Z.Z. and Z.S.; supervision, Y.P.; validation, Z.Z. and Z.Q.; visualization, Z.Z.; writing—original draft, Z.Z.; writing—review and editing, Z.Z., Y.P., Z.S. and Z.Q. All authors have read and agreed to the published version of the manuscript.

Funding

This study was funded by the International Research Center of Big Data for Sustainable Development Goals (CBAS2022GSP08) and the National Natural Science Foundation of China (42371435, 41771029).

Data Availability Statement

The data sources that are free to use are provided in the “Materials and Methods” section. The data that support the findings of this study are available from the corresponding author upon reasonable request.

Conflicts of Interest

Given the roles as Remote Sensing Special Issue Editor, Min Chen was not involved in the peer review of this article and had no access to information regarding its peer review. Full responsibility for the editorial process for this article was delegated to other editors. The authors declare that they have no known competing financial interests or personal relationships that could have appeared to influence the work reported in this paper.

References

  1. Heubaum, H.; Biermann, F. Integrating global energy and climate governance: The changing role of the International Energy Agency. Energy Policy 2015, 87, 229–239. [Google Scholar] [CrossRef]
  2. Gielen, D.; Boshell, F.; Saygin, D.; Bazilian, M.D.; Wagner, N.; Gorini, R. The role of renewable energy in the global energy transformation. Energy Strategy Rev. 2019, 24, 38–50. [Google Scholar] [CrossRef]
  3. Kabir, E.; Kumar, P.; Kumar, S.; Adelodun, A.A.; Kim, K.-H. Solar energy: Potential and future prospects. Renew. Sustain. Energy Rev. 2018, 82, 894–900. [Google Scholar] [CrossRef]
  4. McCollum, D.; Gomez Echeverri, L.; Riahi, K.; Parkinson, S. Sdg7: Ensure Access to Affordable, Reliable, Sustainable and Modern Energy for All. 2017. Available online: https://pure.iiasa.ac.at/id/eprint/14621/1/SDGs-interactions-7-clean-energy.pdf (accessed on 20 May 2023).
  5. Xie, H.; Zhang, C.; Hao, B.; Liu, S.; Zou, K. Review of solar obligations in China. Renew. Sustain. Energy Rev. 2012, 16, 113–122. [Google Scholar] [CrossRef]
  6. Bódis, K.; Kougias, I.; Jäger-Waldau, A.; Taylor, N.; Szabó, S. A high-resolution geospatial assessment of the rooftop solar photovoltaic potential in the European Union. Renew. Sustain. Energy Rev. 2019, 114, 109309. [Google Scholar] [CrossRef]
  7. Zhong, T.; Zhang, Z.; Chen, M.; Zhang, K.; Zhou, Z.; Zhu, R.; Wang, Y.; Lü, G.; Yan, J. A city-scale estimation of rooftop solar photovoltaic potential based on deep learning. Appl. Energy 2021, 298, 117132. [Google Scholar] [CrossRef]
  8. Zhang, Z.; Chen, M.; Zhong, T.; Zhu, R.; Qian, Z.; Zhang, F.; Yang, Y.; Zhang, K.; Santi, P.; Wang, K.; et al. Carbon mitigation potential afforded by rooftop photovoltaic in China. Nat. Commun. 2023, 14, 2347. [Google Scholar] [CrossRef]
  9. Brovelli, M.A.; Zamboni, G. A new method for the assessment of spatial accuracy and completeness of OpenStreetMap building footprints. ISPRS Int. J. Geo-Inf. 2018, 7, 289. [Google Scholar] [CrossRef]
  10. Zhang, Z.; Qian, Z.; Zhong, T.; Chen, M.; Zhang, K.; Yang, Y.; Zhu, R.; Zhang, F.; Zhang, H.; Zhou, F.; et al. Vectorized rooftop area data for 90 cities in China. Sci. Data 2022, 9, 66. [Google Scholar] [CrossRef]
  11. Esch, T.; Brzoska, E.; Dech, S.; Leutner, B.; Palacios-Lopez, D.; Metz-Marconcini, A.; Marconcini, M.; Roth, A.; Zeidler, J. World Settlement Footprint 3D-A first three-dimensional survey of the global building stock. Remote Sens. Environ. 2022, 270, 112877. [Google Scholar] [CrossRef]
  12. Qian, Z.; Chen, M.; Sun, Z.; Zhang, F.; Xu, Q.; Guo, J.; Xie, Z.; Zhang, Z. Simultaneous extraction of spatial and attributional building information across large-scale urban landscapes from high-resolution satellite imagery. Sustain. Cities Soc. 2024, 106, 105393. [Google Scholar] [CrossRef]
  13. Qian, Z.; Chen, M.; Zhong, T.; Zhang, F.; Zhu, R.; Zhang, Z.; Zhang, K.; Sun, Z.; Lü, G. Deep Roof Refiner: A detail-oriented deep learning network for refined delineation of roof structure lines using satellite imagery. Int. J. Appl. Earth Obs. Geoinf. 2022, 107, 102680. [Google Scholar] [CrossRef]
  14. Gernaat, D.E.; de Boer, H.-S.; Dammeier, L.C.; van Vuuren, D.P. The role of residential rooftop photovoltaic in long-term energy and climate scenarios. Appl. Energy 2020, 279, 115705. [Google Scholar] [CrossRef]
  15. Cao, R.; Tu, W.; Yang, C.; Li, Q.; Liu, J.; Zhu, J.; Zhang, Q.; Li, Q.; Qiu, G. Deep learning-based remote and social sensing data fusion for urban region function recognition. ISPRS J. Photogramm. Remote Sens. 2020, 163, 82–97. [Google Scholar] [CrossRef]
  16. Neupane, B.; Horanont, T.; Aryal, J. Deep learning-based semantic segmentation of urban features in satellite images: A review and meta-analysis. Remote Sens. 2021, 13, 808. [Google Scholar] [CrossRef]
  17. Qian, J.; Liu, Z.; Du, Y.; Liang, F.; Yi, J.; Ma, T.; Pei, T. Quantify city-level dynamic functions across China using social media and POIs data. Comput. Environ. Urban Syst. 2021, 85, 101552. [Google Scholar] [CrossRef]
  18. Psyllidis, A.; Gao, S.; Hu, Y.; Kim, E.K.; McKenzie, G.; Purves, R.; Yuan, M.; Andris, C. Points of Interest (POI): A commentary on the state of the art, challenges, and prospects for the future. Comput. Urban Sci. 2022, 2, 20. [Google Scholar] [CrossRef]
  19. Qian, Z.; Liu, X.; Tao, F.; Zhou, T. Identification of urban functional areas by coupling satellite images and taxi GPS trajectories. Remote Sens. 2020, 12, 2449. [Google Scholar] [CrossRef]
  20. Shanghai Municipal Bureau of Statistics. Shanghai Statistical Yearbook; Shanghai Municipal Bureau of Statistics: Shanghai, China, 2023.
  21. Cui, X.; Wang, X. Urban land use change and its effect on social metabolism: An empirical study in Shanghai. Habitat Int. 2015, 49, 251–259. [Google Scholar] [CrossRef]
  22. Chen, Z.; Yu, B.; Li, Y.; Wu, Q.; Wu, B.; Huang, Y.; Wu, S.; Yu, S.; Mao, W.; Zhao, F.; et al. Assessing the potential and utilization of solar energy at the building-scale in Shanghai. Sustain. Cities Soc. 2022, 82, 103917. [Google Scholar] [CrossRef]
  23. Liang, J.; Gong, J.; Li, W. Applications and impacts of Google Earth: A decadal review (2006–2016). ISPRS J. Photogramm. Remote Sens. 2018, 146, 91–107. [Google Scholar] [CrossRef]
  24. Nanjing Normal University Lab of Smart City Sensing Simulation. Vectorized Rooftop Area Data for 90 Cities in China (2020); National Tibetan Plateau Data Center: Beijing, China, 2021. [Google Scholar]
  25. Hu, Y.; Gao, S.; Janowicz, K.; Yu, B.; Li, W.; Prasad, S. Extracting and understanding urban areas of interest using geotagged photos. Comput. Environ. Urban Syst. 2015, 54, 240–254. [Google Scholar] [CrossRef]
  26. Wenjun, T. Dataset of High-Resolution (3 hour, 10 km) Global Surface Solar Radiation (1983–2018); National Tibetan Plateau Data Center: Beijing, China, 2019. [Google Scholar]
  27. Tang, W.; Yang, K.; Qin, J.; Li, X.; Niu, X. A 16-year dataset (2000–2015) of high-resolution (3 h, 10 km) global surface solar radiation. Earth Syst. Sci. Data 2019, 11, 1905–1915. [Google Scholar] [CrossRef]
  28. Hoffmann, E.J.; Wang, Y.; Werner, M.; Kang, J.; Zhu, X.X. Model fusion for building type classification from aerial and street view images. Remote Sens. 2019, 11, 1259. [Google Scholar] [CrossRef]
  29. Xin-gang, Z.; Yi-min, X. The economic performance of industrial and commercial rooftop photovoltaic in China. Energy 2019, 187, 115961. [Google Scholar] [CrossRef]
  30. Tang, Y.; Guo, W.; Gao, J. Efficient model selection for Support Vector Machine with Gaussian kernel function. In Proceedings of the 2009 IEEE Symposium on Computational Intelligence and Data Mining, Nashville, TN, USA, 30 March–2 April 2009; pp. 40–45. [Google Scholar]
  31. Chen, Z.; Duan, J.; Kang, L.; Qiu, G. Class-imbalanced deep learning via a class-balanced ensemble. IEEE Trans. Neural Netw. Learn. Syst. 2021, 33, 5626–5640. [Google Scholar] [CrossRef]
  32. Mohammed, R.; Rawashdeh, J.; Abdullah, M. Machine learning with oversampling and undersampling techniques: Overview study and experimental results. In Proceedings of the 2020 11th International Conference on Information and Communication Systems (ICICS), Irbid, Jordan, 7–9 April 2020; pp. 243–248. [Google Scholar]
  33. He, K.; Zhang, X.; Ren, S.; Sun, J. Deep Residual Learning for Image Recognition. In Proceedings of the IEEE Conference on Computer Vision and Pattern Recognition, Las Vegas, NV, USA, 26 June–1 July 2016; pp. 770–778. [Google Scholar]
  34. Carletta, J. Assessing agreement on classification tasks: The kappa statistic. arXiv 1996, arXiv:cmp-lg/9602004. [Google Scholar]
  35. Carvalho, F.; Guedes, G.P. TF-IDFC-RF: A novel supervised term weighting scheme. arXiv 2020, arXiv:2003.07193. [Google Scholar]
  36. Jacobson, M.Z.; Delucchi, M.A.; Bauer, Z.A.F.; Goodman, S.C.; Chapman, W.E.; Cameron, M.A.; Bozonnat, C.; Chobadi, L.; Clonts, H.A.; Enevoldsen, P.; et al. 100% clean and renewable wind, water, and sunlight all-sector energy roadmaps for 139 countries of the world. Joule 2017, 1, 108–121. [Google Scholar] [CrossRef]
  37. Wang, M.; Mao, X.; Gao, Y.; He, F. Potential of carbon emission reduction and financial feasibility of urban rooftop photovoltaic power generation in Beijing. J. Clean. Prod. 2018, 203, 1119–1131. [Google Scholar] [CrossRef]
  38. Yingli Solar. YGE 60 Cell Series 2. Proven Performance and Versatility; Yingli Solar: Baoding, China, 2017. [Google Scholar]
  39. Yan, J.; Yang, Y.; Elia Campana, P.; He, J. City-level analysis of subsidy-free solar photovoltaic electricity price, profits and grid parity in China. Nat. Energy 2019, 4, 709–717. [Google Scholar] [CrossRef]
  40. Yang, C.-J. Reconsidering solar grid parity. Energy Policy 2010, 38, 3270–3273. [Google Scholar] [CrossRef]
  41. China Photovoltaic Industry Association. The Development Roadmap of China’s Photovoltaic Industry; China Photovoltaic Industry Association: Beijing, China, 2020. [Google Scholar]
  42. Shanghai Municipal Development & Reform Commission. Notice on Transmitting the Circular of the National Development and REFORM Commission on Further Deepening the Market-Based Reform of Feed-In Tariffs for Coal-Fired Power Generation; Shanghai Municipal Development & Reform Commission: Shanghai, China, 2021.
  43. Paszke, A.; Gross, S.; Massa, F.; Lerer, A.; Bradbury, J.; Chanan, G.; Killeen, T.; Lin, Z.; Gimelshein, N.; Antiga, L.; et al. Pytorch: An imperative style, high-performance deep learning library. Adv. Neural Inf. Process. Syst. 2019, 32, 8026–8037. [Google Scholar]
  44. Shanghai Municipal Commission of Economy and Informatization. Shanghai Power Operation in December 2020; Shanghai Municipal Commission of Economy and Informatization: Shanghai, China, 2020.
  45. Ye, L.-C.; Rodrigues, J.F.; Lin, H.X. Analysis of feed-in tariff policies for solar photovoltaic in China 2011–2016. Appl. Energy 2017, 203, 496–505. [Google Scholar] [CrossRef]
  46. Li, Y.; Liu, C.; Li, Y. Identification of urban functional areas and their mixing degree using point of interest analyses. Land 2022, 11, 996. [Google Scholar] [CrossRef]
  47. Ye, C.; Zhang, F.; Mu, L.; Gao, Y.; Liu, Y. Urban function recognition by integrating social media and street-level imagery. Environ. Plan. B Urban Anal. City Sci. 2021, 48, 1430–1444. [Google Scholar] [CrossRef]
  48. Li, H.X.; Zhang, Y.; Edwards, D.; Hosseini, M.R. Improving the energy production of roof-top solar PV systems through roof design. In Building Simulation; Springer: Berlin/Heidelberg, Germany, 2020; pp. 475–487. [Google Scholar]
  49. Walch, A.; Castello, R.; Mohajeri, N.; Scartezzini, J.-L. Big data mining for the estimation of hourly rooftop photovoltaic potential and its uncertainty. Appl. Energy 2020, 262, 114404. [Google Scholar] [CrossRef]
Figure 1. Overall research framework.
Remotesensing 16 02993 g001
Figure 2. Study area. (a) China, (b) Yangtze River Delta, (c) Shanghai.
Remotesensing 16 02993 g002
Figure 3. Main data sources. (a) Satellite imagery, (b) building footprint, (c) urban function, (d) solar radiation.
Remotesensing 16 02993 g003
Figure 4. Multi-scale imagery and representation of building spatial information.
Remotesensing 16 02993 g004
Figure 5. Quantity–performance curve for ensemble model.
Remotesensing 16 02993 g005
Figure 6. Distribution of building functions in Shanghai. Results for (a) the entire city, (b) the city center, and (c) local details.
Remotesensing 16 02993 g006
Figure 7. Distribution of RPV’s technical potential in Shanghai. (a) Potential installed capacity, (b) potential electricity generation.
Remotesensing 16 02993 g007
Figure 8. Distribution of LCOE for RPVs in Shanghai. Results for (a) the entire city, (b) the city center, and (c) local details.
Remotesensing 16 02993 g008
Figure 9. Distribution of RPV’s economic potential in Shanghai. (a) User-side grid parity index, (b) plant-side grid parity index.
Remotesensing 16 02993 g009
Table 1. Classification scheme for building functions.
Building Functional TypesAOI Classes
ResidentialHouse, apartment, dormitory
IndustrialWarehouse, factory, industrial park
CommercialHotel, retail store, restaurant, commercial training institute, bank, recreation service, pharmacy, auto service, office, financial center, law office
PublicGovernment, school, university, hospital, museum, TV station, radio station, nonprofit organization
Table 2. Setting of the image scale.
Image Cropping SettingsImage Raw Size Statistics
(Mean ± Standard Deviation, Pixels)
Image Size after Scaling (Pixels)
Building outer rectangleWidth: 44.74 (±40.00) Height: 33.56 (±31.20)64 × 64
Expansion radius of 25 mWidth: 128.08 (±40.00) Height: 116.89 (±31.20)128 × 128
Expansion radius of 50 mWidth: 211.41 (±40.00) Height: 200.22 (±31.20)224 × 224
Expansion radius of 75 mWidth: 294.74 (±40.00) Height: 283.56 (±31.20)256 × 256
Expansion radius of 100 mWidth: 378.08 (±40.00) Height: 366.89 (±31.20)384 × 384
Expansion radius of 125 mWidth: 461.41 (±40.00) Height: 450.22 (±31.20)448 × 448
Expansion radius of 150 mWidth: 544.74 (±40.00) Height: 533.56 (±31.20)512 × 512
Expansion radius of 175 mWidth: 628.08 (±40.00) Height: 616.89 (±31.20)640 × 640
Expansion radius of 200 mWidth: 711.41 (±40.00) Height: 700.22 (±31.20)768 × 768
Table 3. Details of experiment configuration.
ItemBatch SizeOptimizerLearning RateWeight DecayLoss Function
Configuration64 per GPUAdamW0.010.0001Cross entropy
Table 4. Parameter settings of the Gaussian kernel function.
Parameter SettingsAccuracy (%)Weighted-F1 (%)Kappa (%)
Without spatial prior information85.5184.9156.80
σ: 0.5 × radius T: 0
Integration method: stack
85.7984.6656.61
σ: 1 × radius T: 0
Integration method: stack
86.5485.8660.10
σ: 2 × radius T: 0
Integration method: stack
86.5985.2657.68
σ: 1 × radius T: 0.3
Integration method: stack
84.9783.6453.25
σ: 1 × radius T: 0.5
Integration method: stack
86.0584.7155.72
σ: 1 × radius T: 0.7
Integration method: stack
86.7985.0258.12
σ: 1 × radius T: 0
Integration method: map
85.7985.1658.29
Table 5. Parameter settings for expansion radius.
Expansion Radius (m)Accuracy (%)Weighted-F1(%)Kappa (%)
080.9776.31%26.48
2585.0184.03%54.44
5086.7586.21%61.98
7586.7086.76%63.96
10087.8187.25%64.13
12587.2886.65%61.71
15087.6686.87%62.61
17586.8886.07%61.17
20085.9686.02%61.40
Table 6. Performance comparison of different deep learning methods.
Deep Learning MethodsAccuracyWeighted-F1Kappa
ResNet-5087.52%86.82%64.35%
ResNet-10187.16%86.51%61.43%
ResNet-50 with over-sampling83.09%84.63%57.74%
ResNet-50 with under-sampling83.82%84.43%56.08%
ResNet-50 ensembles with under-sampling87.58%87.57%64.51%
Table 7. Comparison of different deep learning methods for mitigating category imbalance.
Deep Learning MethodsF1 Score
(Residential)
F1 Score
(Public)
F1 Score
(Commercial)
F1 Score
(Industrial)
ResNet-5095.17%65.06%23.89%61.37%
ResNet-10194.62%61.33%35.46%61.87%
ResNet-50 with over-sampling92.58%60.75%34.59%58.69%
ResNet-50 with under-sampling93.55%51.54%36.06%59.45%
ResNet-50 ensembles with under-sampling94.89%63.59%42.12%68.19%
Disclaimer/Publisher’s Note: The statements, opinions and data contained in all publications are solely those of the individual author(s) and contributor(s) and not of MDPI and/or the editor(s). MDPI and/or the editor(s) disclaim responsibility for any injury to people or property resulting from any ideas, methods, instructions or products referred to in the content.

