Daxin County
Appearance
Daxin County
大新县 · Dasinh Yen | |
|---|---|
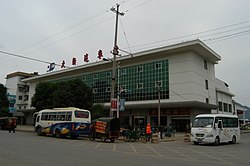
 Daxin County bus terminal | |
| Coordinates: 22°50′10″N 107°11′59″E / 22.83611°N 107.19972°E | |
| Country | China |
| Autonomous region | Guangxi |
| Prefecture-level city | Chongzuo |
| County seat | Taocheng |
| Area | |
• Total | 2,756 km2 (1,064 sq mi) |
| Population (2020) | |
• Total | 282,563 |
| • Density | 100/km2 (270/sq mi) |
| Time zone | UTC+8 (China Standard) |
| Website | www |
Daxin County (simplified Chinese: 大新县; traditional Chinese: 大新縣; pinyin: Dàxīn Xiàn, Zhuang: Dasinh Yen) is a county in the west of Guangxi Zhuang Autonomous Region, China. It is under the administration of Chongzuo city.
The southwest border of Daxin County is along Cao Bằng Province, Vietnam. The legal description is mainly determined for a part of its length by the midline of the watercourse along the Guichun River and its Detian Falls.
Administrative divisions
[edit]Daxin County is divided into 5 towns and 9 townships:[1]
- towns
- Taocheng 桃城镇
- Quanming 全茗镇
- Leiping 雷平镇
- Shuolong 硕龙镇
- Xialei 下雷镇
- townships
- Wushan 五山乡
- Longmen 龙门乡
- Changming 昌明乡
- Fulong 福隆乡
- Naling 那岭乡
- Encheng 恩城乡
- Lanwei 榄圩乡
- Baoxu 宝圩乡
- Kanxu 堪圩乡
Climate
[edit]| Climate data for Daxin (1991−2020 normals, extremes 1981–2010) | |||||||||||||
|---|---|---|---|---|---|---|---|---|---|---|---|---|---|
| Month | Jan | Feb | Mar | Apr | May | Jun | Jul | Aug | Sep | Oct | Nov | Dec | Year |
| Record high °C (°F) | 29.7 (85.5) |
35.3 (95.5) |
35.6 (96.1) |
38.5 (101.3) |
39.0 (102.2) |
38.0 (100.4) |
37.9 (100.2) |
39.3 (102.7) |
37.2 (99.0) |
34.9 (94.8) |
32.4 (90.3) |
30.0 (86.0) |
39.3 (102.7) |
| Mean daily maximum °C (°F) | 17.3 (63.1) |
19.6 (67.3) |
22.3 (72.1) |
27.5 (81.5) |
30.9 (87.6) |
32.2 (90.0) |
32.6 (90.7) |
32.6 (90.7) |
31.4 (88.5) |
28.4 (83.1) |
24.5 (76.1) |
19.9 (67.8) |
26.6 (79.9) |
| Daily mean °C (°F) | 13.4 (56.1) |
15.5 (59.9) |
18.4 (65.1) |
23.1 (73.6) |
26.2 (79.2) |
27.6 (81.7) |
27.8 (82.0) |
27.6 (81.7) |
26.2 (79.2) |
23.2 (73.8) |
19.2 (66.6) |
14.9 (58.8) |
21.9 (71.5) |
| Mean daily minimum °C (°F) | 10.8 (51.4) |
12.8 (55.0) |
15.9 (60.6) |
20.1 (68.2) |
22.8 (73.0) |
24.6 (76.3) |
24.8 (76.6) |
24.4 (75.9) |
22.8 (73.0) |
19.7 (67.5) |
15.7 (60.3) |
11.6 (52.9) |
18.8 (65.9) |
| Record low °C (°F) | 0.8 (33.4) |
1.6 (34.9) |
2.6 (36.7) |
9.4 (48.9) |
13.3 (55.9) |
16.3 (61.3) |
19.5 (67.1) |
21.6 (70.9) |
15.7 (60.3) |
9.6 (49.3) |
3.9 (39.0) |
−0.3 (31.5) |
−0.3 (31.5) |
| Average precipitation mm (inches) | 43.6 (1.72) |
29.8 (1.17) |
57.9 (2.28) |
75.4 (2.97) |
156.7 (6.17) |
243.2 (9.57) |
257.1 (10.12) |
218.4 (8.60) |
115.0 (4.53) |
68.3 (2.69) |
46.3 (1.82) |
34.2 (1.35) |
1,345.9 (52.99) |
| Average precipitation days (≥ 0.1 mm) | 12.2 | 11.4 | 15.9 | 13.6 | 15.1 | 18.4 | 19.1 | 16.8 | 11.3 | 7.9 | 8.2 | 8.2 | 158.1 |
| Average relative humidity (%) | 76 | 76 | 79 | 77 | 76 | 81 | 81 | 80 | 78 | 74 | 74 | 73 | 77 |
| Mean monthly sunshine hours | 60.0 | 61.6 | 54.1 | 95.8 | 146.2 | 147.7 | 176.5 | 187.8 | 173.0 | 151.1 | 128.9 | 110.1 | 1,492.8 |
| Percent possible sunshine | 18 | 19 | 14 | 25 | 36 | 37 | 43 | 47 | 47 | 42 | 39 | 33 | 33 |
| Source: China Meteorological Administration[2][3] | |||||||||||||
See also
[edit]References
[edit]- ^ 2023年统计用区划代码和城乡划分代码:大新县 (in Simplified Chinese). National Bureau of Statistics of China.
- ^ 1991-2020 normals "Climate averages from 1991 to 2020". China Meteorological Administration. Archived from the original on 2023-04-17.
- ^ 1981-2010 extremes 中国气象数据网 – WeatherBk Data [China Meteorological Data Network - WeatherBk Data] (in Simplified Chinese). China Meteorological Administration. Retrieved 14 April 2023.

