Peyrolles-en-Provence
You can help expand this article with text translated from the corresponding article in French. (October 2021) Click [show] for important translation instructions.
|
Peyrolles-en-Provence
Peiròla de Provença (Occitan) | |
|---|---|
 The 17th-century bell tower in the town centre of Peyrolles-en-Provence | |
| Coordinates: 43°38′47″N 5°35′09″E / 43.6464°N 5.5858°E | |
| Country | France |
| Region | Provence-Alpes-Côte d'Azur |
| Department | Bouches-du-Rhône |
| Arrondissement | Aix-en-Provence |
| Canton | Trets |
| Intercommunality | Aix-Marseille-Provence |
| Government | |
| • Mayor (2020–2026) | Olivier Frégeac[1] |
Area 1 | 34.9 km2 (13.5 sq mi) |
| Population (2022)[2] | 5,316 |
| • Density | 150/km2 (390/sq mi) |
| Time zone | UTC+01:00 (CET) |
| • Summer (DST) | UTC+02:00 (CEST) |
| INSEE/Postal code | 13074 /13860 |
| Elevation | 201–782 m (659–2,566 ft) (avg. 220 m or 720 ft) |
| 1 French Land Register data, which excludes lakes, ponds, glaciers > 1 km2 (0.386 sq mi or 247 acres) and river estuaries. | |
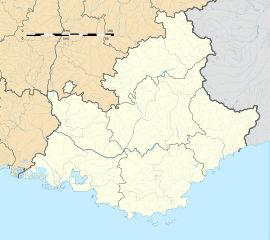
Peyrolles-en-Provence (French pronunciation: [pɛʁɔl ɑ̃ pʁɔvɑ̃s]; Occitan: Peiròla de Provença) is a commune in the Bouches-du-Rhône department in the Provence-Alpes-Côte d'Azur region in Southern France. Part of the Aix-Marseille-Provence Metropolis, it is located 18 km (11.2 mi) northeast of Aix-en-Provence. In 2018, Peyrolles-en-Provence had a population of 5,125.
Demographics
[edit]
|
| ||||||||||||||||||||||||||||||||||||||||||||||||||||||||||||||||||||||||||||||||||||||||||||||||||||||||||||||||||
| Source: EHESS[3] and INSEE (1968-2017)[4] | |||||||||||||||||||||||||||||||||||||||||||||||||||||||||||||||||||||||||||||||||||||||||||||||||||||||||||||||||||
Climate
[edit]On average, Peyrolles-en-Provence experiences 59.3 days per year with a minimum temperature below 0 °C (32.0 °F), 0.8 days per year with a minimum temperature below −10 °C (14.0 °F), 0.4 days per year with a maximum temperature below 0 °C (32.0 °F), and 66.8 days per year with a maximum temperature above 30 °C (86.0 °F). The record high temperature was 44.4 °C (111.9 °F) on 28 June 2019, while the record low temperature was −14.1 °C (6.6 °F) on 12 February 2012.[5]
| Climate data for Peyrolles-en-Provence (1991–2020 normals, extremes 2005–present) | |||||||||||||
|---|---|---|---|---|---|---|---|---|---|---|---|---|---|
| Month | Jan | Feb | Mar | Apr | May | Jun | Jul | Aug | Sep | Oct | Nov | Dec | Year |
| Record high °C (°F) | 20.1 (68.2) |
23.3 (73.9) |
26.1 (79.0) |
29.2 (84.6) |
34.3 (93.7) |
44.4 (111.9) |
38.9 (102.0) |
41.5 (106.7) |
35.5 (95.9) |
31.3 (88.3) |
23.4 (74.1) |
21.6 (70.9) |
44.4 (111.9) |
| Mean daily maximum °C (°F) | 11.3 (52.3) |
12.6 (54.7) |
16.3 (61.3) |
20.1 (68.2) |
24.0 (75.2) |
29.0 (84.2) |
32.4 (90.3) |
31.6 (88.9) |
26.9 (80.4) |
21.5 (70.7) |
15.4 (59.7) |
11.3 (52.3) |
21.0 (69.9) |
| Daily mean °C (°F) | 5.9 (42.6) |
6.4 (43.5) |
9.6 (49.3) |
13.0 (55.4) |
16.6 (61.9) |
21.0 (69.8) |
23.8 (74.8) |
23.0 (73.4) |
19.4 (66.9) |
15.1 (59.2) |
9.9 (49.8) |
6.0 (42.8) |
14.1 (57.5) |
| Mean daily minimum °C (°F) | 0.5 (32.9) |
0.2 (32.4) |
2.9 (37.2) |
6.0 (42.8) |
9.3 (48.7) |
12.9 (55.2) |
15.2 (59.4) |
14.5 (58.1) |
11.9 (53.4) |
8.8 (47.8) |
4.5 (40.1) |
0.7 (33.3) |
7.3 (45.1) |
| Record low °C (°F) | −10.1 (13.8) |
−14.1 (6.6) |
−7.7 (18.1) |
−4.5 (23.9) |
−1.2 (29.8) |
1.5 (34.7) |
6.8 (44.2) |
5.6 (42.1) |
1.7 (35.1) |
−4.1 (24.6) |
−8.0 (17.6) |
−11.0 (12.2) |
−14.1 (6.6) |
| Average precipitation mm (inches) | 48.3 (1.90) |
37.4 (1.47) |
36.9 (1.45) |
49.0 (1.93) |
49.3 (1.94) |
47.6 (1.87) |
22.6 (0.89) |
30.4 (1.20) |
54.1 (2.13) |
81.0 (3.19) |
84.5 (3.33) |
54.3 (2.14) |
595.4 (23.44) |
| Average precipitation days (≥ 1.0 mm) | 5.1 | 6.1 | 6.1 | 6.8 | 6.2 | 4.1 | 2.2 | 3.3 | 4.6 | 5.1 | 6.8 | 5.6 | 62.0 |
| Source: Meteociel[5] | |||||||||||||
See also
[edit]References
[edit]- ^ "Répertoire national des élus: les maires" (in French). data.gouv.fr, Plateforme ouverte des données publiques françaises. 13 September 2022.
- ^ (in French). The National Institute of Statistics and Economic Studies. 19 December 2024 https://www.insee.fr/fr/statistiques/8288323?geo=COM-13074.
{{cite web}}: Missing or empty|title=(help) - ^ Des villages de Cassini aux communes d'aujourd'hui: Commune data sheet Peyrolles-en-Provence, EHESS (in French).
- ^ Population en historique depuis 1968, INSEE
- ^ a b "1991–2020 Normals and Records – Station: Peyrolles-en-Provence". Meteociel.fr. Retrieved 6 September 2023.
External links
[edit]- Official website (in French)


