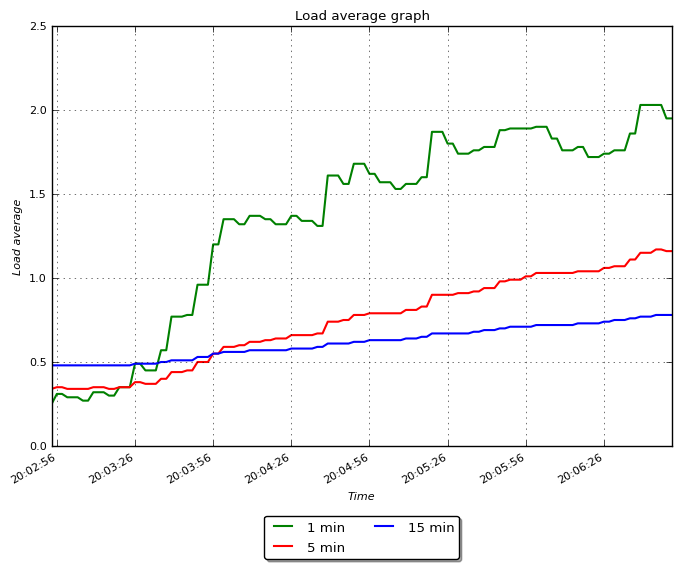
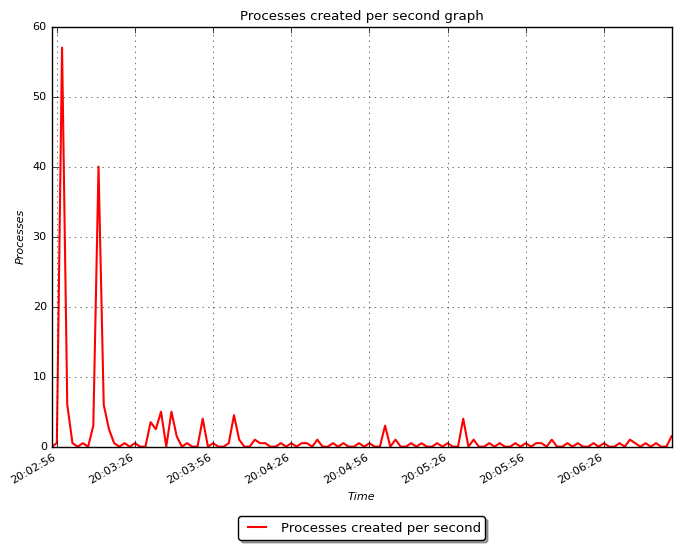
This repository is intended to give a simple way to measure resources usage (CPU, RAM...) in a machine. It uses sar to retrieve data and gnuplot (by default) or matplotlib to generate graphs from it.
Useful to visualize and analyze data during stress tests.
The following graphs based on sar data are generated:
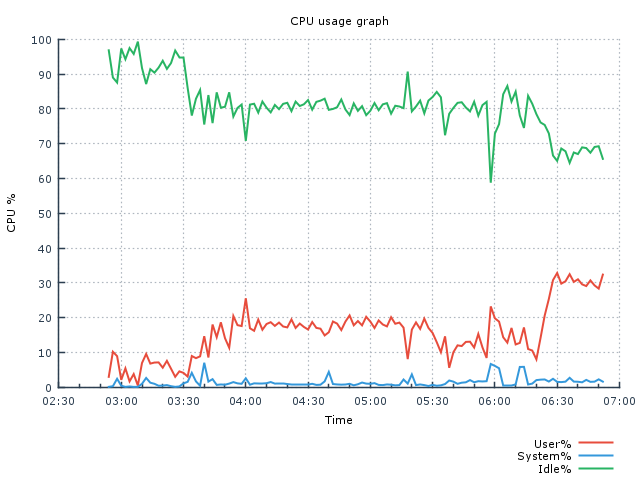
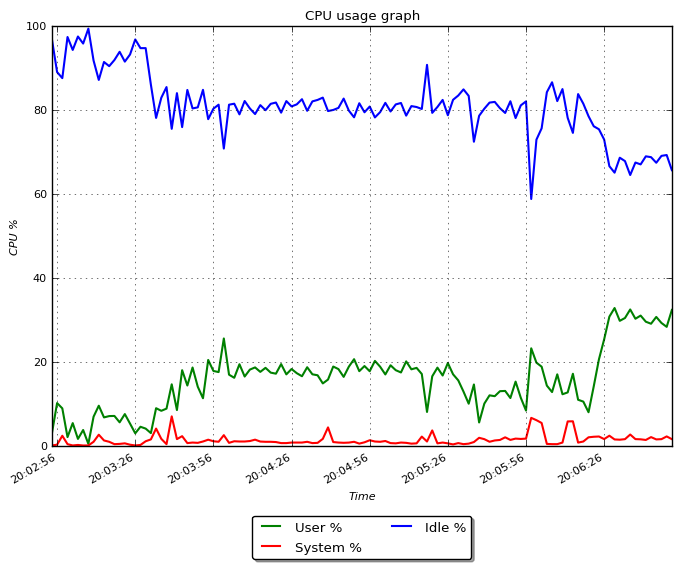
- CPU usage
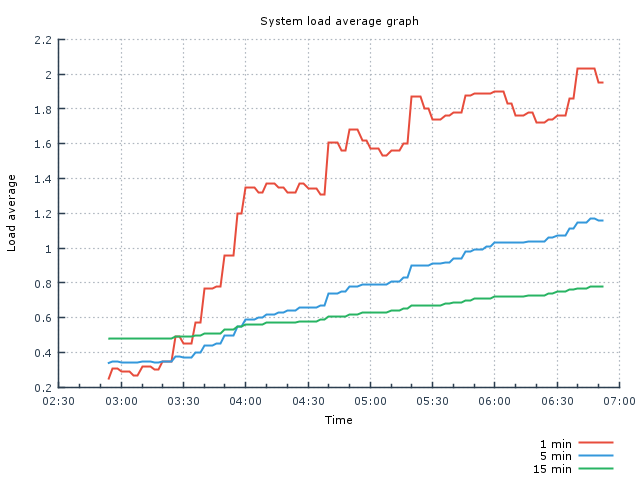
- Load average
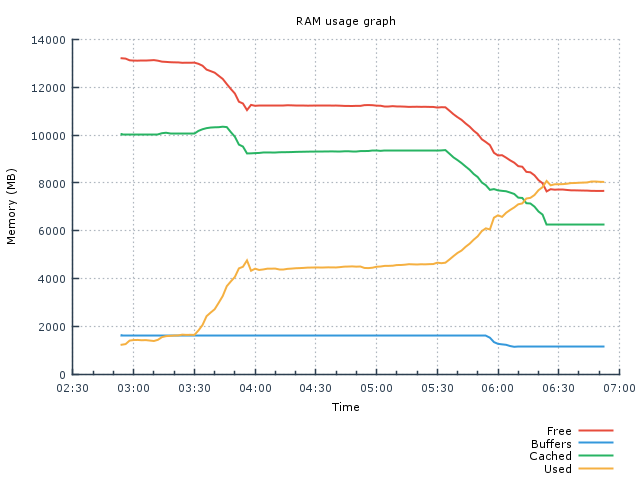
- RAM usage
- I/O transfer
- Processes created per second
- Swap usage
- Context switches
- Tasks (run queue, active, blocked)
- Network interface statistics (eth0 by default)
- TCP/UDP sockets
For basic functionality you will need to install sysstat and gnuplot in your system using your package manager:
# Debian & based
apt-get install sysstat gnuplot
# RHEL & based
yum install sysstat gnuplot
Minimum version required:
- gnuplot 4.4+
- sysstat 10.1.5+
You can check your current version with:
# Gnuplot
gnuplot --version
# Sysstat
sar -V
If your current distribution (for example, CentOS 6) doesn't have these versions in repositories by default, you will have to either install the needed package or build from sources.
If you want to generate the graphs using matplotlib (in Python 2.7) you can install it with pip. In case you don't have pip check the official guide to install it using your chosen package manager. Once you have pip just:
pip install matplotlib- If you are going to use the mail option (to send the graphs via email) you will need mutt:
# Debian & based
apt-get install mutt
# RHEL & based
yum install mutt- Clone this repo or download it (ZIP format). Note that the files contained in data/ and graphs/ folders are only for sample purposes.
- By default the graphs are generated using gnuplot. If you want to generate them using matplotlib, change the variable graph_generator in the file sarviewer.properties from gnuplot to matplotlib
- Network interface statistics are generated for eth0 by default. Change the variable network_interface as needed in sarviewer.properties file.
- The repo can be used in two modes, depending on your needs. See below.
- Useful for stress tests. Launch the data_collector.sh script if you want to begin collecting data. Specify the number of samples and interval to take each sample. Notice that whenever you want you can cancel the collector with Ctrl+C, interrumpting the collection of data. If it is cancelled you will need to launch the script plotter.sh manually. The data and graphs generated will overwrite the samples given in this repo in data/ and graphs/ folder respectively.
[jota@myserver sarviewer]$ ./data_collector.sh
Please specify the number of samples to take-> 10
Please specify the sample interval (take sample every X seconds)-> 2
Taking 10 samples with 2 seconds interval
Total time to collect all data: 20 seconds
----------------------------------
>>> Collecting data
>>> Please wait until data collection is completed
----------------------------------
- You can abort this script with Ctrl+C, but have in mind the data will stop being collected when you cancel it.
- You will also need to manually launch script plotter.sh to generate the graphs.
-
Once the script has finished the data collection or you have cancelled it (and subsequently launched plotter.sh) you can analyze the resource usage in the graphs (PNG format) that have been generated in the graphs/ folder of this repo.
-
You can also use parameters with the script, for example:
# Generate 10 samples with 1 second interval between each one
./data_collector.sh -n 10 -i 1

# Generate 10 samples with 1 second interval between each one and send results to mail
./data_collector.sh -n 10 -i 1 -m example@example.com
- If you just want to read the data already generated by sar daemon in your system, use the script system_data_reader.sh and choose the sa* file you want to parse to generate the corresponding graphs. Remember that sar daemon should have been previously enabled in /etc/default/sysstat
[jota@myserver sarviewer]$ ./system_data_reader.sh
List of sa* files available at this moment to retrieve data from:

-------------------------------------------
File sa15 with data from Linux 3.16.0-4-amd64 (myserver) 	04/15/17 	_x86_64_	(8 CPU)
File sa16 with data from Linux 3.16.0-4-amd64 (myserver) 	04/16/17 	_x86_64_	(8 CPU)
File sa17 with data from Linux 3.16.0-4-amd64 (myserver) 	04/17/17 	_x86_64_	(8 CPU)
File sa18 with data from Linux 3.16.0-4-amd64 (myserver) 	04/18/17 	_x86_64_	(8 CPU)
File sa19 with data from Linux 3.16.0-4-amd64 (myserver) 	04/19/17 	_x86_64_	(8 CPU)
File sa20 with data from Linux 3.16.0-4-amd64 (myserver) 	04/20/17 	_x86_64_	(8 CPU)
File sa21 with data from Linux 3.16.0-4-amd64 (myserver) 	04/21/17 	_x86_64_	(8 CPU)
File sa22 with data from Linux 3.16.0-4-amd64 (myserver) 	04/22/17 	_x86_64_	(8 CPU)
File sa23 with data from Linux 3.16.0-4-amd64 (myserver) 	04/23/17 	_x86_64_	(8 CPU)
-------------------------------------------

Note that the number that follows the "sa" file specifies the day of the data collected by sar daemon
Please select a sa* file from the listed above: sa15
- You can also use parameters with the script system_data_reader.sh, specifying the sa file to parse, start/ending time and an optional email address where you will receive your graphs attached. Examples:
# Send by email day 04 statistics
./system_data_reader.sh -f sa04 -m example@example.com

# Send by email day 04 statistics between 09:00 and 12:00
./system_data_reader.sh -f sa04 -s 09:00 -e 12:00 -m example@example.com

# Send by email day 05 statistics just since 10:00
./system_data_reader.sh -f sa05 -s 10:00 -m example@example.com

# Just parse day 05 statistics
./system_data_reader.sh -f sa05
- Parameters are also useful if you want to send statistics periodically with a crontab. Examples:
# Send graphs statistics from present day everyday at 23:30
30 23 * * * /home/jota/scripts/sarviewer/system_data_reader.sh -f sa$(date +\%d) -m example@example.com

# Send graphs statistics from the day before everyday at 23:30
30 23 * * * /home/jota/scripts/sarviewer/system_data_reader.sh -f sa$(date +\%d -d yesterday) -m example@example.com
Some samples of graphs generated with gnuplot
- RAM
- CPU
- Load average
- Processes
Some samples of graphs generated with matplotlib (Python)
- RAM
- CPU
- Load average
- Processes
