Basis data, analysis, and visualization.
- Find your data url by opening up the data activity tab on your Basis control panel.
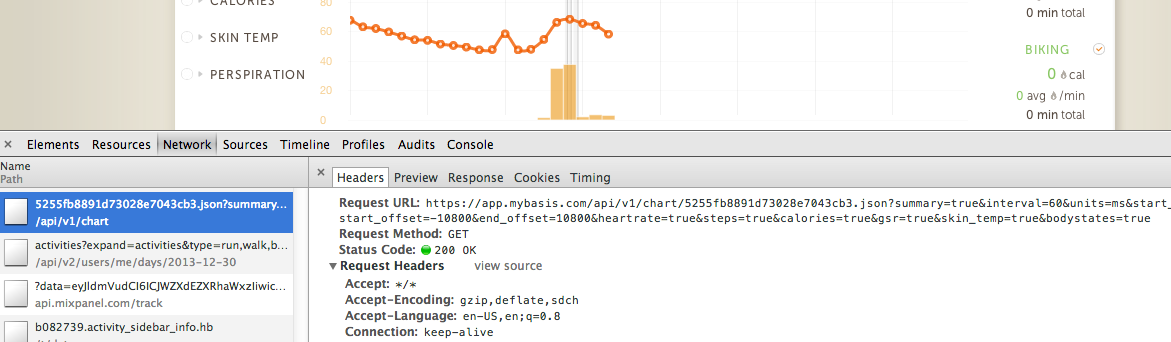
It's unique to each user and is the only means of authentication (oh noes! you can see mine). For convenience all my data is already downloaded and included in this repo. Tell me something I don't know about myself!
- Now run a quick bash script to download all the json:
$ for i in $(seq -w 1 30)}; do wget "https://app.mybasis.com/api/v1/chart/YOUR_CODE_HERE.json?summary=true&interval=60&units=ms&start_date=2013-12-$i&heartrate=true&steps=true&calories=true&gsr=true&skin_temp=true&bodystates=true" -O 2013-11-$i.json; done
- Now you've got all your data. Run the load_data.py script to make csv files (ehh this one could use some love).
$ python scripts/load_data.py
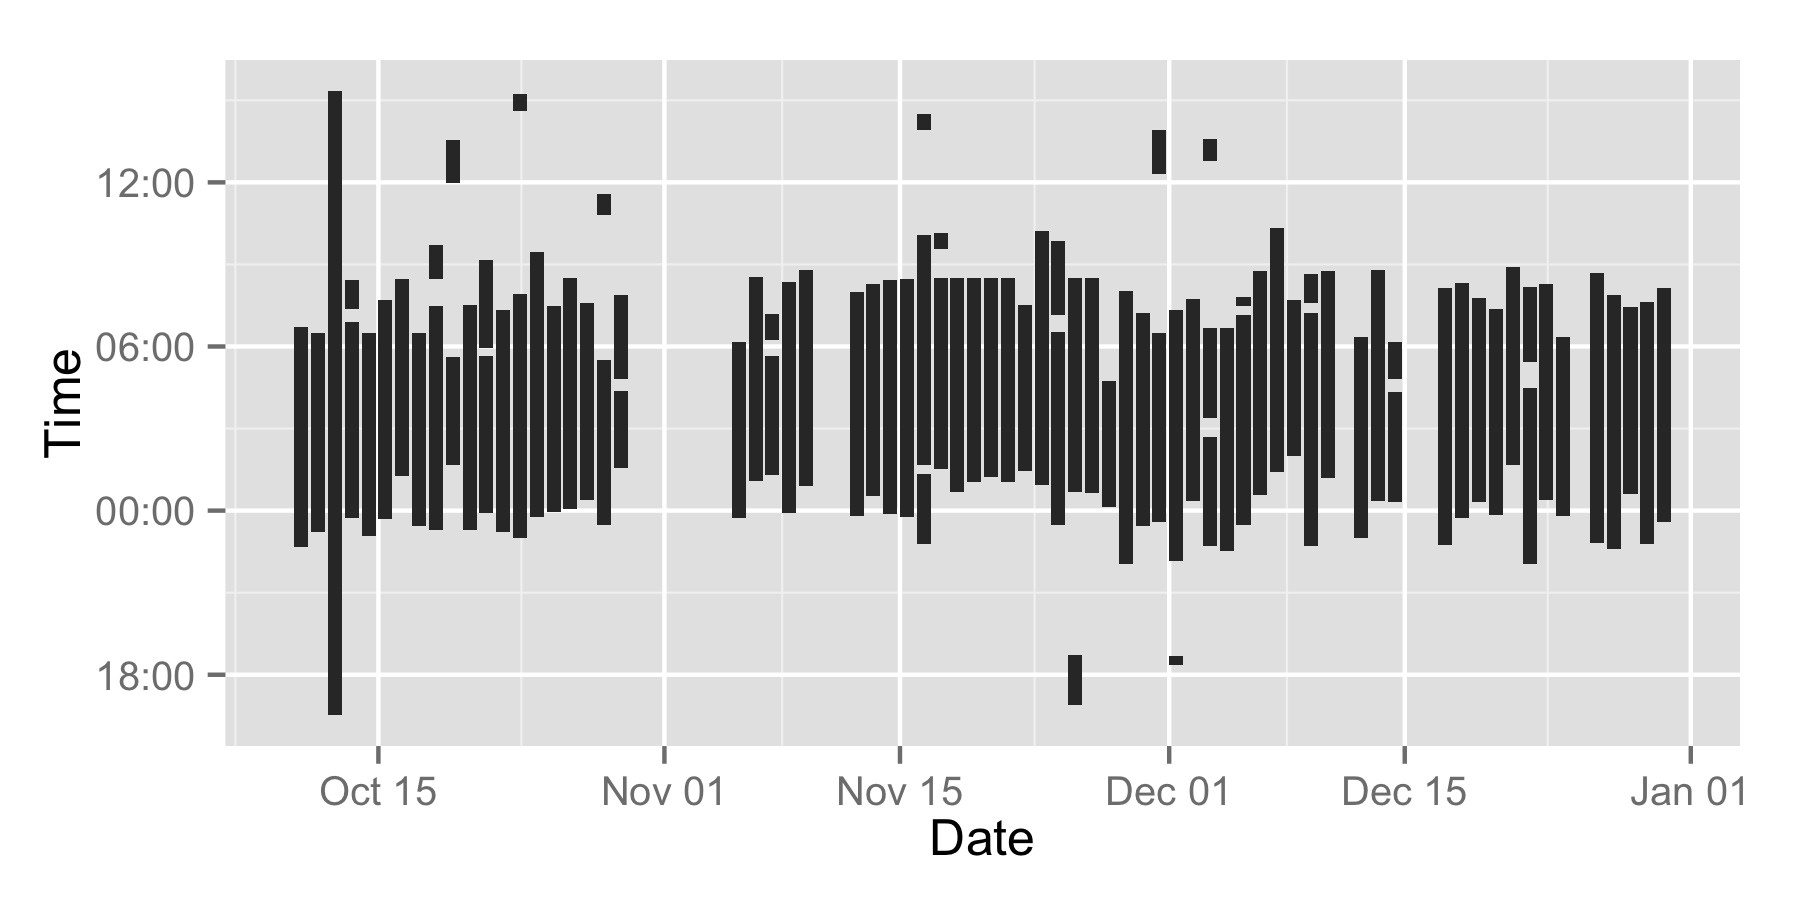
Lots of work left to do here, but you can look at scripts/sleep.r for how I'm plotting sleep:
source('scripts/sleep.r')