Measuring the goodness of an explanation
![]()


This package is a modular package that implements various metrics for comparing saliency maps generated by explanation methods. To ensure fair comparisons, metrics should be computed on the same saliency map and corresponding ground truth map.
Saliency Metrics is a Python package that implements various metrics for comparing saliency maps generated by explanation methods. To ensure fair comparisons, metrics should be computed on the same saliency map and corresponding ground truth map. The package includes the following metrics:
- SSIM (Structural Similarity Index): A perceptual metric that quantifies the similarity between two images. It considers changes in structural information, luminance, and contrast.
- PSNR (Peak Signal-to-Noise Ratio): A metric that measures the ratio between the maximum possible power of a signal and the power of corrupting noise. It is often used to assess the quality of reconstructed images.
- EMD (Earth Mover's Distance): A metric that measures the distance between two probability distributions over a region D. It is often used in computer vision and image retrieval tasks.
tutorial.ipynb is an original way used to check and test the different metrics.
pip install saliencytools
from saliencytools import ssim, psnr, emd # and more

import numpy as np
import matplotlib.pyplot as plt


# create a random saliency map
saliency_map = np.random.rand(28*28).reshape(28, 28)- 0.5
# create a random ground truth map
ground_truth_map = np.random.rand(28*28).reshape(28, 28)- 0.5
# create a random binary mask

# use all the metrics to compare the saliency map with the ground truth map
for metric in [ssim, psnr, emd]:

print(f"{metric.__name__}: {metric(saliency_map, ground_truth_map)}")The tutorial.ipynb file is a Jupyter notebook that showcases the validation of the metrics. It includes examples of how to use the package, as well as visualizations of the results.
The notebook implements a KNN-like classification task using the MNIST dataset. It uses the saliencytools package to compute the distance between the test images and k prototypes of each class.
The k prototypes (k=5 in the notebook) are choosen random, and the distance is computed using all the metrics implemented in the package.
Some preprocessing is explored to check different ways to compute the distance.
C stands for Clipping the saliency maps in -1, 1.
N stands for Normalization of the saliency maps in 0, 1.
S stands for the application of the sobel filter to the saliency maps, so that the edges are more influencing.
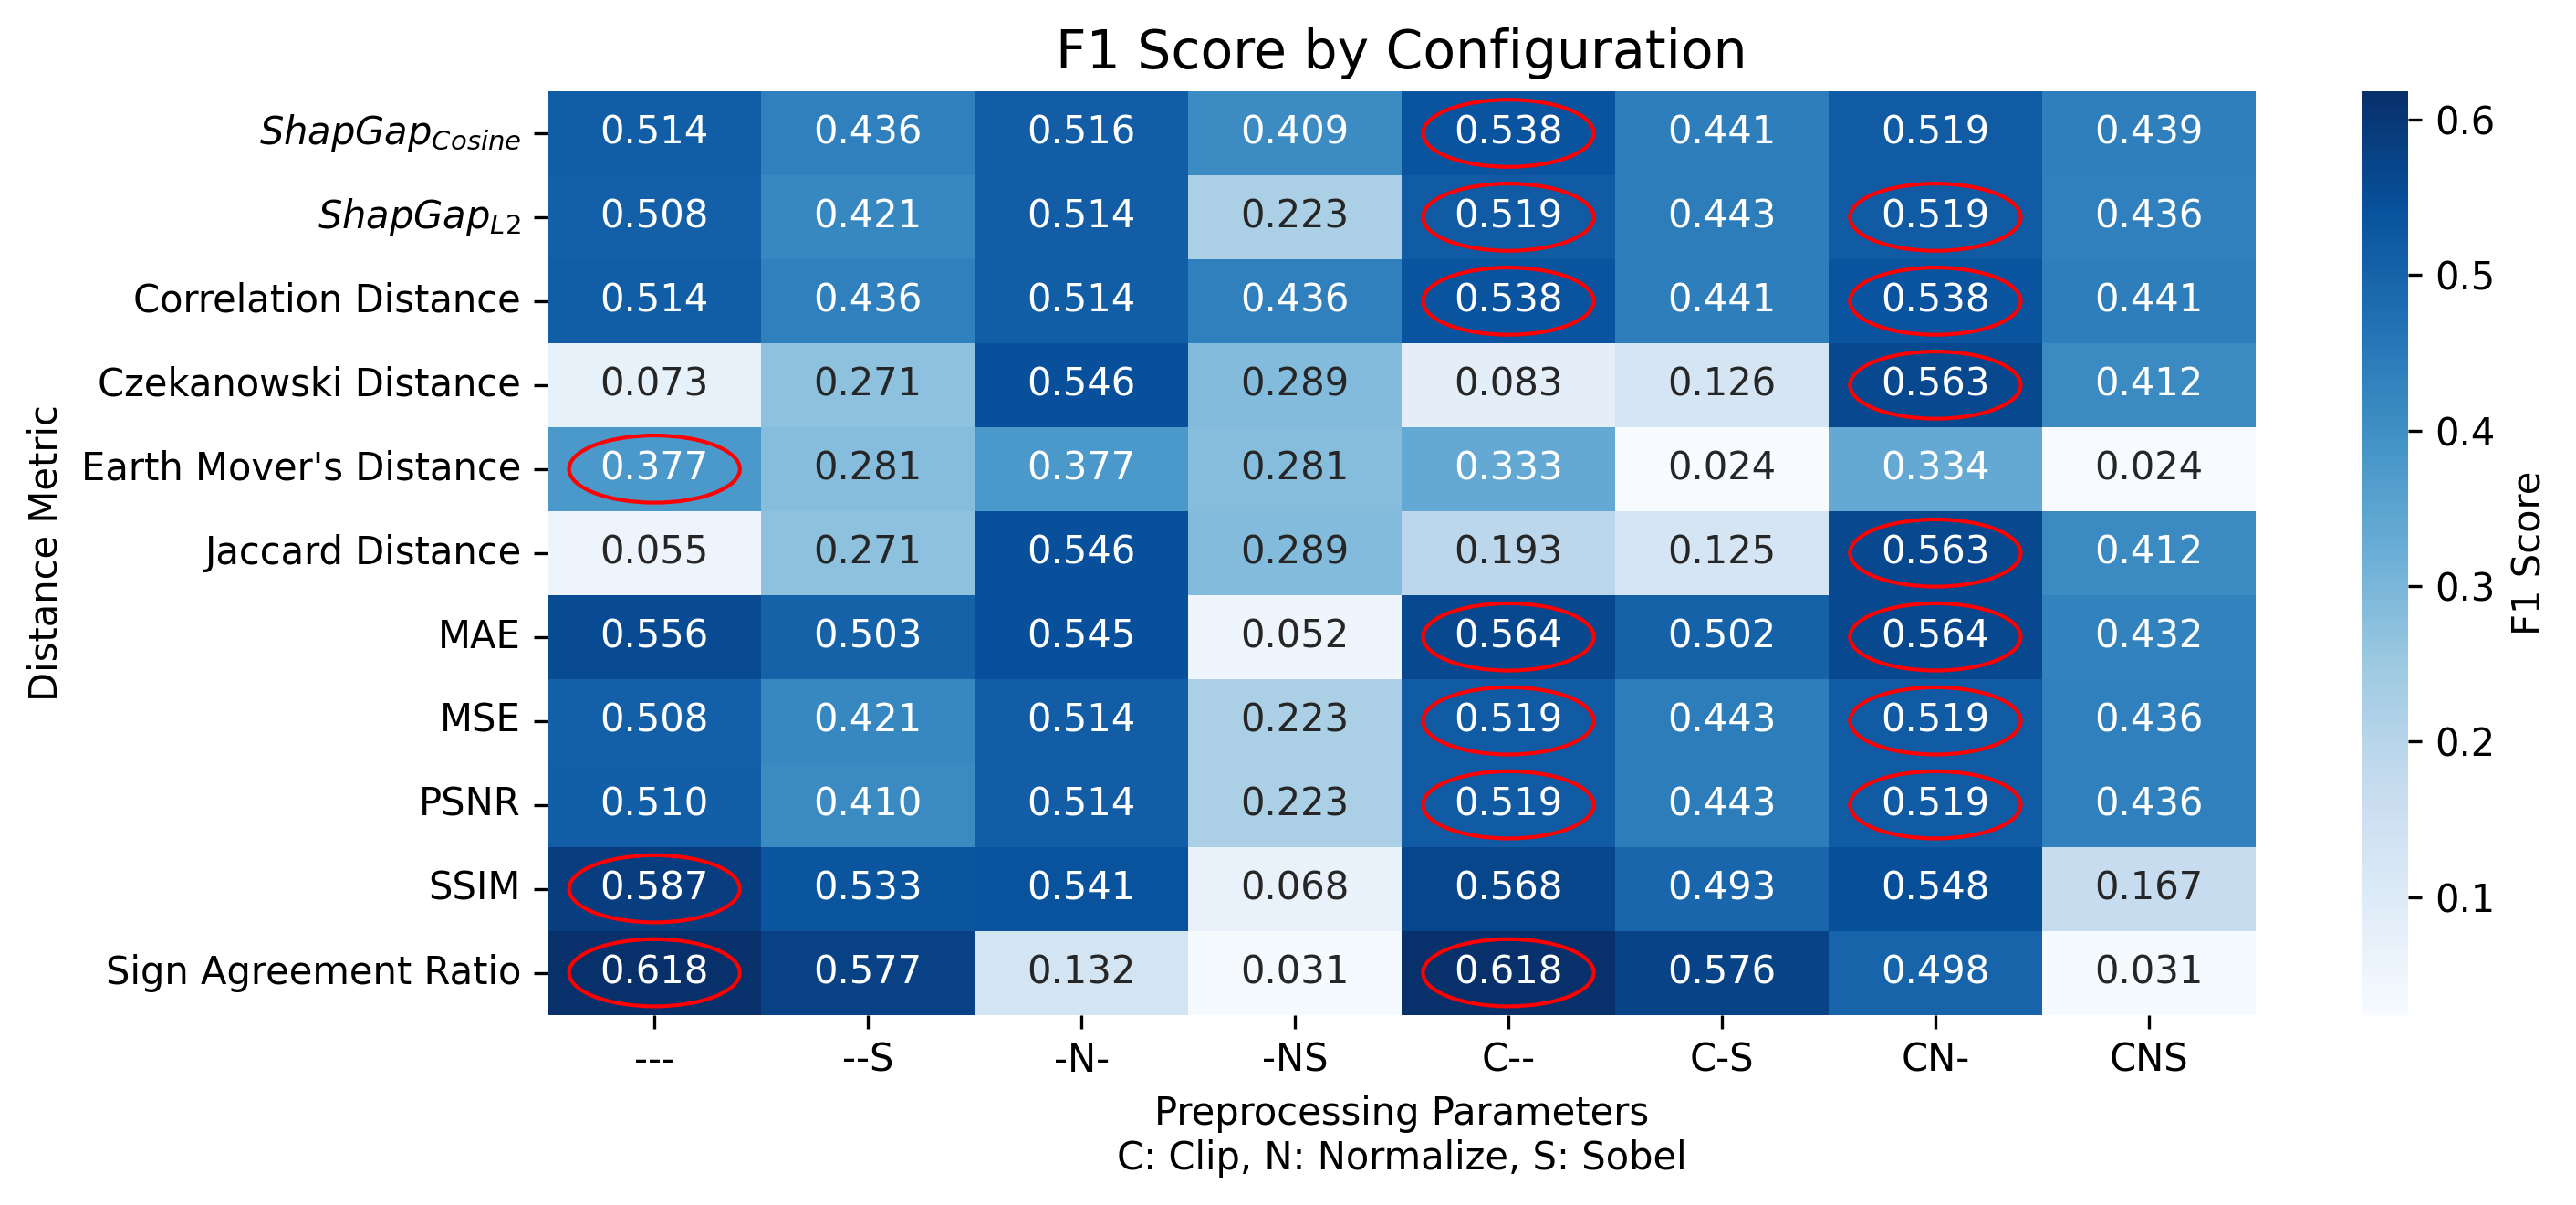
From the above images we can see that the F1 score changes depending on the metric used and the preprocessing applied. In this case the best metric is the Sign Agreement ratio (both without preprocessing and by clipping the saliency maps in -1, 1). The SSIM metric is the second best, without any preprocessing. For instance, the Jaccard metric is not good without preprocessing.
from https://ar5iv.labs.arxiv.org/html/1604.03605
- [] Area under ROC Curve AUC
- [] Shuffled AUC sAUC
- [] Normalized Scanpath Saliency NSS
- [] Kullback-Leibler divergence KL [23, 49, 68, 88]
- [] Information Gain IG [45, 46]
This package is needed since other alternatives are not stable, not maintained or trustable. They are not specific for images, they don't exploit numpy or scipy, and they are not modular. The documentation of some is clear, yet the the examples are not complete.
Open Sources alternatives to this package are:
- distancia https://github.com/ym001/distancia
- images have to be converted to lists
- there are errors in the code
- there is no homogenization of the metrics
- documentation is nice (https://distancia.readthedocs.io/en/latest/)
- saliency-metrics https://github.com/sandylaker/saliency-metrics
- project abandoned (last commit 2022)
- documentaiton incomplete https://saliency-metrics.readthedocs.io/en/latest/index.html
- Interpretable Machine Learning Book https://christophm.github.io/interpretable-ml-book/pixel-attribution.html
- medium file matching https://medium.com/scrapehero/exploring-image-similarity-approaches-in-python-b8ca0a3ed5a3
All the metrics documentation is available in the
- Geometric Metrics
- Euclidean Distance (
$ShapGap_{L2}$ ) - Cosine Distance (
$ShapGap_{Cosine}$ ) - Mean Absolute Error (MAE)
- Mean Squared Error (MSE)
- Euclidean Distance (
- Distribution/Statistical Metrics
- Earth Mover's Distance (EMD)
- Correlation Distance
- Peak Signal-to-Noise Ratio (PSNR)
- Set-Theoretic Metrics
- Jaccard Index
- Jaccard Distance
- Czekanowski Distance
- Binary Metrics
- Sign Agreement Ratio (SAR)
- Structural Metrics
- Structural Similarity Index Measure (SSIM)