Splitting datasets into training and test#
In this notebook, we are going to show how to split the entries of a dataset, along time, to construct training and test subsets of data (or training/validation/test). Specifically, we’ll use the split function:
[1]:
from gluonts.dataset.split import split
This needs to be given:
the
datasetthat we want to split;an
offsetor adate, but not both simultaneously. These two arguments are provided for the function to know how to slice training and test data, based on a fixed integer offset or apandas.Period, respectively.
As a result, the split method returns the splited dataset, consisting of the training data training_dataset and a “test template” that knows how to generate input/output test pairs.
Loading a dataset#
[2]:
%matplotlib inline
import pandas as pd
import matplotlib.pyplot as plt

plt.rcParams["axes.grid"] = True
plt.rcParams["figure.figsize"] = (20, 3)
For our examples, we will use data from the following csv file, which is originally sampled every 5 minutes, but we resample at hourly frequency. Note that this makes for a dataset consisting of a single time series, but everything we show here applies to any dataset, regardless of how many series it contains.
[3]:
url = "https://raw.githubusercontent.com/numenta/NAB/master/data/realTweets/Twitter_volume_AMZN.csv"
df = (
    pd.read_csv(url, header=0, index_col="timestamp", parse_dates=True)
    .resample("1H")
    .sum()
)
This is what the data looks like:
[4]:
df.plot()
plt.legend(["dataset"], loc="upper left")
plt.show()

Turn the dataframe into a GluonTS dataset using PandasDataset
[5]:
from gluonts.dataset.pandas import PandasDataset

dataset = PandasDataset(df, target="value")
Train/test splits#
Let’s define a few helper functions to visualize data splits.
[6]:
from gluonts.dataset.util import to_pandas
def highlight_entry(entry, color):
start = entry["start"]
end = entry["start"] + len(entry["target"])
plt.axvspan(start, end, facecolor=color, alpha=0.2)
def plot_dataset_splitting(original_dataset, training_dataset, test_pairs):
for original_entry, train_entry in zip(original_dataset, training_dataset):
to_pandas(original_entry).plot()
highlight_entry(train_entry, "red")
plt.legend(["sub dataset", "training dataset"], loc="upper left")
plt.show()
for original_entry in original_dataset:
for test_input, test_label in test_pairs:
to_pandas(original_entry).plot()
highlight_entry(test_input, "green")
highlight_entry(test_label, "blue")
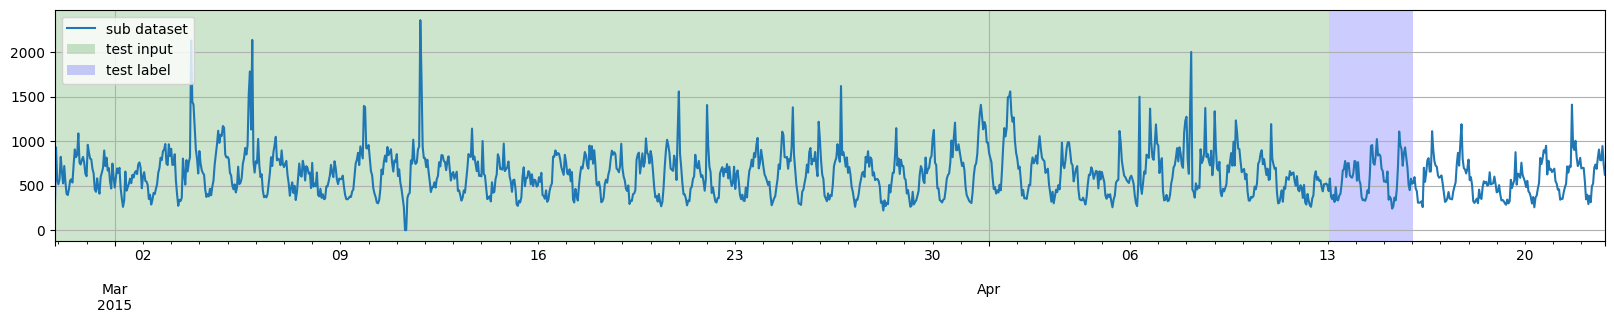
plt.legend(["sub dataset", "test input", "test label"], loc="upper left")
plt.show()
For the first example, we will take training data up to specific date, and then directly generate several test instances from the same date onwards.
[7]:
prediction_length = 3 * 24
training_dataset, test_template = split(
    dataset, date=pd.Period("2015-04-07 00:00:00", freq="1H")
)
test_pairs = test_template.generate_instances(
    prediction_length=prediction_length,
    windows=3,
)

plot_dataset_splitting(dataset, training_dataset, test_pairs)


However, we don’t necessarily need to align the date where training data ends with the date where the testing part starts. So, for the second example, we will take training data up to date 2015-03-27 00:00:00, then generate several test instances from date 2015-04-07 00:00:00 onwards by applying the split function two times.
[8]:
training_dataset, _ = split(dataset, date=pd.Period("2015-03-28 00:00:00", freq="1H"))
_, test_template = split(dataset, date=pd.Period("2015-04-07 00:00:00", freq="1H"))
test_pairs = test_template.generate_instances(
    prediction_length=prediction_length,
    windows=3,
)

plot_dataset_splitting(dataset, training_dataset, test_pairs)


Also, we don’t necessarily need to align all the test instances time by time. So, for the third example, we will add distance arguments in generate_instances function to make test instances overlap between each other.
[9]:
training_dataset, test_template = split(
    dataset, date=pd.Period("2015-04-07 00:00:00", freq="1H")
)
test_pairs = test_template.generate_instances(
    prediction_length=prediction_length,
    windows=3,
    distance=24,
)

plot_dataset_splitting(dataset, training_dataset, test_pairs)


