Papers by Sanusi Ahmed
International Journal of Geosciences , 2023
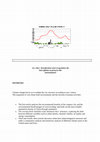
Nous avons recueilli des données hydrologiques dans le bassin versant de la commune de Reutenbou... more Nous avons recueilli des données hydrologiques dans le bassin versant de la commune de Reutenbourg. Nos objectifs sont multiples. Dans un premier temps nous voulons mieux comprendre les dynamiques du cycle de l’eau, déterminer quelles sont les relations entre la météorologie et ces dynamiques, mais aussi entre le type de sol et la qualité de l’évaporation ou de l’infiltration de l’eau par exemple. Nous voulons comprendre dans la globalité les changements de dynamiques du cycle de l’eau en fonction de l’environnement.
 Bookmarks Related papers MentionsView impact
Bookmarks Related papers MentionsView impact 
Journal of Biodiversity & Endangered Species, 2016
Over the years, the issue of waste generation and management have been a major issue of concern, ... more Over the years, the issue of waste generation and management have been a major issue of concern, stemming a number of countries around the world, thus, developing countries. The ultimate aim of this study was to investigate into the effects of indiscriminate disposal of waste in and around the Keta Lagoon in the Volta region of Ghana. The study highlighted quite a number of respondents, who had lived in the area for quite a lengthy period and had observed the changes with regards to rapid deteriorating conditions of sanitation in the area as well as the aesthetic nature of the lagoon per the value it served decades ago and now. It is for these reasons why the study sought to look at what had contributed to the diminishing state of the Keta Lagoon, which is a designated Ramsar site (Ramsar Convention, 1971), hence, its importance to Ghana as a nation. The absence of waste management services, ignorance and lack of law enforcement units were identified as key factors, playing a fundam...
Bookmarks Related papers MentionsView impact Spatialisation Géostatistiques by Sanusi Ahmed

Utilisation de méthodes de spatialisation et de géostatistique pour étudier les extrêmes chauds d... more Utilisation de méthodes de spatialisation et de géostatistique pour étudier les extrêmes chauds des températures maximales quotidiennes dans une région de France métropolitaine, Bourgogne-Franche-Comté. Spatialisation des projections relatives aux températures maximales quotidiennes extrêmes pour le mois de juillet à l'horizon 2100.
Le réchauffement climatique est probablement le phénomène qui menace l’humanité le plus. Ainsi, il est intéressant et important de projeter les températures futures dans des modèles pour éventuellement prendre des mesures pour atténuer les effets de ces températures élevées. Pour réaliser des telles cartes, nous nous sommes basés sur les données de Aladin Climat.
Toutes les cartes représentent les températures du mois de juillet en 2100 (horizon 3). De plus, les données exploitées sont issues du scénario RCP 8.5, c’est le scénario le plus grave pour le climat mondial. Pour modéliser ces informations, on a utilisé la méthode de l’interpolation par l’inverse de la distance (IDW), différents types de krigeage et un modèle de régression linéaire.
D’abord, nous allons présenter les cartes qu’on a réalisé. Ensuite, on va comparer les tableaux d’erreurs de modèle de régression linéaire au IDW et au krigeage. Par la suite, on va analyser l’autocorrélation spatiale. Puis, on va expliquer la méthodologie qu’on a employé pour réaliser les cartes. Finalement, on va faire une analyse statistique et spatiale de nos résultats obtenus.
Bookmarks Related papers MentionsView impact Book Reviews by Sanusi Ahmed
This document discusses to what extent compact cities could deal with the issues raised by urban... more This document discusses to what extent compact cities could deal with the issues raised by urban growth. It accounts for the complexity of cities' dynamics and interactions. Climate change forces us to rethink the city structure according to new criteria. The expansion of very dense built environments and the increase in human activities.
The first article discusses the environmental benefits of the compact city and the environmental disadvantages of overcrowding, and finds out the most suitable population density in China through simulation.
The second article simulates some idealised cities’ structures, exploring the links between different variables such as urban density, thermal comfort, air quality and energy consumption.
Third and Fourth: these articles discusses urban heat island mitigation measures and make a comparative analysis and sensitivity analysis of different climate zones in the United states and Paris.
Bookmarks Related papers MentionsView impact Conference Presentations by Sanusi Ahmed

Le phénomène d’inondation lors des précipitations est défini comme l’envahissement passager des l... more Le phénomène d’inondation lors des précipitations est défini comme l’envahissement passager des lieux habituellement émergés par l’eau de pluie. Les inondations résultent de l’accumulation des eaux en raison de facteurs géomorphologiques, hydrologiques, topographiques, météorologiques ou anthropiques. Le risque d’inondation est intrinsèquement lié au lieu : certains espaces sont plus à risque que d’autres. L’aléa prend forme physiquement lorsque des inondations surviennent : il a une durée, une fréquence, une magnitude, une extension spatiale, etc. (Wallez, 2010) (Hountondji et al., 2019).
Le risque peut se définir comme la résultante du croisement entre aléa et vulnérabilité (Desbordes, 1997). Pour le risque d’inondation, l’aléa représente le phénomène naturel aléatoire traduit par le débordement de cours d’eau ou de canaux de drainage et l’extension de l’eau dans le champ d’inondation. La vulnérabilité transcrit quant à elle la sensibilité de l’occupation du sol et de la société au phénomène d’inondation (Pottier, 1998). Elle comprend intrinsèquement une notion d’acceptabilité, au sens socio-économique, des dommages potentiels encourus (Gendreau et al., 1998b) (Hountondji et al., 2019).
La ville de Cotonou est l’une des villes les plus arrosées du Bénin du fait qu’elle fait partie du cordon littoral (Gbaguidi, 2011). De ce fait elle est très exposée au phénomène d’inondation.
Quelles sont les causes et conséquences des inondations dans la ville de cotonou ? Quelles sont les stratégies d’adaptattion et d’atténuation à l’inondation ?
Dans les lignes à suivre nous allons dans un premier temps faire la présentation de la ville de Cotonou, ensuite nous montrerons les causes et conséquences des inondations et enfin nous proposerons des stratégies d’adaptation et d’atténuation.
Bookmarks Related papers MentionsView impact 
Uploads
Papers by Sanusi Ahmed
Spatialisation Géostatistiques by Sanusi Ahmed
Le réchauffement climatique est probablement le phénomène qui menace l’humanité le plus. Ainsi, il est intéressant et important de projeter les températures futures dans des modèles pour éventuellement prendre des mesures pour atténuer les effets de ces températures élevées. Pour réaliser des telles cartes, nous nous sommes basés sur les données de Aladin Climat.
Toutes les cartes représentent les températures du mois de juillet en 2100 (horizon 3). De plus, les données exploitées sont issues du scénario RCP 8.5, c’est le scénario le plus grave pour le climat mondial. Pour modéliser ces informations, on a utilisé la méthode de l’interpolation par l’inverse de la distance (IDW), différents types de krigeage et un modèle de régression linéaire.
D’abord, nous allons présenter les cartes qu’on a réalisé. Ensuite, on va comparer les tableaux d’erreurs de modèle de régression linéaire au IDW et au krigeage. Par la suite, on va analyser l’autocorrélation spatiale. Puis, on va expliquer la méthodologie qu’on a employé pour réaliser les cartes. Finalement, on va faire une analyse statistique et spatiale de nos résultats obtenus.
Book Reviews by Sanusi Ahmed
The first article discusses the environmental benefits of the compact city and the environmental disadvantages of overcrowding, and finds out the most suitable population density in China through simulation.
The second article simulates some idealised cities’ structures, exploring the links between different variables such as urban density, thermal comfort, air quality and energy consumption.
Third and Fourth: these articles discusses urban heat island mitigation measures and make a comparative analysis and sensitivity analysis of different climate zones in the United states and Paris.
Conference Presentations by Sanusi Ahmed
Le risque peut se définir comme la résultante du croisement entre aléa et vulnérabilité (Desbordes, 1997). Pour le risque d’inondation, l’aléa représente le phénomène naturel aléatoire traduit par le débordement de cours d’eau ou de canaux de drainage et l’extension de l’eau dans le champ d’inondation. La vulnérabilité transcrit quant à elle la sensibilité de l’occupation du sol et de la société au phénomène d’inondation (Pottier, 1998). Elle comprend intrinsèquement une notion d’acceptabilité, au sens socio-économique, des dommages potentiels encourus (Gendreau et al., 1998b) (Hountondji et al., 2019).
La ville de Cotonou est l’une des villes les plus arrosées du Bénin du fait qu’elle fait partie du cordon littoral (Gbaguidi, 2011). De ce fait elle est très exposée au phénomène d’inondation.
Quelles sont les causes et conséquences des inondations dans la ville de cotonou ? Quelles sont les stratégies d’adaptattion et d’atténuation à l’inondation ?
Dans les lignes à suivre nous allons dans un premier temps faire la présentation de la ville de Cotonou, ensuite nous montrerons les causes et conséquences des inondations et enfin nous proposerons des stratégies d’adaptation et d’atténuation.
Le réchauffement climatique est probablement le phénomène qui menace l’humanité le plus. Ainsi, il est intéressant et important de projeter les températures futures dans des modèles pour éventuellement prendre des mesures pour atténuer les effets de ces températures élevées. Pour réaliser des telles cartes, nous nous sommes basés sur les données de Aladin Climat.
Toutes les cartes représentent les températures du mois de juillet en 2100 (horizon 3). De plus, les données exploitées sont issues du scénario RCP 8.5, c’est le scénario le plus grave pour le climat mondial. Pour modéliser ces informations, on a utilisé la méthode de l’interpolation par l’inverse de la distance (IDW), différents types de krigeage et un modèle de régression linéaire.
D’abord, nous allons présenter les cartes qu’on a réalisé. Ensuite, on va comparer les tableaux d’erreurs de modèle de régression linéaire au IDW et au krigeage. Par la suite, on va analyser l’autocorrélation spatiale. Puis, on va expliquer la méthodologie qu’on a employé pour réaliser les cartes. Finalement, on va faire une analyse statistique et spatiale de nos résultats obtenus.
The first article discusses the environmental benefits of the compact city and the environmental disadvantages of overcrowding, and finds out the most suitable population density in China through simulation.
The second article simulates some idealised cities’ structures, exploring the links between different variables such as urban density, thermal comfort, air quality and energy consumption.
Third and Fourth: these articles discusses urban heat island mitigation measures and make a comparative analysis and sensitivity analysis of different climate zones in the United states and Paris.
Le risque peut se définir comme la résultante du croisement entre aléa et vulnérabilité (Desbordes, 1997). Pour le risque d’inondation, l’aléa représente le phénomène naturel aléatoire traduit par le débordement de cours d’eau ou de canaux de drainage et l’extension de l’eau dans le champ d’inondation. La vulnérabilité transcrit quant à elle la sensibilité de l’occupation du sol et de la société au phénomène d’inondation (Pottier, 1998). Elle comprend intrinsèquement une notion d’acceptabilité, au sens socio-économique, des dommages potentiels encourus (Gendreau et al., 1998b) (Hountondji et al., 2019).
La ville de Cotonou est l’une des villes les plus arrosées du Bénin du fait qu’elle fait partie du cordon littoral (Gbaguidi, 2011). De ce fait elle est très exposée au phénomène d’inondation.
Quelles sont les causes et conséquences des inondations dans la ville de cotonou ? Quelles sont les stratégies d’adaptattion et d’atténuation à l’inondation ?
Dans les lignes à suivre nous allons dans un premier temps faire la présentation de la ville de Cotonou, ensuite nous montrerons les causes et conséquences des inondations et enfin nous proposerons des stratégies d’adaptation et d’atténuation.