See discussions, stats, and author profiles for this publication at: https://www.researchgate.net/publication/24085785
Is Korea Catching Up? An Analysis of the Labour
Productivity Growth in South Korea
Article in Oxford Development Studies · February 2006
DOI: 10.1080/13600810600921836 · Source: RePEc
CITATION
READS
1
79
3 authors:
Roberta Rabellotti
Giulio Guarini
97 PUBLICATIONS 2,096 CITATIONS
27 PUBLICATIONS 29 CITATIONS
University of Pavia
SEE PROFILE
Tuscia University
SEE PROFILE
Vasco Molini
World Bank
21 PUBLICATIONS 135 CITATIONS
SEE PROFILE
Some of the authors of this publication are also working on these related projects:
Poverty and conflict in Northern Nigeria View project
All content following this page was uploaded by Roberta Rabellotti on 01 January 2017.
The user has requested enhancement of the downloaded file. All in-text references underlined in blue are added to the original document
and are linked to publications on ResearchGate, letting you access and read them immediately.
Is Korea catching up?
An analysis of the labour productivity growth in South Korea1
By: Giulio Guarini* Vasco Molini** and Roberta Rabellotti***
*University of Rome-La Sapienza
** ISESAO-University of Bocconi- Milan and University of Florence
*** Department of Economics and Quantitative Methods, Università del Piemonte Orientale, Italy
July 2003
FIRST DRAFT
1
The authors wish to thank for their comments and suggestions Manuel Albaladejo, Mario Biggeri, Sanjaya Lall,
Alessandro Roncaglia, Mans Sodeborn and Anna Stenbeck . Usual disclaimers apply.
1
1
Introduction
During the last two decades South Korea has experienced a sharp rise in labour productivity which
may be considered as a possible explanation of its increase in international competitiveness (Molini
and Rabellotti, 2001). In industrialising countries, labour productivity growth plays a crucial role to
explain the impact of the globalisation process on the domestic economy. There is some empirical
evidence showing that countries with low levels of labour productivity and slow rates of growth are
often damaged by a too rapid process of liberalization, because their production systems can not
sustain international competitiveness2.
In this paper, we investigate the main determinants of the South Korean labour productivity
increase. Based on the OECD STAN data base, we estimate a labour productivity function,
adopting a non neoclassical approach with proxies for technological skills and capabilities as
explanatory variables.
Following Lall (2001), we choose to focus on technological skills and capabilities as the main
determinants of labour productivity increase. According to this author, an improvement of
technological skills and capabilities is the most important condition for economic development and
particularly, the more a country tries to increase the value added it produces, the more it needs a
skilled labour force. This is the case of South Korea which, starting from low technology exports in
the early 1960’s, moved more recently into higher value added sectors, counting on a highly skilled
labour force as a result of massive investments in vocational secondary schools and technical and
scientific universities.
The plan of the paper is the following: in the next section we investigate the rise in South Korean
labour productivity, comparing it with labour productivity changes in Japan and the USA, used as
international benchmarks. This analysis confirms the so called “catch up” story: Korea has
achieved a massive reduction in its productivity gap with more advanced countries, becoming
internationally competitive in some high-tech sectors.
In sections 3 and 4, we discuss the importance of investing in the accumulation of skills and
capabilities to foster countries’ economic development and we present some empirical evidence
about the availability of skilled labour force in Korea.
Then, sections 5 and 6 present the test of our simple model, using a non neo-classical productivity
function, with as a dependent variable the rate of growth of labour productivity per hour in 5
2
For instance, on Latin America this argument is addressed in Katz (2000).
2
different sectors (textiles, chemicals, basic metals and steel, transports, machinery and equipment)
across 24 years from 1975 to 1999, and as independent variables indicators of wage differentials
between sectors, educational levels as well as some control variables.
Finally section 7 concludes the paper drawing some implications for political economy from the
findings of the econometric analysis.
2
Labour productivity in South Korea from 1975 to 1999
The performance of the Korean economy, compared to other industrializing countries in Latin
America or Europe (Greece, Portugal), is really astonishing. According to Young (1994), during
the 1980s Korea and the other three Asian Tigers (Singapore, Taiwan and Hong-Kong) have
experienced the highest rates of growth among all newly industrialized countries (NICs). The
performance remains impressive when comparing Korea with international benchmarks as the USA
and Japan.
In what follows we present an analysis of the trend of the labour productivity in Korea, focusing on
the evolution of its gap with the USA and Japan. We have chosen productivity per hour3 as an
indicator since the number of hours worked is higher in Korea than in the USA and Japan: in the
1990s, in the manufacturing sector the average exceeded 47 hours per week, while in Japan and the
USA the average was closed to 40 hours (ILO-Laborsta 2003).
The data base is the OECD-STAN, including series from 1975 to 1999, with 125 observations, 25
for each of the following sectors (classification Isic Rev.3):
¾ Textiles: including textiles products, leather and footwear;
¾ Basic metals and fabricated metal products;
¾ Chemical rubber plastics and fuel products;
¾ Transport Equipment;
¾ Machinery and Equipment.
These sectors were chosen because they are the most important to explain the trend of the labour
productivity in South Korea, in the 1990s representing on average in the manufacturing sector 75%
of all value added produced and 76% of employment and about 90% of all exported commodities
(OECD –STAN 2003).
3
Value added per year divided by number of hours worked in a year and the number of employed.
3
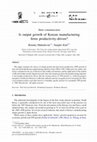
In Graph 1 we present the Korean labour productivity compared with the USA and Japan4 and it
appears that in the mid 1970s the Korean manufacturing sector accounted for less than 40% of the
Japanese labour productivity and less than 20% of the USA one. Starting from the mid 1980’s
productivity began to grow rapidly, massively reducing the international gap. Just before the 1997
Asian crisis, Korea’s labour productivity reached 70% of the Japanese and more than 50 % of the
USA productivity. This strong reduction of the gap was made possible by very high growth rates in
labour productivity registered during the 1980s and 1990s: on average 8% and 10% respectively,
compared with 6% in the 1980s and 3% in 1990s in Japan and the USA (Table 1).
Analysing data at sector level, we see that the so called “catch up effect” experienced by Korea is
more evident in sectors that we can define as characterized by an intermediary technological level,
such as transport equipment, chemical and rubber and basic metals. At the end of 1999, Korean
labour productivity has almost reached Japan one in sectors such as transport equipment and basic
metals and it is closed to USA in chemical products (Graph 2). This increase in productivity may be
explained as a combined result of huge investments undertaken in the 1970s and in the 1980s
during the Heavy and Chemical industry plan (HCI) and of the increased efficient allocation of all
inputs.
Moreover, we can also observe that in these three sectors employment grew slightly during the
1980s and also in the 1990s, as opposed to what happened in the manufacturing sector as a whole,
which has experienced a fall in employment since the beginning of 1990s (Graphs 3 and 4). The
different employment trend experienced in these sectors may be explained by the growth in exports
and the sustained internal consumption, which succeeded in offsetting the reduction in
employment, due to the general introduction of labour-saving technologies, as it is common in all
mature economies.
Regarding the textile sector, in all the three countries analyzed labour productivity shows a very flat
trend. In South Korea, in the 1960s the textile sector was the main responsible of the export boom,
but it started to loose importance from the mid 1980s due to the competition, mainly based on
lower labour cost, from South East Asian countries and China. From the 1980s to the 1990s, the
textile sector fell down from the first position in the manufacturing sector in terms of number of
employees to the second place, with a decrease of about 50% in employment.
4
Gaplabourus is computed by dividing the Korean labour productivity by the USA one and Gaplabourjpn by the
Japanese labour productivity.
4
Finally, in the machinery and equipment sector, although the trend is ascending, productivity is still
lagging behind USA and Japan, and the rate of growth is lower than in the medium tech sectors. In
1999, in this sector labour productivity per hour was 14,7 dollars against 26,7 dollars in the
transport sector and 40 dollars in the chemical sector. It is important to remind that within this
sector Korea, before the Asian crisis, was specialized in labour-intensive or low value added
activities as assembling electronics components or producing semi-conductors (Molini and
Rabellotti, 2001).
To conclude this descriptive analysis of the trend of the South Korean labour productivity, we want
to put forward two general considerations derived from the empirical evidence presented.
The first issue we want to arise is related with the well known debate about the existence or not of
an economic ‘miracle’ in Korea and in general in the Asian Tigers. It is known that Krugman
(1994) and Young (1994) argued that those countries grew without any significant change in the
efficiency in the allocation of the productive factors. We disagree with this thesis because the
reduction of the productivity gap, above all with Japan, a country sharing many similarities with
Korea, may not only be explained by input growth. As a matter of fact, the increase in productivity
is the result of three different effects: a stable increase in value added accompanied by a decrease in
the hours worked in the manufacturing sector from an average of 54 hours in 1970 to an average of
47 in 2000 (ILO-Laborsta, 2003) and by a decrease in the total number of employees in the
manufacturing sector (Graph 3).
Besides, we should consider the increase in the stock of capital. With regard to this, investments in
fixed capital were particularly important in sectors showing high increases in productivity and the
in general the capital/labour ratio increased over the last 20 years (Graph 5). However, the same
trend is observed in many other advanced economies, usually considered more efficient than Korea.
In Korea, the increase in the fixed capital is probably bigger than in other countries but it is not big
enough to completely explain the increase in productivity. A recent analysis (Cheon, 1999) of the
Korean labour productivity from 1970 to 1990, confirms our hypothesis by decomposing the
growth rate of capital per employee, separating the growth rate of capital intensity from the growth
rate of labour intensity (K/L=K/Y-L/Y). The main finding is that during the 1980s, the increase in
capital per employee recorded by Korea was determined by a decrease in the labour coefficient
(L/Y) rather than by an increase in the capital coefficient, confirming a typical case of introduction
of labour saving technologies together with improved efficiency in the production system. Also, in
the 1990s the trend is confirmed.
5
Moreover comparing Taiwan and Korea in different group of sectors, Hsiao and Park (2002)
underline the important contribution of increased efficiency and adoption of improved technology
to explain productivity growth. In particular, in the high-tech sectors of both countries they find
empirical evidence of the strong correlation among efficiency, technology growth and productivity
growth.
The second important issue we wish to focus on is the distribution of the value added. As many
other industrializing countries, at the beginning of its growth process, Korea exploited low wages to
compete in labour intensive sectors. The Korean growth was characterized by a high compression
of wages and, as a consequence, a high remuneration of capital. Keeping low wages, Korea
managed to increase the number of employees without significant changes in the functional
distribution of income, guaranteeing high profits to entrepreneurs. Besides, the government helped
to channel profits into investments and therefore the rate of reinvestment was extremely high,
allowing Korea to move into more advanced sectors, requiring an higher intensity of capital. (Seo
2000). At the same time, the lower value added sectors were progressively abandoned as they could
not guarantee high levels of profits, and investments moved towards more capital intensive and
higher value added sectors.
However, the more a country specialized in capital intensive sectors, the more it requires skilled
workers. Following Lall (1999), we can say that this phenomenon is widely observed in many
successful newly industrialized countries. To sustain international competition, it is not sufficient to
provide cheap labour and it becomes necessary to adapt the industrial system as wages start to rise
due to the combined effect of democratization (increasing importance of free trade unions and free
bargaining) and demographic trends (limited supplies of labour). Lall (1996) finds that Korea is one
of the few developing countries that has learnt to compete in high value added sectors. As we will
see in the next sections, the winning strategy of Korea was to move swiftly from the exploitation of
cheap labour to the creation of a skilled labour force and of “competitive capabilities”. Today, the
skill-level of the Korean labour force is comparable with that of the labour forces in advanced
countries, and wages are higher than in other East Asian emerging countries. We can say that Korea
is in transition towards a system characterized by higher wages to remunerate workers with an
increasing productivity, progressively abandoning a model of specialization based on the
exploitation of cheap labour.
Nevertheless, the transition is not completed and, on average, Korean wages are still far from those
in other OECD countries, as we compare Korea with Japan and the USA (Graph 6). The growth
6
rate of remuneration has remained lower than the growth rate of productivity (Graph 7) and the gap
between compensation and productivity, after a reduction lasting from the end of the 1980s to the
beginning of the 1990s, has begun to widen again in all sectors after 1995. This reversal of the
trend may be explained by the recent reduction of wages due to the liberalization of the job market
begun just before the 1997 crisis, and secondly and by the massive layoffs after 1997, pushing the
unemployment rate at 8%.
The analysis of the functional distribution of value added (Graph 8) confirms that Korea is still far
from the standards of other advanced countries with regard to wages. In fact, comparing the wage
share5 (total labour compensation, as defined by OECD, divided by net value added) in Korea,
USA and Japan the Korean one is far lower than the 60-70%, generally observed as empirical
evidence in the Cobb-Douglass function (Pinketty 2003). In Korea in all the sectors considered, the
average wage share is lower than 60% and besides, it has been falling since 1995.
To conclude, we can say that Korea managed to reduce the productivity gap with more advanced
countries but, unlike Japan and the USA where the growth of labour productivity is associated with
a sustained growth in labour compensation, Korea has kept wages comparatively low, preserving
the gap between productivity and compensation at 40%. From this point of view, the changes in the
direction of increasing wages occurred at the beginning of 1990s have been rapidly offset by the
labour market liberalization and by the 1997 crisis that have compressed downward wages (Graphs
6 and 7).
3
Skills and capabilities
The idea that skills and human capital are fundamental to economic development and to the
competitiveness of developing countries is of long standing. However, in the past skills were often
treated as a generic factor, such as the product of the education system, and usually measured by
the years of schooling. The insight that skills are directly linked with the technology used, and that
the acquisition of technology is not costless and requires some previous knowledge, has been
systematically ignored (Lall, 2000a). Conventional theory doesn’t assign any explicit role to
technology and skills in the creation of comparative advantages. According to the neoclassical
static perspective, in order to exploit their comparative advantages, countries should rely on their
factor endowments, and any attempt to change their composition or to invest in new sectors (with
5
In the appendix we present the profit share. The profit share is the reciprocal of the wage share (1-wageshare)
7
government support) is a priori deemed inefficient. According to this view, all economies benefit
from whatever international specialization, provided that it is consistent with their pattern of
comparative advantage (Krugman, 1996).
Moreover, in mainstream economics the problem of technology acquisition is usually
underestimated. Markets are assumed efficient and in the transfer of technology the only costs
accounted for are the purchase of machinery or patents. Therefore, when a firm buys the
machinery, no extra costs are assumed to be paid for learning how to efficiently use it. Also, there
is not any clear distinction between acquiring capacity (physical plant or potential output) and
capability (the ability to use it efficiently).
Some recent literature on technology (Bell, Pavitt 1992) takes a different approach, stressing that
much of the productivity gains from introducing an innovation are generated by small cumulative
adaptations within firms, based on a “learning-by-doing” process. In certain cases initially, new
technologies may be even less productive than older ones, until when the technology is adapted and
modified to satisfy the specific needs of the firm (Tan and Batra, 1996). Moreover, insofar as we
admit the possibility of inter-firm (intra-sector) differentials (for example related to market
imperfections, information asymmetries, firm-specific learning and capabilities), that are ruled out
by the neoclassical theory of comparative advantage, then competitiveness becomes a more
meaningful, and indeed relevant concept (Lall, 2001b). Further, this approach allows consideration
of ‘dynamic’ comparative advantage, i.e. acquired through the purposeful efforts of enterprises, and
in sectors different from those enjoying static comparative advantage (Pietrobelli, 1997).
Therefore, the present discussion of alternative “roads” to competitiveness refers to the
macroeconomic implications of enterprise-level strategies. From the point of view of the individual
enterprise, it could be (statically) optimal to become competitive by squeezing costs (including
labor costs), but this would not be desirable i.e. high road, from the point of view of the country (or
the region/cluster).
This is a key issue for catching up in developing countries. Firms may initially based their
competitiveness on squeezing costs (including labour costs), but this could not be desirable in the
long run from the point of view of the country. Firms, especially from developing countries, are
increasingly engaged in a “race to the bottom” to be competitive in global and open markets. They
often compete by squeezing wages and profit margins rather than by improving productivity, wages
and profits. This process has been defined the “low road” to competitiveness, and it is one of
immiserising growth: overall economic activity increases, but its returns fall.
8
A thoroughly different process is one of increasing and improving participation in the global
economy, realizing sustained income growth. This may be defined as the “high road” to
competitiveness. In order to follow this road, countries needs to create the basis for continuous
improvement of the quality and technology content of their exports.
To move from the “low road” to the “high road” to competitiveness, an essential condition is the
acquisition of new skills and capabilities at various different level: manual, technical, scientific and
managerial. Lall (1999) usefully distinguishes between two types of skills and capabilities: skills
developed through formal education and capability accumulation through formal and informal
training.
The first is the result of the specific education policy of a country and its strategic choices. Basic
schooling and literacy may be sufficient to compete in low technology sectors while higher levels
of education, such as secondary or tertiary schooling, are required the more a country specializes in
higher value added productions (Lall, 2000a). In particular, when a country tries to move up on the
technological ladder, it becomes strategic to focus on secondary and tertiary technical education.
According to Lall (1999), in the first stages of development it is key to invest in vocational
secondary education, while at later stages, technical skills becomes crucial. Therefore, the number
of graduates in technical subjects, as engineering, natural science and mathematics is a key
indicator for assessing the capacity of a country to absorb new technologies or to compete in high
value added sectors.
The second source of skills is enterprise training, distinguishing between formal and informal
training, and between internal and external training (Tan and Batra, 1996). Formal training is
provided through courses and periods of training or retraining, while informal training is normally
provided on-the-job by co-workers and supervisors. The second distinction refers to the source of
the training, external training is provided by other enterprises, while internal is provided inside the
firm. Tan and Batra (1996), comparing data at firm-level on 5 developing countries, concludes that
training has a positive impact on labour productivity and particularly, skilled workers’ productivity
increases at higher rates than that of the unskilled. The authors stress this point since it has
important political implications. The more a country invests in the education system, the more it
creates the pre-conditions for successful firm-level training and for shifting from general skills to
the specific capabilities needed to increase productivity.
In conclusion, the creation of skills is a priority condition in order to succeed in the process of
catching up and to increase its skill level a country requires investments in every level of education,
9
with a particular attention to technical and scientific education; furthermore, firms which should be
encouraged and supported in training workers and developing on the job-capabilities.
4
Korea and the educational system
In the literature, Korean education system and the availability of skilled labour force are among the
most often quoted factors, explaining the long, sustained and continuous process of economic
growth (Rodrick, 1995). Korea achieved universal primary education in 1960 and then it continued
to upgrade the education level of its population. In the 1990s, 95% of pupils who graduated from
primary school were enrolled in “middle school” (3 years), and afterwards 93% of them proceeded
to high school. Education is compulsory until the age of 14; it is free in rural areas while people
living in urban areas have to pay a small fee. At higher levels of education, since most of the high
schools and universities are private (60% and 80%, respectively), students pay a tuition fee.
Nevertheless, the central government together with local administrations provides grants to low
income students who otherwise will not afford to attend (Tzannatos, Johnes 1997).
The high rates of school enrollment are reflected in the skills of the labour force. During the 80’s,
the share of employees with secondary education increased rapidly and in 1990s it overtook the
share of people with only ‘middle’ education. In 2002, 44% of the employees has a secondary
education (general or vocational high school) (Table 2).
However, the performance in tertiary education is even more dramatic: in 1980 only 1 million of
Korean workers had a university degree and after 20 years, this number has increased six-fold. In
2002, the share of employees with a university degree (27%) is very closed to the share of workers
with a middle school degree (29%) (Table 2).
Within the schooling system, vocational and technical education has been traditionally considered
as a priority. About 40% of high school graduates come from vocational high school, in particular
technical schools. In the 1990s, the vocational schools have been reformed, going from a three year
curriculum to a “two-plus-one” system, with one year of training spent working in firms. This
system, supervised by the Ministry of Labour, provides students with on-the-job training at half of
the minimum wage and participating firms are eligible for tax relief and subsidies (Tzannatos,
Johnes 1997).
With regard to the tertiary level, students may choose a four year curriculum or they may attend a
junior college where there are more professionally oriented curricula of 2-3 years. 40% of high
10
school graduates goes to university, and among those a high share prefers technical and scientific
subjects. Korea is first in the world in terms of enrollments in engineering relative to total
population, and third, among developing countries, in terms of enrollments in technical subjects,
after China and India (Lall, 1999). The share of graduates in natural science on total graduates
increased from 7% in 1975 to 11% in 1999.
Finally regarding training within the firms, Korea had a system, recently changed, to induce firms
to train their workers. Each firm with more than 150 employees had to submit every year a training
plan to the Ministry of Labour. The plan should specify the number of workers needing additional
training and on these information, the Ministry decided the share of workers who should receive
training (the so called training coefficients). If firms trained less workers than previewed, they
should pay extra taxes (Fairclough, 1994).
To conclude, in the first stages of economic development Korea has massively invested in
secondary technical education, to satisfy a large and increasing demand for medium skilled
workers. Then at more advanced stages of development, the resources were allocated more on
tertiary technical education in order to support the expansion of medium and high tech sectors.
5
The model
We test a non-neoclassical function of labour productivity in 5 main manufacturing sectors between
1975 and 1999. We have not adopted a neoclassical approach to the productivity estimation and
have not used a Cobb-Douglas function or any augmented version thereof because of some
concerns on its very restrictive assumptions (Garegnani 1970, Pasinetti 1966 and Sylos-Labini
2001).
The main problem is that in a Cobb-Douglas function there is not an inverse monotonic relationship
between capital (in value or physical terms) and the rate of profit (or interest). This relationship
regards either entire economic systems or a single enterprise, and it depends on the phenomenon of
re-switching of techniques (Harcourt, 1972). The point is that while it is possible that a certain
technique may be the most convenient at some levels of profit (or interest) rate, it is not necessarily
so at higher levels.
Moving on from a one good model to multiple goods, it raises another theoretical problem related
with the independence of the value of capital on its returns. The economists of the “heterodox
Cambridge” demonstrated that the independence is illogical because, since all capital goods are
11
produced, as it happens for every good, their prices depend on the income distribution (Sylos
Labini,1995). In order to avoid this problem, we use the operating surplus, obtained from the value
added less labour compensation, taxes and depreciation, as a proxy for capital. This indicator does
not fall in this fallacy because profits are determined residually. Our hypothesis is that the operating
surplus should be positively correlated to productivity growth, because of the high rate of profit
reinvestment in Korea.
Moreover as it is well known, in the neoclassical framework returns to scale are assumed to be
constant, so that Euler’s theorem can be applied. Nevertheless, increasing returns are a very
common situation in economic systems and especially in the manufacturing sector, which is the
focus of our analysis (Kaldor 1972). In a dynamic perspective, increasing returns are very
important in the manufacturing sector, because of economies of scale in individual enterprises
(Kaldor 1972) and endogenous and cumulative growth in sectors (Young 1928). Therefore, if we
want to admit the possibility of increasing returns, it is impossible (unless making unsustainable
assumptions) to maintain the neoclassical hypotheses of homogeneity and convexity of the
production function, fundamental in the Cobb-Douglas. If we do not assume the convexity of the
function, the sum of the coefficients can exceed one. This result is consistent with the most recent
literature on endogenous growth (Lucas, 1988; Romer, 1990).
Finally, neoclassical theory does not deal with technological progress in a very satisfying way. On
this point there is a wide literature (Pietrobelli, 1998; Lall, 2001; Dosi et al., 1989; Nelson, 1981).
Here we only want to remind that technology is not instantaneously and costleessly accessible to
any firm. Knowing, adopting and absorbing new technologies is an expensive process in terms of
economic resources, access to information and time. Moreover, different countries and enterprises
may adopt very different technologies and each economic actor has a limited possibility of choice,
influenced by political, social, economic and cultural conditions. Within this context, technology
transfer is an important issue that depends on the country’s capability to make use of technology,
absorb it and adapt it to local conditions. In our model we want to test the role played by technical
skills and capabilities in Korea, using more specific proxies than a generic “human capital”
indicator, usually calculated as the average years of schooling.
For all these reasons, we test a function of labour productivity with less restricitive assumptions
than in the neoclassical model. The model considers labour productivity in 5 economic sectors
between 1975 and 1999. The equation, expressed in the additive form using a logarithmic
transformation at first differences, is the following:
12
∆ log laborprod it = β 0 + β 1 ∆ log wageskillsit + β 2 ∆ log uesetet + β 3 ∆ log opsurplus1995 it
+ β 4 ∆ log gradnspopt + β 5 + ε it
(1)
The dependent variable is:
Dloglaborprodit = rate of growth of labour productivity (in 1995 Won6) per hour worked in each
manufacturing sector (i) for each year (t) (data source: OECD-STAN 2003).
Labour productivity is calculated as follows:
(Labour Productivity) it =
( Total value added) it
(number of workers) it × (hours worked yearly)it
(2)
The independent variables are:
Capabilities- Skill variables:
Dlogwageskillsit = rate of growth of wage differential (in 1995 Won) between each sector (i) and
the average in all manufacturing sectors, per hour worked every year (t) (data source: OECDSTAN 2003):
(labour compensation per worker) it =
(wage differential) it =
( Total labour compensation ) it
(3)
(number of workers ) it × (hours worked yearly)it
( labor compensation per worker) it
n labor compensation per worker
∑
n
i =1
n= all manufacturing sub-sectors (4)
t
This variable is a proxy for the different levels of skills across the selected sectors. The larger the
wage differential relative to the average manufacturing wage, the more skills are required to be
employed in that sector. This variable changes across sectors as it does not capture general
6
Won is the currency of South Korea.
13
technical skills, but rather those skills directly related with the specific sectors. The variable might
also capture the level of unionization, but we could not to correct for this effect since data on
unionization are only available from the mid 1990s and are not very reliable. Differently from other
studies, we do not use the share of wages received by non-manual workers on total wage payments.
The reasons for not adopting this indicator are the following: this variable includes many low
skilled service jobs as janitors, cleaners or simple clerical jobs, while excluding skilled manual
workers and supervisors (Cheon 1999) and therefore, by concentrating on non-manual workers, this
measure rules out changes in productivity related with skills of manual workers.
Dloguesetet = growth rate of the number of technical school graduates relative to total graduates
from secondary school for each year (t). This is a modification of an UNESCO (2000) indicator,
using the number of graduates, in order to have a proxy of new entrants in the labour market with a
secondary technical education (data source: National Statistical Office).
Dloggradnspopt = growth rate of the university graduates in natural science and engineering
relative to total graduates in the same year (t). For data before 1985, the variable is reconstructed
using the number of enrolled. This variable is a proxy for high technical skills. Others possible
proxies, as R&D expenditures and the number of researchers, have resulted highly correlated with
our variable (data source: National Statistical Office).
The control variables are:
Logprodk_1it = level of output in each sector measured by an index lagged one year (1995=100).
This is an indicator of the size of market and it captures the Verdoorn’s effect (Verdoorn, 1956).
Accordingly, in each sector an increase in total output should lead to a rise in labour productivity as
the increased size of the internal market is an incentive to invest (data source: OECD-STAN 2003).
Dlogopesurplus1995it = growth rate of the operating surplus (calculated as: value added –
labourcompensation - taxes + subsidies – depreciation) in each sector at 1995 prices. Using a nonneoclassical approach, the operating surplus is a proxy for investment. In South Korea, as we
mentioned above, the rate of profit reinvestment is very high. Moreover, the operating surplus
provides an idea of the distribution of the value added across input factors. In this way, we measure
14
the capital invested without falling into the fallacy of the capital measurement, discussed above
(data source: OECD-STAN 2003).
6
Methodology and econometric results
Table 3 presents the results of the econometric analysis. The model is expressed in the additive
form using a logarithmic transformation at first differences (1). This model has been chosen among
other specifications because it allows overcoming some possible shortcomings of alternative
formulations.
An equation in levels would raise the problem of trended series. Therefore, we have taken the
differences of the logarithms to obtain a stationary process for all the series. The Dickey Fuller Test
has been used to test that all series do not have unit roots. As we are interested in the determinants
of productivity growth, this method allows explaining the dynamics of the process and not only the
levels of productivity.
After first differencing the logarithms and dropping missing observations, our sample was reduced
at 119 observations, 24 for each sector except for textiles (23 observations). Hence, we aggregated
the time series for the different sectors to create a cross-sectional time series.
We can reject the heterogeneity hypothesis, as all series are in first-differences to have a stationary
process. As we are interested in the dynamics of labour productivity rather than in the analysis of
heterogeneity elements, we do not loose any information.
The model is estimated with a Pooled-Ordinary Least Square regression. According to the Ramsey
test, the model is well specified and all the hypotheses required for OLS estimators are verified.
The residuals are homoskedastic, normally distributed and non auto-correlated.
All variables are statistically significant and positively correlated with the rate of growth of labour
productivity. As a whole, the model explains well the variation of the rate of growth of labour
productivity per hour (R2= 0.74). The signs of the coefficients are consistent with our hypotheses
and as expected, the proxies for skills and capabilities strongly influence the rate of growth of
labour productivity.
Dlogwageskills and Dloguesete have the highest coefficients, confirming that improvements and
investments in skills and capabilities support steep rises in labour productivity. In particular, this
confirms the importance of on-job skills and secondary technical education. In Korea, the massive
increase in productivity can be explained by the abundant availability of technicians and workers
with a middle education and by the very efficient system of training. Moreover, based on our
15
empirical findings we can draw the conclusion that among investments in human capital,
investments in secondary technical education are particularly effective. As our model shows,
productivity increases as the total number of technicians and the share of employees with technical
secondary education rise.
The value of the coefficient of the proxy for more advanced skills is lower than expected. This can
be explained by the fact, previously discussed, that high skills only become crucial in the second
phase of development, when a country manages to produce and innovate its own technology. In
order to test this hypothesis, we have multiplied the two skills variables (Dloguesete and
Dloggrandspop) by two time dummies, for the periods 1975-1987 and 1988-1999, in order to
divide the sample in two sub-periods. Doing so, we have tested if the two variables have had
different impacts in the two sub-periods. The coefficient of tertiary technical education in the
second sub-period (1988-1999) is around 4 times that of the first period, while in the case of
secondary technical education the difference between the two coefficients is less evident (Table 3).
This confirms the hypothesis that the more the country specialization shifts towards high
technology sectors, the more it becomes important the role played by high skills and particularly by
university education. In Korea, this leap forward has been observed since the end of the 1980s.
From then, with an increasing domestic demand for high skills more students attend university and
particularly study technical and scientific subjects.
Other proxies for high skills as private research expenditures, government expenditures in research
and number of researchers have been also tested. All of them are significant, but they could not be
included in the model because of obvious problems of multicollinearity.
With regard to control variables, the operating surplus is correlated with productivity, confirming
that the reinvestment rate of profits is high and efficient in the Korean private sector. As expected,
the more the profits increase the more they are reinvested, making the Korean economy more
competitive and efficient.
Finally, the large size of the Korean domestic market allows for the increase in labour productivity
growth, as the Verdoon theory predicts (Sylos Labini, 2001). The growth of the domestic market,
together with the increasing presence in the international markets, pushed the Korean economy to
stay competitive and reduce the productivity gap with more advanced countries.
16
7
Conclusions
In this paper we investigate the determinants of productivity growth in South Korea in the last two
decades, adopting a non-neoclassical model.
Comparing the performance of South Korean labor productivity with Japan and USA as
international benchmarks, the data confirm a process of catching-up effect in several important
manufacturing sectors. Particularly, the gap reduction is more evident in the medium technology
sectors rather than in the more advanced ones; among those, the best performance is in the
chemical and oil sectors.
We have also analyzed the distribution of value added in order to understand if Korea is still
exploiting cheap labor to compete in international markets or it is moving towards a model with
higher salaries and a more skilled labor force. Compared to Japan and USA, the functional
distribution is more skewed in favor of capital remuneration and the wage share is still lower than
the average in old industrialized countries. Therefore, we can conclude that Korea is still in
transition towards a more advanced system of industrial relations, more similar to other advanced
countries.
After having analyzed the labor productivity performance, we investigate its main determinants.
Following Lall (1996), we investigate if the investments in education and, particularly, in technical
education, undertaken by Korea during the last 30 years, are somehow related to the growth in
labour productivity. The hypothesis of the importance of technical education on the increase in
labor productivity is tested with a non neoclassical productivity function to overcome some of the
many shortcomings and to avoid the very restrictive assumptions (free technology acquisition,
constant returns to scale, an inaccurate and fuzzy definition of capital) of the Cobb-Douglas
functio. The model is tested including some proxies for capabilities and skills.
The econometric results are consistent with our hypotheses. Both skills and capabilities are
positively correlated with labor productivity and are also statistically significant. The implication of
this result is that the more a country invests in education the more it creates the conditions to create
domestic capabilities and skills and, as a consequence, the faster is the process of catching up with
more advanced countries.
This has an important policy implication for developing countries. In the long run, a targeted
education policy with some government involvement and a strong emphasis on technical education
can give high pay offs to a country aimed at competing in the international market not along the
17
low road to competitiveness, based on squeezing wages and profit margins but along the high road
(i.e. improving productivity, wages and profits).
Bibliography
Bell M.; Pavitt K., 1992: “Accumulating Technological Capability in Developing Countries,
Proceedings”, World Bank Annual Conference on development Economics, Washington: The
World Bank.
Cheon B.Y., 1999: “Employment, occupations and skills in increased international exposure The
republic of Korea 1970-1990”, ILO Employment and Training Papers, No. 39, Geneva:
International Labour Office.
Fairclough G., 1994: “Failing grade”, Far Eastern Economic Review, 29 September, pp. 62-64.
Garegnani P., 1970: “Heterogeneous capital, the production function and the theory of
distribution”, Review of Economic Studies, vol.37, pp.407-36.
Harcourt G.C., 1972: “Some Cambridge controversies in the theory of capital”, Cambridge:
Cambridge University Press.
Hsiao F.S.T.; Park C., 2002: “Productivity Growth in the Newly Developed Countries-The case of
Korea and Taiwan”, The Journal of the Korean Economy, Vol 3, No.2 (Fall 2002), pp. 189-230.
Kaldor N., 1972: “The irrelevance of equilibrium economics”, Economic Journal, vol.82, pp.123755
Katz J., 2000: “Structural change and labor productivity growth in Latin American manufacturing
industries 1970-96”, World Development, vol. 28, no. 9, pp. 1583-1596.
Krugman P., 1994: “The Myth of Asia’s Miracle”, Foreign Affairs November/December 1994
Lall S., 1996: “Learning from Asian Tigers, Studies in Technology and Industrial Policy”, London:
Mac Millan Press
Lall S., 1999: Competing with labour: skills and competitiveness in developing countries, ILO
Issues in development Discussion paper No.31 Geneva: International Labour Office
Lall S., 2000a: “Selective Industrial and trade policies in developing countries: theoretical and
empirical issues”, QEH Working paper series No.48, University of Oxford.
Lall S., 2000 b: “The technological structure and performance of developing country manufactured
exports, 1985-1998”, QEH Working paper series No.44, University of Oxford.
Lall S., 2001a: “Competitiveness Technology and Skills”, Cheltenham: Edwar Elgar Publishing
18
Lall, S. 2001b “Competitiveness Indices and Developing Countries: An Economic Evaluation of
the Global Competitiveness Report”, World Development, 29(9), 1501-25.
Lucas R., 1988: “On the mechanics of economic development”, Journal of Monetary Economics,
vol.22, pp. 3-42.
Molini V., Rabellotti R., 2001, “Something New, Something Old: The South Korean Economy
after the Financial Crisis”, in Weber M, ed., Reforming Economic Systems in Asia, Cheltenham:
Edward Elgar Publishing.
Moon S. H., 2001: “The skill wage differential of Korea after the 1980s: the effects of supply,
demand and international trade”, 1981-99 in: http://home.uchicago.edu/~moon/koreawage.pdf
Nelson R., 1981: “Research on productivity growth and productivity differences: Dead ends and
new departures”, Journal of Economic Literature, 19, 1029-64.
Pangestu M., 2000: “Social impact of Globalization in Southeast Asia” paper presented at the
OECD Conference “Poverty and Income Inequality in Developing Countries” in
http://www.oecd.org/pdf/M00021000/M00021005.pdf
Pasinetti L., 1966: “Changes in the rate of profits and switches of techniques”, Quarterly Journal of
Economics, vol.80, pp.503-17
Pietrobelli C. 1997: “On the Theory of Technological Capabilities and Developing Countries’
Dynamic Comparative Advantage in Manufactures”, Rivista Internazionale di Scienze
Economiche e Commerciali, Vol.XLIV, No. 2, June.
Pietrobelli C., 1998: “Industry, Competitiveness and Technological Capabilities in Chile. A New
Tiger from Latin America?”, London and New York: Macmillan and St.Martin's
Piketty T., 2003: “Disuguaglianza, La visione economica”. Milano: Università Bocconi EditoreEGEA.
Romer P.M., 1990: “Endogenous Technological Change”, Journal of Political Economy, vol.98,
pp. S71-S102.
Seo H.J., 2000: “La Corée du Sud-Une Analyse Historique du Processus de Développement”,
Paris: L’Harmattan,.
Sylos Labini P., 1995: “Why the interpretation of the Cobb-Douglas production function must be
radically changed”, Structural Change and Economic Dynamics, vol.6, pp.485-504.
Sylos Labini P., 2001: “Underdevelopment, A Strategy for Reform”, Cambridge UK: Cambridge
University Press,
Rodrick, D., 1995: “Getting interventions right: How South Korea and Taiwan grew rich”,
in http://www.nber.org/papers/w4964.pdf
19
Tan H.W.; Batra G., 1996: “Enterprise training in developing countries. Overview of Incidence,
determinants and productivity outcome” Private sector development department Occasional Paper
No.9 World Bank, Washington: The World Bank
Tzannatos Z.; Johnes G., 1997: “Training and Skills Development in the East Asian Newly
industrialized countries: a comparison and lessons for developing countries” Journal of Vocational
Education and Training, Vol 49 No.3
Verdoorn P.J., 1956: “Complementarity and Long–Range Projections”, Econometrica, 24, pp. 429450
Young A., 1928: “Increasing returns and economic progress”, The Economic Journal, vol. 38,
pp.527-42
Young A., 1994: “Lessons from the East Asian Countries: A Contrarian View”, European
Economic Review, n.38
UNESCO 2000: “Education Indicators-Technical guidelines” in www.unesco.org
For Datasets
ILO-Laborsta-Statistics on Labor (2003) in www.ilo.org
OECD-STAN Database (2003) in www.oecd.org
National Statistical Office, Republic of Korea in: www.nso.go.kr
20
Appendix
Graph 1: Gap of Labour Productivity per Hour: South Korea vs. USA (gaplabourus) and Japan (gaplabourjpn)
(1975-1999)
gaplabourus
gaplabourjpn
.72
.6
.5
.4
.3
.19
1975
1980
1985
1990
1995
1999
year
Source: OECD-STAN
Table 1 : The rate of growth of labour productivity during the 1980s and the 1990s
1980-89
USA
Mean
Std. Deviation
Min
Max
6.310976
3.805838
-.4477024
10.76341
6.531973
5.29518
-1.351833
14.92891
8.62658
6.012904
-1.243782
16.49594
USA
3.536728
2.608585
-.0337839
6.878209
JAPAN
3.42945
-2.119923
10.42852
SOUTH KOREA
10.33113
3808975
17.70635
JAPAN
SOUTH KOREA
1990-99
3.696292
4.486479
Source: OECD-STAN
21
Graph 2: Gap of Labour Productivity per Hour at sector* level: South Korea vs. USA and Japan (1975-1999)
la b o u rp ro d u s a
la b o u rp ro d k r
la b o u rp ro d jp n
nc==1
nc==2
nc==4
nc==5
nc==3
.0 8
.0 6
.0 4
.0 2
0
1975
1980
1985
1990
1999
.0 8
.0 6
.0 4
.0 2
0
1975
1980
1985 1990
1999
1975 1980 1985
1990
1999
Source: OECD-STAN
*Legenda:
Nc =1: Basic metals and fabricated metal products
Nc=2: Chemical rubber plastics and fuel products
Nc=3: Machinery and Equipment
Nc=4: Textiles
Nc=5: Transport Equipment
22
Graph 3- Employment in the Korean manufacturing sector (thousands): 1975-1999
number of employed in thousand
5026
2175
1975
1980
1985
1990
1995
1999
year
Source: OECD-STAN
Graph 4: Employment in some selected Korean manufacturing sectors (1995-99)
(thousands)
Source: OECD-STAN
*Legenda:
Nc =1: Basic metals and fabricated metal products
Nc=2: Chemical rubber plastics and fuel products
Nc=3: Machinery and Equipment
Nc=4: Textiles
Nc=5: Transport Equipment
23
Graph 5: Capital/labour ratio (K/L), Capital/Value added ratio (K/Y) and Labour/Value added ratio (L/Y)
K/L
K/Y
20
00
19
98
19
96
19
94
19
92
19
90
19
88
19
86
19
84
19
82
19
80
19
78
19
76
19
72
19
70
100000
10000
1000
100
10
1
0,1
0,01
0,001
0,0001
0,00001
19
74
(logarithms) 1970-2000
L/Y
Source OECD-STAN
Graph 6 : Labour compensation per hour in PPP: USA Japan and South Korea 1975-1999
lab h o urc om p p u sa
lab o u rh o u rc om k r
lab o u rh o u rc om jp n
nc = =1
nc = =2
nc = =4
nc = =6
nc = =3
.0 3
.0 2
.0 1
0
1975
1980
1985
1990
1999
.0 3
.0 2
.0 1
0
1975
1980
1985
1990
1999
1975
1980
1985
1990
1999
Source OECD-STAN
24
Graph 7 : Labour productivity per hour and labour compensation per hour in thousand won 1995 by sector:
1975-1999
la b o u r p ro d k r
la b o u r h o u r c o m k r
nc==1
nc==2
nc==4
nc==6
nc==3
.0 4
.0 3
.0 2
.0 1
0
1975
1980
1985
1990
1999
1985
1990
1999
.0 4
.0 3
.0 2
.0 1
0
1975
1980
1985
1990
1999
1975
1980
1985
1990
1999
Source OECD-STAN
Graph 8 : Profit rate: South Korea vs. USA Japan (1975-1999)
p ro fitra te u s a
p ro fitra tk o r
p ro fitra te jp n
nc = =1
nc = =2
nc = =4
nc = =6
nc = =3
.9 5
.7 5
.5 5
.3 5
.1 5
0
1975
1980
.9 5
.7 5
.5 5
.3 5
.1 5
0
1975
1980
1985
1990
1999
1975
1980
1985
1990
1999
Source OECD-STAN
25
Table 2 : Share of employees by educational attainment
Middle school &
under (%)
College, univ.
High school (%)
graduates & over
(%)
1980
71
22
7
1985
59
31
10
1990
48
38
14
1995
37
44
19
2000
31
44
25
2001
30
44
26
2002
29
44
27
Source: National Statistical Office
26
Table 3: Tested models
Variables
Dlogwageskillsit
Equation 1
Equation 1 with
dummies
.6920702*
.6982319*
Dloguesetet
.786615*
-
Dloggraddnspopt
.2032406*
-
Dlogoperatingsurplus 1995it
.2191091*
.2222663*
logprodk_1it
.0239355*
.0169321*
Dloguesete 75-87 t
-
.7184158*
Dloguesete 88-99
-
.8492243*
Dloggraddnpop 75-87t
.2032406**
Dloggraddnpop 88-99
.1435975*
_cons
-.0631422*
-.0409193*
R^2
0.74
0.7523
*Significant at 5%level
**Significant at 10% level
27
View publication stats
Academia.edu no longer supports Internet Explorer.
To browse Academia.edu and the wider internet faster and more securely, please take a few seconds to upgrade your browser.
Is Korea catching up? An analysis of the labour productivity growth in South Korea
Oxford Development Studies, 2006
...Read more
Related Papers
Download

Download

Journal of Development Economics, 1995
Download


World Development, 2010
Download

Journal of Productivity Analysis, 2005
Download
Citeseer
Download

Journal of Asian Economics, 2003
Download
OECD Economics Department Working Papers, 2012
Download


Journal of Global Intellectual History, 2023
Download

Download


