Hindawi
BioMed Research International
Volume 2018, Article ID 2786163, 11 pages
https://doi.org/10.1155/2018/2786163
Research Article
Unsupervised versus Supervised Identification of Prognostic
Factors in Patients with Localized Retroperitoneal Sarcoma:
A Data Clustering and Mahalanobis Distance Approach
Rita De Sanctis ,1,2 Alessandro Viganò,2,3 Alessandro Giuliani,4
Alessandro Gronchi,5 Antonino De Paoli,6 Pierina Navarria,7 Vittorio Quagliuolo,8
Armando Santoro,1,9 and Alfredo Colosimo 2
1
Department of Medical Oncology and Hematology, Humanitas Cancer Center and Research Hospital, IRCCS, Rozzano,
Milan, Italy
2
Molecular and Cellular Networks Lab, Department of Anatomy, Histology, Forensic Medicine and Orthopaedics,
“Sapienza” University of Rome, Rome, Italy
3
Department of Neurology and Psychiatry, “Sapienza” University of Rome, Rome, Italy
4
Department of Environment and Health, Istituto Superiore di Sanità, Rome, Italy
5
Department of Surgery, Fondazione IRCCS Istituto Nazionale dei Tumori, Milan, Italy
6
Department of Radiation Oncology, Centro di Riferimento Oncologico, National Cancer Institute, Aviano, Italy
7
Department of Radiotherapy and Radiosurgery, Humanitas Cancer Center and Research Hospital, IRCCS, Rozzano, Milan, Italy
8
Department of Surgery, Humanitas Cancer Center and Research Hospital, IRCCS, Rozzano, Milan, Italy
9
Humanitas University, Rozzano, Milan, Italy
Correspondence should be addressed to Rita De Sanctis; rita.desanctis@yahoo.it
Received 28 September 2017; Accepted 12 March 2018; Published 23 April 2018
Academic Editor: Maria C. De Rosa
Copyright © 2018 Rita De Sanctis et al. This is an open access article distributed under the Creative Commons Attribution License,
which permits unrestricted use, distribution, and reproduction in any medium, provided the original work is properly cited.
The aim of this report is to unveil specific prognostic factors for retroperitoneal sarcoma (RPS) patients by univariate and
multivariate statistical techniques. A phase I-II study on localized RPS treated with high-dose ifosfamide and radiotherapy followed
by surgery (ISG-STS 0303 protocol) demonstrated that chemo/radiotherapy was safe and increased the 3-year relapse-free survival
(RFS) with respect to historical controls. Of 70 patients, twenty-six developed local, 10 distant, and 5 combined relapse. Median
disease-free interval (DFI) was 29.47 months. According to a discriminant function analysis, DFI, histology, relapse pattern, and
the first treatment approach at relapse had a statistically significant prognostic impact. Based on scientific literature and clinical
expertise, clinicopathological data were analyzed using both a supervised and an unsupervised classification method to predict
the prognosis, with similar sample sizes (66 and 65, resp., in casewise approach and 70 in mean-substitution one). This is the first
attempt to predict patients’ prognosis by means of multivariate statistics, and in this light, it looks noticable that (i) some clinical
data have a well-defined prognostic value, (ii) the unsupervised model produced comparable results with respect to the supervised
one, and (iii) the appropriate combination of both models appears fruitful and easily extensible to different clinical contexts.
1. Introduction
Retroperitoneal sarcomas (RPS) are a peculiar soft tissue
sarcoma (STS) subgroup including 4 or 5 subtypes and an
expected incidence of less than 1 case per 100,000 inhabitants/year [1–4]. Although surgery is the standard treatment
for localized lesions [5–13], the role of radiation therapy (RT)
in RPS is not fully defined as of yet. In order to complement
surgery, the use of preoperative and intraoperative RT is
under increasing investigation. In addition, chemotherapy
(CT), concurrent to RT, could have a radiosensitizer effect
and a precautionary role in eradicating micrometastases,
thus increasing the therapeutic index of RT alone [14,
15].
�2
The analysis of prognostic factors and risk stratification,
in order to decide the better therapeutic approach, is still
pivotal in patients with rare tumors; moreover, the usefulness
of the few tools available to predict good or poor prognosis is
not completely defined [16].
In this contribution, we present an exploratory univariate
analysis of possible disease predictors as well as a multivariate
prognostic model for RPS based on discriminant function
analysis (DFA), Mahalanobis distance (MD), and decision
trees (DT) classification. An unsupervised approach in the
analytical strategy showed a comparable efficiency with
respect to a supervised one, which is suggestive of their
possible combined use in clinical practice.
2. Materials and Methods
2.1. Clinical Data. Clinicopathological data about RPS were
obtained from patients treated at three Italian referral centers according to the protocol Italian Sarcoma Group-Soft
Tissue Sarcoma Trial 0303 (ISG-STS0303; EudraCT number: ITASARC ∗ II 2004 003) between December 2003 and
December 2010. At the end of this protocol, patients underwent further follow-up, thus collecting further information
concerning (i) pattern of relapse (local and/or distant), (ii)
disease-free interval (DFI), and (iii) postrelapse outcome
(type of treatment at recurrence, response rate according
to RECIST (Response Evaluation Criteria in Solid Tumors)
criteria [17], and postrelapse survival).
Institutional databases from the 3 main participating
enrolling centers (Fondazione IRCCS Istituto Nazionale dei
Tumori, Milan, Italy; Humanitas Research Hospital, IRCCS,
Rozzano, Milan, Italy; and CRO, IRCCS, Aviano, Italy)
allowed updating the follow-up of 70 patients operated on
with a median follow-up time from surgery of 91.7 months
(interquartile range (IQR): 72.5, 111.3 months). Patients lost to
follow-up were excluded from the analysis. Male/female ratio
was 1.25 : 1. Median age was 58.5 years (range: 27–75). The
patients’ distribution among six relevant clinical descriptors
is reported in Table 1.
Notice that, for the 70 patients considered in Table 1,
the following information was also available: type of resection (macroscopically complete or incomplete, multivisceral
surgery), adjuvant therapies, percentage of necrosis of the
surgical specimen, DFI, relapse pattern (local and/or distant),
first type of treatment at recurrence (first-line chemotherapy
regimen, best response and RT), and further treatments
(second-line chemotherapy regimen, best response, and further CT lines).
41 out of the 70 patients included in the study developed
local (𝑛 = 26) or distant (𝑛 = 10) or both local and distant
(𝑛 = 5) relapse. Main histological relapsed subtypes were
dedifferentiated liposarcoma (14 out of 41, 34%), leiomyosarcoma (10, 24%), well-differentiated liposarcoma (6, 14%),
and NOS (not otherwise specified) sarcoma (6, 14%). Median
DFI was 29.47 months. Patients with any local relapse (with or
without distant disease) presented an infield (23/31), outfield
(4/31), or mixed (4/31) recurrence. Among patients with
only local relapse, 16/26 (61.5%) received surgery (in two
cases after preoperative chemotherapy), 9/26 (34%) received
BioMed Research International
Table 1: Distribution of patients by six relevant clinical parameters.
FNCLCC (French Fédération Nationale des Centres de Lutte Contre le Cancer) grading, proliferative index (ki67 expression), and
CT-RT preoperative chemo/radiotherapy treatment. For the other
acronyms, see the Abbreviations section.
Feature
Age, median (range)
Sex
Female
Male
Tumor size (cm), median (range)
STS histology
WDLPS
DDLPS
LMS
Others
FNCLLC grading (missing data = 1)
G1
G2
G3
Response to CT-RT (missing data = 3)
SD
PR
PD
𝑁
58.5
%
(27–75)
32
38
15
45.7
54.3
(5–45)
16
22
15
17
22.9
31.4
21.4
24.3
19
32
18
27.2
45.7
25.7
50
8
9
71.4
11.4
12.9
chemotherapy, and 1 (4%) received RT. After metastatic
relapse, 2/15 (13%) patients underwent surgery, 9/15 (60%)
first-line chemotherapy, and 4/15 (27%) both. In addition,
four (27%) of these patients received palliative RT. Of the
41 relapsed patients, sixteen (39%) and 4 (9.7%) received
≥2 and ≥3 lines of chemotherapy, respectively. The most
commonly used agents included anthracyclines, trabectedin,
and gemcitabine. The response rate to first-line chemotherapy
was 23% and 10% to subsequent lines.
In order to test the significance of any statistical model
based upon the various diagnostic–therapeutic–prognostic
parameters arising from clinical practice, a first and most
important step was the recoding of those parameters on
homogeneous scales so that quantitative classification and
comparison become possible. An exemplary application of
the above is illustrated in Figure 1, where, with the aim of
checking a therapeutic approach, three clinical parameters,
namely, DFI, tumor size, and histology, were numerically
scaled by a 4-point (0–3) rating scale, in which 0 corresponded to a null risk and 3 to the highest risk of poor
prognosis (see Table 2).
2.2. Statistical Methods
2.2.1. Setup of a Data (Cases/Variables) Matrix. From the
available clinicopathological information, some relevant variables endowed with good and similar prognostic value were
selected and tested in order to optimize their prognostic
value. Chemotherapy regimens and second-line therapies as
effective modifiers and potential confounders, respectively,
�BioMed Research International
3
Table 2: Clinical descriptors and prognostic reclassification. Each variable was reclassified according to the prognostic information deriving
from literature data and clinical expertise. Each reclassification group could range from 0 (better prognosis) to 3 (worst prognosis). For more
details on the recoding, see the Appendix.
Clinical characteristics
Age (years)
Histology
FNCLLC grading
Size (cm)
Response after chemo- and radiotherapy
Type of resection
DFI (months)
Relapse pattern
First type of retreatment at recurrence
Values
<50
51–60
61–65
66–70
70–75
WDLPS, SFT
Myxoid LPS
Pleomorphic LPS, fibrosarcoma
LMS, DDLPS
MPNST, NOS sarcoma
G1
G2
G3
<10
11–15
16–20
20–30
30–45
PR
SD
PD
No resection
R0/R1
R2
Never relapsed
>36
24–36
12–24
6–12
0–6
Never NED
No relapse
Local
Distant
Local + distant
Surgery, surgery + RT
CT followed by surgery
CT or RT
Debulking surgery, no surgery
were eliminated. As a matter of fact, different chemotherapeutic agents, potentially active in specific histologies, may
contribute to a different prognosis of the patients’ outcome.
On the other hand, second-line therapies could have an
uncertain impact on the outcome: a patient undergoing a
further chemotherapy line should live a sufficient time to
undergo a second-line therapy, but second-line therapies are
offered to progressive patients with evidence of disease.
Reclassification
1
1.5
2
2.5
3
1
1.5
2
2.5
3
1
2
3
1
1.5
2
2.5
3
1
2
3
1
2
3
0
0.5
1
1.5
2
2.5
3
0
1
2
3
1
1.5
2
3
Variables a priori considered as possible confounders
of the exposure–outcome association(s) and also possible
modifiers of the size or even the direction of the association
between exposure and outcome were filtered out. Thus, the
resulting data set included 9 main variables for each patient.
If necessary, relevant data were numerically recorded and
reclassified in groups at a 0.5-unit resolution (for the rescale
parameters, see Table 2). These groups ranged from 0 to
�4
BioMed Research International
0.6
0.5
0.4
0.3
0.2
0.1
0
Histology
1
1.5
2
2.5
3
0.6
0.5
0.4
0.3
0.2
0.1
0
Size
1
1.5
(a)
2
2.5
3
0.4
0.35
0.3
0.25
0.2
0.15
0.1
0.05
0
DFI
0
0.5
1
1.5
2
2.5
3
(c)
(b)
Figure 1: Distribution of histology (a), size (b), and disease-free interval or DFI (c) among the patients considered in this work, according to
Table 2, recoding parameters. In histology (a), group 1 indicates WDLPS and SFT, group 1.5 myxoid LPS, group 2 pleomorphic LPS and
fibrosarcoma, group 2.5 LMS and DDLPS, and group 3 MPNST and NOS sarcoma. In size (b), group 1 (<10 cm), group 1.5 (11–15 cm), group 2
(16–20 cm), group 2.5 (20–30 cm), and group 3 (30–45 cm) correspond to different sizes in the largest diameter of the tumor. In DFI (c), group
0 corresponds to never relapsed patients, groups 0.5 stays for patients with a DFI superior to 36 months, group 1 is for a DFI from 24 to 36
months, group 1.5 is for a DFI ranging from 12 to 24 months, group 2 is for a DFI of 6–12 months, group 2.5 is for a DFI inferior to 6 months,
and group 3 is for patients with no eradication of the disease (never NED). Notice that (i) liposarcoma and leiomyosarcoma accounted for
75% of all patients, (ii) the variable size was normally distributed, and (iii) the majority of patients treated on the protocol ISG-STS 03.03 were
in “no relapse” (0 group), confirming the potential effectiveness of the therapeutic approach.
3, where 0 corresponded to the better outcome while 3
corresponded to the worst prognosis. As an example, for the
first type of retreatment at recurrence, an adequate treatment
comprising radical surgery with or without radiotherapy was
considered as the best approach (and reclassified as 1) in the
prognosis, while a debulking surgery, which is known to be
detrimental in the management of retroperitoneal sarcomas,
was considered as the worst possible therapeutic approach
(and, therefore, it was reclassified as 3).
2.2.2. Data Analysis (Univariate and Multivariate Methods).
The association of the survival status with clinical variables
was analyzed by univariate analysis, and the multivariate
analysis was conducted at different levels of supervision
applied to the independent variables. On the basis of the
scientific literature and of clinical expertise of specialists in
the field, the multivariate approach focused on the supervised
clustering by discriminant function analysis (DFA) of clinicopathological profiles endowed with similar prognostic impact
and Mahalanobis distance. It is worth stressing the particular
meaning we associate here with the term “supervised.” On
a purely statistical (syntactic) perspective, a discriminant
analysis is by definition a supervised approach, even if
we do not attach an a priori weight to the intervening
variables, given that the system optimizes the fitting to a
known outcome. Here, we adopt a “semantic” definition of
the term implying the a priori setting of the “weight of
evidence” of each variable, instead of limiting ourselves to
make this weight emerge a posteriori by the least square
optimization. We could use the term “Bayesian” for this
approach, but we prefer “supervised” given that Bayesian
approaches imply a particular mathematical computation of
a posteriori probabilities that we do not apply here.
DFA estimates the linear combinations of descriptors
maximizing the separability among subjects according to
their survival status [18]. DFA and Mahalanobis distance
classification was performed on the clinical regressors (previous medical knowledge and data fitting). DFA allowed
building a model able to predict the group (alive/dead)
that each patient belongs to, through a forward stepwise
optimization paradigm. Structural classification was derived
from the whole dataset of variables to see if individuals could
be grouped into any natural system of groups.
The Mahalanobis distance is a measure of the distance
between a point 𝑃 and a distribution 𝐷 introduced by Mahalanobis in 1936 [19]. It is a generalization of the Euclidean
distance taking into consideration the mutual empirical
correlation allowing the estimation of the distance of a unit
(in our case a patient) from his/her reference population. This
distance is zero if 𝑃 is at the mean of its group (being the
mean defined as a vector of 𝑘 components correspondent to
the means of the 𝑘 variables) and grows as 𝑃 moves away
from the mean. In the case of two-class discrimination, the
Mahalanobis distance of a patient 𝑃 from the centers of
the two classes is computed and 𝑃 assigned to the nearest
group.
The main outcome of univariate and multivariate analyses
was the assignment of each patient to one of the two
alive/dead groups, and results were considered significant at
𝑝 < 0.05, after correction.
The statistical analyses were carried out by JMP version
13 and STATISTICA version 7.
3. Results
3.1. Univariate Analysis. Taking the vital status of patients as
the main outcome in the univariate analysis, the association
of the outcome (survival status) with each clinical variable
of interest was examined, regardless of all other variables.
We found that histology, grading, response to preoperative
treatment, disease-free interval (DFI), pattern of relapse, and
first treatment approach at relapse showed a relatively better
prognostic impact (Table 3). Notice that, in spite of the
relatively fewer cases considered in the unfiltered condition,
the overall association performance of the abovementioned
variables was not improved in the “filtered” homogeneous
condition, which was entitled to focus on the latter in the
following analyses.
�BioMed Research International
5
Table 3: Univariate DFA over filtered and unfiltered cases. The association with the survival status was independently tested for each of the
remaining 9 variables. In the “unfiltered” condition (on the left), the valid cases depended upon the presence of missing cases (to be excluded)
on that variable. In the “filtered” condition (on the right), all cases having any type of missing values (9 in total) were excluded.
Unfiltered
Filtered
Valid cases # wrong % correct 𝑅-squared −2 log prob. Valid cases # wrong % correct 𝑅-squared −2 log prob.
Age
Histology
Grading
Size
Response to
CTRT
Resection
DFI
Relapse pattern
First type of
retreatment
70
70
69
68
32
27
25
35
54.3
61.4
63.8
48.5
0.00037
0.078
0.131
−0.0023
96.95
89.40
83.01
94.25
61
61
61
61
27
25
23
31
55.7
59.0
62.3
49.2
−0.003
0.060
0.114
−0.002
84.4
78.7
74.6
84.28
67
26
61.2
0.016
91.38
61
35
42.6
−0.004
84.52
70
70
66
32
11
12
54.3
84.3
81.8
0.02
0.49
0.24
95.05
49.62
69.39
61
61
61
32
11
11
47.5
82.0
82.0
0.007
0.458
0.219
83.6
45.61
65.71
68
15
77.9
0.12
83.36
61
14
77.0
0.120
74.045
3.2. Multivariate Analysis. Since the multivariate version of
DFA is particularly sensitive to the number of cases, we
recovered as many cases as possible by both “mean-substitution” and “casewise” validation procedures. In the meansubstitution procedure, missing data were substituted by their
respective means. In the casewise method, those patients with
too many missing values were automatically excluded from
the analysis: out of 9 patients with missing values (Table 4),
4 and 5 patients were excluded from the supervised and
unsupervised multivariate analysis, respectively. Under both
conditions, variables were stepwise added to the discriminant
function with an Enter 𝐹 of 1.00, an Exit 𝐹 of 0.0, and a
tolerance of 0, through a forward stepwise method, selecting
at each step the variable that made the most significant
contribution to the discrimination.
Casewise DFA (𝑛 = 66 patients) showed that DFI, age,
and histology were endowed with a relevant predictive value,
while the mean-substitution (𝑛 = 70 patients) method found
DFI, relapse pattern, and histology as the best predictors.
In both cases, DFI and histology were the most and the
least important variables, respectively (see Table 5). For each
variable, Wilks’ lambda and its 𝑝 value have been reported.
Wilks’ lambda is a statistical test used in multivariate analysis
of variance (like a 𝑡-test in the multivariate setting) to test
whether there are differences between the means of the
samples on a combination of dependent variables. In the
present case, Wilks’ lambda indicated the unique contribution
of the respective variable to the discrimination.
3.3. Multivariate Analysis: Supervised and Unsupervised
Methods. In the unsupervised analysis, the rescaling of each
variable was not performed and, most importantly, the variables were not a priori selected according to clinical expertise
or literature data. All the known and independent variables
were possible candidates for inclusion into the model. Under
these conditions, the 16 variables initially found independent of each another (gender, histology, grading, tumor
size, response to neoadjuvant CT-RT, multivisceral surgery,
adjuvant therapies, margins, DFI, relapse, local recurrence,
distant metastases, surgery for relapsed disease, first-line CT,
and second-line CT) were submitted to the further constraint
of the minimum possible number of missing values and
finally reduced to 9.
In the unsupervised analysis, the discriminant function
showed that DFI had a statistically significant predictive value
in both casewise (𝑛 = 65 patients) and mean-substitution
(𝑛 = 70 patients) methods (Table 5).
3.4. Canonical Analysis. A canonical analysis is generally
used to get some orthogonal (independent of each other) discriminant functions through the computation of orthogonal
discriminant roots. Computationally, a canonical correlation
analysis determines the successive discriminant functions
and canonical roots, corresponding to the eigenvalues associated with the respective canonical function. The maximum
number of functions cannot exceed the number of groups
used in the classification minus one. Thus, in the present case,
one discriminant function was estimated, which provided
the best overall discrimination between alive and dead
patients: in Figures 2(a) and 2(b), alive patients (red dots) are
concentrated in the left or the right part, respectively, of the
scatterplot.
Since the main goal of any DFA method is to classify cases,
a distance estimator in the multivariate space defined by the
model’s variables is needed. In such a context, Mahalanobis
distance has been selected since it takes into account the
existing correlation structure of the data, generating a wellconditioned metric for the system at hand. In brief, points
are classified as belonging to distinct groups by measuring
the distance of each point 𝑃 from the multidimensional
mean (centroid) of a distribution according to the covariance
of the same distribution, so to scale the actual Euclidean
distance in the multivariate space by the mutual correlation
of the intervening variables. Briefly, such distances can
be considered as weighted Euclidean distances; the model
derived from a representative sample of the population at
�6
BioMed Research International
Table 4: Supervised features of the 70 patients considered in this work. The minus sign indicates cases with missing values, excluded from
the analysis.
Patient #
1
2 (−)
3
4
5
6 (−)
7 (−)
8
9
10 (−)
11 (−)
12 (−)
13
14
15
16
17
18 (−)
19
20
21
22
23
24
25
26
27
28
29
30
31
32
33 (−)
34
35
36
37
38
39
40
41
42
43
44
45
46
47
48
49
50
51
Age
3
1
2
2
1.5
1.5
1
2.5
1.5
1
1.5
2
1.5
2.5
1.5
1.5
3
2
2
1.5
1
1.5
2.5
1.5
3
1.5
2
1.5
1
1.5
1
1.5
2
3
2
1.5
2.5
1
1
1.5
1
2.5
1
2.5
2.5
2
3
2
1.5
1.5
2.5
Histology
1
3
2.5
2.5
1
3
2.5
3
3
2
3
1
1
1
1
1
2
2.5
3
2.5
2.5
2.5
2.5
3
2
2.5
3
2.5
2.5
1
2.5
1
1
2.5
1
1
3
2.5
2
1
3
2.5
1.5
2.5
2.5
2.5
2.5
2.5
2.5
2.5
2.5
Grading
1
3
1
2
1
2
2
2
2
3
2
1
1
2
1
3
2
2
2
3
3
2
3
3
3
3
3
3
1
3
1
1
3
3
1
2
2
1
2
3
2
1
2
2
2
2
3
2
2
2
Size
2
1.5
1
1
2
2.5
1
2
2.5
2
2.5
3
2
2
2.5
1.5
1
1.5
1.5
2.5
1
2
1.5
1
1
2
3
2.5
2
2.5
2.5
1
2
2
1.5
1
1
1
1.5
1.5
2
2.5
2.5
2
1.5
2
1
1.5
1.5
CTRT response
2
3
2
1
1
2
2
2
2
3
3
2
2
2
2
2
3
3
2
2
2
3
2
2
2
1
3
2
2
2
2
2
3
2
2
2
2
1
2
2
1
2
2
2
2
2
2
2
2
Resection
2
1
1
1
1
1
1
1
1
1
3
2
1
1
1
1
1
3
1
1
1
1
1
1
1
1
1
1
1
1
1
1
1
1
1
1
1
1
1
1
1
1
1
1
1
1
1
1
1
1
1
DFI
0.5
3
0.5
1.5
0.5
1.5
0
1.5
0.5
0.5
3
3
0
1
0
0
0
3
0.5
1
1
1
2
1
1.5
1.5
1.5
2.5
0.5
0
0
0
0
1.5
2.5
0
0
0
0.5
0.5
0
0
0.5
1.5
0
0.5
1
2
0.5
0
2
Relapse pattern
3
2
1
2
1
0
1
1
1
0
1
0
0
0
1
1
1
1
2
1
1
3
1
3
1
0
0
0
0
1
2
0
0
0
2
2
0
0
1
1
0
1
3
3
1
0
2
Retreatment (I)
1
1.5
1
1
1
2
2
2
1
2
3
1
3
3
3
2
1
1
1
1
2
3
3
3
1
2
2
3
3
3
3
2
2
3
3
3
2
1
3
3
1.5
2
3
2
1.5
2
1.5
3
2
Status
Alive
Dead
Alive
Dead
Dead
Dead
Alive
Dead
Dead
Alive
Dead
Dead
Alive
Alive
Alive
Alive
Alive
Dead
Dead
Dead
Dead
Dead
Dead
Dead
Dead
Dead
Dead
Dead
Dead
Alive
Dead
Alive
Alive
Dead
Dead
Alive
Alive
Alive
Dead
Alive
Alive
Alive
Dead
Dead
Alive
Dead
Dead
Dead
Alive
Alive
Dead
�BioMed Research International
7
Table 4: Continued.
Grading
1
2
1
2
2
2
1
2
2
1
2
1
2
1
2
1
3
3
2
Size
1
2.5
2
1.5
2
2.5
1.5
2
2
2.5
1.5
2.5
2.5
3
2
2.5
1.5
1.5
2
CTRT response
2
2
2
2
1
Resection
1
1
1
1
1
1
1
1
1
1
1
1
1
1
1
1
1
1
1
2
2
2
2
2
2
2
2
2
2
3
1
1
Relapse pattern
Canonical 2
First type of re-treatment at recurrence
Histology
−1
0
Retreatment (I)
3
3
2
3
2
2
1
2
3
1
2
3
3
2
3
3
3
3
2
Status
Alive
Alive
Alive
Alive
Dead
Dead
Alive
Dead
Alive
Alive
Alive
Alive
Alive
Dead
Alive
Alive
Alive
Alive
Alive
0.5
0.0
−0.5
−1.0
DFI
−2
Relapse pattern
0
0
2
0
1
3
1
2
0
1
2
0
0
1
0
0
0
0
1
1.0
dead
Grading
DFI
0
0
0.5
0
2
1
0.5
1.5
0
0.5
0.5
0
0
0.5
0
0
0
0
1.5
alive
2.0
1.5
1.0
0.5
0.0
−0.5
−1.0
−1.5
Histology
2.5
2.5
2.5
2.5
2.5
2.5
1
2.5
2.5
1
2.5
1
2.5
1
2.5
1
2.5
2.5
2.5
dead
Age
1.5
2.5
1
1.5
3
1.5
2.5
2.5
1.5
1
3
1.5
2.5
1
1
2
2
1
2.5
alive
Canonical 2
Patient #
52
53
54
55
56
57 (−)
58
59
60
61
62
63
64
65
66
67
68
69
70
1
2
3
Canonical 1
4
5
(a)
6
−3
−2
−1
0
Canonical 1
1
2
(b)
Figure 2: Scatterplots in monodimensional canonical space. (a) Supervised condition (cases # = 64 (dead = 23, alive = 30); wrong = 11; % wrong
= 17.2; 𝑅2 = 0.51). (b) Unsupervised condition (cases # = 56 (dead = 25, alive = 25); wrong = 6; % wrong = 10.7; 𝑅2 = 0.55).
Table 5: Multivariate analysis of clinical descriptors by stepwise
DFA. The association with the vital status by stepwise discriminant
function analysis (DFA) was carried out according to the casewise
(on the left) or the mean-substitution (on the right) methods.
DFI
Histology
Age
Relapse pattern
Size
Casewise
Wilks’ 𝜆 (pi level)
0.60 (<0.001)
0.45 (0.04)
0.45 (0.04)
0.43 (0.10)
0.43 (0.17)
Mean substitution
Wilks’ 𝜆 (pi level)
0.58 (<0.001)
0.43 (0.03)
0.42 (0.18)
0.43 (0.04)
0.41 (0.11)
hand could be easily extended and applied to new clinical
cases. If the distance from the centroid is higher than a certain
threshold, the point is no longer considered as belonging to
the group.
The classification method based on Mahalanobis distance showed in the unsupervised method 86.6% and 83.3%
of accuracy of prediction of patients’ outcome for casewise and mean-substitution methods, respectively (Table 6,
columns 4 and 5), and in the supervised method 85.3%
and 84.7% accuracy of prediction between alive and dead
patients in casewise and mean-substitution method, respectively (Table 6, columns 2 and 3). Such accuracy values
are quite high, even if post hoc classifications are considered.
3.5. Partitioning Classes (Groups) by Decision Trees Methods.
Partitioning multivariate data according to a relationship
between the predictors and response values creates an empirical decision tree useful for exploring relationships in the
absence of a good prior model. Figure 3 shows how a decision
tree can visually and explicitly represent our database in a
typical diagnostic or prognostic context.
�8
BioMed Research International
Table 6: Summary of results. In the casewise method, 4 and 5 cases were excluded because of too many missing values in the supervised
and unsupervised methods, respectively. In the mean substitution, no cases were excluded since missing values were substituted by their
respective means. Accuracy was computed considering the number of misclassified cases on the total of analyzed cases (68, 67, or 72 in
supervised casewise, unsupervised casewise, or mean substitution, resp.).
Supervised
Unsupervised
Casewise
Mean substitution
Casewise
Mean substitution
10
11
9
12
4
85.3
/
84.7
5
86.6
/
83.3
All
Relapse pattern
3
<3
2, 1
Grading
1, 2
<2
2
DFI
<1
≥1
≥2
DFI
≥3
≥3
<3
Grading
(a)
(b)
Yes
Yes
0.043
(?)Gr ≥ 3
No
Yes
(?)DFI ≥ 1
No
0.591
(?)Gr ≥ 2
(?)RP ≥ 1
No
0
Grading
3
3, 1, 2
Grading
<1
Grading
≥1
Grading
1, 2
All
Relapse pattern
1
Missing values
% accuracy
1.5, 0.5
Incorrect classification
Yes
0.763
No
0.979
Yes
0.134
No
0.497
(?)Gr ≥ 3
(c)
Yes
Yes
0.043
Yes
Yes
(?)Gr == 3
No
(?)Gr == 2
No
0.763
(?)RP ==
1|2|3
(?)DFI ==
1|2
No
No
(?)Gr == 1 |
2
Yes
0.591
No
0.079
Yes
0.373
No
0.264
(?)DFI ==
0.5 | 1.5
0.979
(d)
Figure 3: Decision tree picture of the supervised- and unsupervised-based partitioning. Panels (a) and (c) depict the first three branches (splits)
of the decision tree obtained by the numeric, supervised coding (scales reported in Table 2) of the 5 best performing variables in Table 3
(histology, grading, DFI, relapse pattern, and 1st-type treatment at recurrence). Panels (b) and (d) refer to the same data coded as alphanumeric
symbols, hence loosing any quantitative specificity assigned by supervisors. The rectangular boxes in panels (c) and (d) contain the 𝑅2 values,
namely, an indication of the % of explained variability. Ideally, repeated partitioning should eventually produce a total 𝑅2 = 1. Modeling has
been carried out by the Partition Platform of JMP, version 13.
�BioMed Research International
A classic application of partitioning is to create a diagnostic heuristic for a disease. Moreover, given symptoms
and outcomes for a number of subjects, partitioning can be
used to generate a hierarchy of questions helpful for new
patients’ prognosis. Figures 3(a) and 3(b) depict the first three
partitions (decision trees) identifying the probable alive and
dead subjects on the basis of five selected variables (see the
legend to the figure). Such variables were coded by numeric
and alphanumeric symbols, in order to reproduce supervised
and unsupervised learning, respectively. The diagrams in
Figures 3(c) and 3(d) correspond to Figures 3(a) and 3(b),
respectively. In spite of the intimidating aspect, such diagrams
are a direct application of simple logical rules for the probable
association of each single subject with the “alive” or dead
“group” on the basis of the predictor variables, and they
actually open the door to the prognostic application of the
model to new subjects. It is important to note, however, that
enriching the currently available database in order to check
the model by the traditional approach of splitting the cases
into two groups (to be used in a “learning” and a “test” phase)
is in due course now.
4. Discussion
Recently, concomitant chemo- and radiotherapy proved to be
a safe and promising treatment in RPS, leading to an increase
of the 3-year relapse-free survival (3y-RFS) with respect to
historical controls. However, no significant prognostic factors
were found by the classical Cox proportional hazards model,
except for a trend toward a better RFS and overall survival
(OS) in patients with nonliposarcoma histology [14]. To date,
only nomogram-based prognostic tools are available for RPS
[16], and thus the present study is, to our knowledge, the
first application of univariate and multivariate methods to the
prediction of clinical outcome in STS patients.
In univariate analysis, several variables, chosen among
the more important clinicopathological parameters, showed
a significant prognostic role in the cohort of RPS patients
treated on ISG-STS 03.03: DFI and relapse patterns appeared
to be significantly associated with survival status, while size
and age failed to reach statistical significance. The lack of
significance of age is probably due to the epidemiology of
the disease, mainly affecting young adults, and the inefficacy
of size may be attributed to its anatomical peculiarity. The
retroperitoneal site in fact, since it is not always directly in
contact with abdominal organs, requires a highly specialized
surgery which may limit the local invasiveness of the disease.
The effectiveness of the multivariate approach was tested
in the context of both a supervised and an unsupervised
method. Since, according to several sources [20, 21], DFA
is very sensitive to outliers, we carried out the supervised
analysis first, in order to reduce the variance of variables
distribution and the number of outliers.
In the supervised classification model for DFA, the input
variables were chosen and stratified by physicians on the basis
of their clinical expertise in identifying lower and higher risk
classes correlated with a proportional risk of death. Thus,
the “relapse pattern” variable was defined as 0 if the patient
did not experience a recurrence, 1 if the patient developed a
9
local relapse, 2 if metastases were detected, and 3 if both local
and distant relapse were diagnosed. Quite interestingly, the
longest DFI, classified as 0, or null risk of progression and
death, showed a statistically significantly positive prognostic
role. In addition, in the supervised method, the gender was
not included since, at present, any suggestion of a prognostic
role of the gender in STS is missing and, finally, surgical
margins (R0, R1, and R2) and relapse (yes/no) were reported
in a more synthetic form.
In the unsupervised model, we introduced in the model
all relevant variables without any a priori selection or
rescaling, but with the lowest minimum possible number
of missing values. Since every patient with missing values
should be excluded from the analysis and, at the same time,
a very limited sample size would thwart any statistics, 8 of
the initial 24 variables, biased by several missing values, were
excluded from the analysis.
In both supervised and unsupervised learning methods,
we carried out the DFA analysis following either the meansubstitution or the casewise procedure. The results of the
supervised and unsupervised model were fairly similar, with a
misclassification rate of 15.3% and 16.7% when missing values
were substituted by their respective means, and 14.7% versus
13.4% in the casewise setting, respectively. However, in some
cases, the substitution of the missing values by the means
could be inappropriate, such as for histology or response to
preoperative chemoradiotherapy.
In the supervised model, DFI and histology were the
best predictors in both casewise and mean-substitution
approaches. Age was significant in casewise analysis and
relapse pattern was significant in mean substitution. Indeed,
the main factors influencing patients’ outcomes are expected
to be grading, with a poorer prognosis for G3 histologies, and
histotype, with a greater metastatic potential for leiomyosarcomas and MPNST.
The role of DFI as a predictor of outcome seems straightforward since a longer time interval to relapse is intuitively
a good prognostic factor and it could include other variables
by itself, such as adequate surgery, response to preoperative
treatments, or a less aggressive disease. It is worth noticing
that, in the unsupervised model, only DFI was significant in
both casewise and mean-substitution approaches.
Concerning the results presented in Figure 3 on the
decision tree methods, the following points deserve attention.
(1) The 𝑅2 quantitative indicators of the obtained stratification are the same in the supervised and unsupervised procedure. In spite of the small number of clinically
homogeneous subjects which could impair the stability of
our statistical model, the emerging indication is that the
two approaches are not incompatible among each other. A
necessary prerequisite for an optimal diagnostic/prognostic
performance remains, in any case, a solid expertise in the
appropriate management of (possibly both, but at least or)
clinical or statistical information.
(2) The diagrams of the type in panels (c) and (d), once
properly mastered, may play a crucial role in extending the
decision tree method to any clinical condition of similar or
different pathology.
�10
(3) On a more theoretical ground, it is worth noting
that, in the multivariate approach (both supervised and
unsupervised), we rely on “configuration of symptoms” and
not on the simple additivity of single prognostic factors.
This is particularly evident for Mahalanobis distances where
the classification comes up from the distance computed
on the whole 𝑘-dimensional space. This implies that even
information that per se does not have a relevant prognostic
power can contribute to the classification when considered
altogether.
5. Conclusions
All in all, it seems fair to conclude that unsupervised
and supervised analyses produced slightly similar results
and a fair outcome prediction in retroperitoneal sarcoma
patients treated on ISGSTS0303 protocol. No clinically significant differences were observed among the two methods, even if the supervised one was mainly based on the
a priori medical knowledge of the disease. In particular, DFA allowed obtaining a good evaluation of single
cases in terms of Mahalanobis distances, which can be
possibly converted into probabilities. This methodological
approach may well be included into the decision-making
process in oncology and, more in general, in medicine,
in a sort of “from bed to bioinformatic bench and back”
strategy.
Appendix
Detailed Prognostic Reclassification of Clinical
Descriptors in Table 2
Age cut-offs were defined on the basis of the nomogram
for retroperitoneal sarcomas [16]. Histology reclassification
derived from expertise and specific literature data [22–24].
R0/R1 resection was considered equivalent since there is no
radical resection in the retroperitoneal space, by definition.
Chemotherapy followed by surgery was reclassified as 1.5
since a chemotherapeutic treatment upfront is usually offered
to locally advanced or rapidly growing disease; chemotherapy
was evaluated as 2 since it had the objective of controlling
the disease but not of eradicating it; no surgery or debulking
surgery was classified equally as a 3-point factor (worst
prognostic therapeutic approach, since debulking surgery
is not effective in RPS and sometimes is also detrimental).
Abbreviations
3y-RFS: 3-Year relapse-free
survival
CT:
Chemotherapy
DDLPS: Dedifferentiated
liposarcoma
DFA:
Discriminant function
analysis
DFI:
Disease-free interval
DT:
Decision trees
BioMed Research International
FNCLCC:
French Fédération
Nationale des Centres de
Lutte Contre le Cancer
ISG-STS 0303 protocol:
Italian Sarcoma
Group-Soft Tissue
Sarcoma 0303 Protocol
LMS:
Leiomyosarcoma
LPS:
Liposarcoma
MANOVA:
Multivariate analysis of
variance
MD:
Mahalanobis distance
MPNST:
Malignant peripheral
nerve sheath tumors
NED:
Not evident disease
NOS:
Not otherwise specified
OS:
Overall survival
PD:
Progressive disease
PR:
Partial response
R0, R1, and R2 surgical margins: R0, no residual tumor;
R1, microscopic residual
tumor; R2, macroscopic
residual tumor
RECIST:
Response Evaluation
Criteria in Solid Tumors
Relapse Y/N:
Yes/no
RPS:
Retroperitoneal sarcoma
RT:
Radiation therapy
SD:
Stable disease
SFT:
Solitary fibrous tumor
STS:
Soft tissue sarcomas
WDLPS:
Well-differentiated
liposarcoma.
Conflicts of Interest
The authors declare that there are no conflicts of interest
regarding the publication of this paper.
References
[1] A. Ferrari, I. Sultan, T. T. Huang et al., “Soft tissue sarcoma
across the age spectrum: a population-based study from the
surveillance epidemiology and end results database,” Pediatric
Blood & Cancer, vol. 57, no. 6, pp. 943–949, 2011.
[2] G. A. Porter, N. N. Baxter, and P. W. T. Pisters, “Retroperitoneal
sarcoma: a population-based analysis of epidemiology, surgery,
and radiotherapy,” Cancer, vol. 106, no. 7, pp. 1610–1616, 2006.
[3] J. J. Lewis, D. Leung, J. M. Woodruff, and M. F. Brennan,
“Retroperitoneal soft-tissue sarcoma: Analysis of 500 patients
treated and followed at a single institution,” Annals of Surgery,
vol. 228, no. 3, pp. 355–365, 1998.
[4] I. Hassan, S. Z. Park, J. H. Donohue et al., “Operative management of primary retroperitoneal sarcomas: a reappraisal of an
institutional experience,” Annals of Surgery, vol. 239, no. 2, pp.
244–250, 2004.
[5] K. Cardona, R. Williams, and S. Movva, “Multimodality therapy
for advanced or metastatic sarcoma,” Current Problems in
Cancer, vol. 37, no. 2, pp. 74–86, 2013.
[6] D. P. Jaques, D. G. Coit, S. I. Hajdu, and M. F. Brennan,
“Management of primary and recurrent soft-tissue sarcoma of
�BioMed Research International
[7]
[8]
[9]
[10]
[11]
[12]
[13]
[14]
[15]
[16]
[17]
[18]
[19]
[20]
[21]
[22]
the retroperitoneum,” Annals of Surgery, vol. 212, no. 1, pp. 51–
59, 1990.
The ESMO/European Sarcoma Network Working Group, “Soft
tissue and visceral sarcomas: ESMO Clinical Practice Guidelines for diagnosis, treatment and follow-up,” Annals of Oncology, vol. 25, supplement 3, pp. iii102–iii112, 2014.
A. Gronchi, S. Lo Vullo, M. Fiore et al., “Aggressive surgical policies in a retrospectively reviewed single-institution case series of
retroperitoneal soft tissue sarcoma patients,” Journal of Clinical
Oncology, vol. 27, no. 1, pp. 24–30, 2009.
S. Bonvalot, R. Miceli, M. Berselli et al., “Aggressive surgery in
retroperitoneal soft tissue sarcoma carried out at high-volume
centers is safe and is associated with improved local control,”
Annals of Surgical Oncology, vol. 17, no. 6, pp. 1507–1514, 2010.
P. W. T. Pisters and B. O’Sullivan, “Retroperitoneal sarcomas:
combined modality treatment approaches,” Current Opinion in
Oncology, vol. 14, no. 4, pp. 400–405, 2002.
C. Colombo, R. L. Randall, R. H. Andtbacka, and A. Gronchi,
“Surgery in soft tissue sarcoma: more conservative in extremities, more extended in the retroperitoneum,” Expert Review of
Anticancer Therapy, vol. 12, no. 8, pp. 1079–1087, 2012.
C. Mussi, P. Colombo, A. Bertuzzi et al., “Retroperitoneal sarcoma: Is it time to change the surgical policy?” Annals of Surgical
Oncology, vol. 18, no. 8, pp. 2136–2142, 2011.
A. Gronchi, R. Miceli, C. Colombo et al., “Frontline extended
surgery is associated with improved survival in retroperitoneal
low- to intermediate-grade soft tissue sarcomas,” Annals of
Oncology, vol. 23, no. 4, pp. 1067–1073, 2012.
A. Gronchi, A. De Paoli, C. Dani et al., “Preoperative chemoradiation therapy for localised retroperitoneal sarcoma: A phase
I-II study from the Italian Sarcoma Group,” European Journal of
Cancer, vol. 50, no. 4, pp. 784–792, 2014.
W. O. Lane, C. K. Cramer, D. P. Nussbaum et al., “Analysis
of perioperative radiation therapy in the surgical treatment
of primary and recurrent retroperitoneal sarcoma,” Journal of
Surgical Oncology, vol. 112, no. 4, pp. 352–358, 2015.
A. Gronchi, R. Miceli, E. Shurell et al., “Outcome prediction in
primary resected retroperitoneal soft tissue sarcoma: Histologyspecific overall survival and disease-free survival nomograms
built on major sarcoma center data sets,” Journal of Clinical
Oncology, vol. 31, no. 13, pp. 1649–1655, 2013.
E. A. Eisenhauer, P. Therasse, J. Bogaerts et al., “New response
evaluation criteria in solid tumours: revised RECIST guideline
(version 1.1),” European Journal of Cancer, vol. 45, no. 2, pp. 228–
247, 2009.
P. A. Lachenbruch and M. Goldstein, “Discriminant analysis,”
Biometrics, vol. 35, no. 1, pp. 69–85, 1979.
P. C. Mahalanobis, “On thegeneralised distance in statistics,”
Proceedings of the National Institute of Sciences of India, vol. 2,
no. 1, pp. 49–55, 1936.
H. E. A. Tinsley and A. D. Brown, Handbook of Applied Multivariate Statistics and Mathematical Modeling, Academy Press,
2000.
P. Lewicki and T. Hill, Statistics: Methods and Applications, A
Comprehensive Reference for Science, Industry, and Data Mining,
StatSoft, 2006.
M. Toulmonde, S. Bonvalot, P. Méeus et al., “Retroperitoneal
sarcomas: patterns of care at diagnosis, prognostic factors and
focus on main histological subtypes: a multicenter analysis of
the French Sarcoma Group,” Annals of Oncology, vol. 25, no. 3,
Article ID mdt577, pp. 735–742, 2014.
11
[23] I. Alldinger, Q. Yang, C. Pilarsky, H.-D. Saeger, W. T. Knoefel,
and M. Peiper, “Retroperitoneal soft tissue sarcomas: prognosis
and treatment of primary and recurrent disease in 117 patients,”
Anticancer Reseach, vol. 26, no. 2 B, pp. 1577–1581, 2006.
[24] X. D. Zhao, P. Li, X. H. Huang, L. Chen, N. Liu, and Y. G. She,
“Prognostic factors predicting the postoperative survival period
following treatment for primary retroperitoneal liposarcoma,”
Chinese Medical Journal, vol. 128, no. 1, pp. 85–90, 2015.
�MEDIATORS
of
INFLAMMATION
The Scientific
World Journal
Hindawi Publishing Corporation
http://www.hindawi.com
www.hindawi.com
2013
Volume 2018
Gastroenterology
Research and Practice
Hindawi
www.hindawi.com
Journal of
Diabetes Research
Hindawi
www.hindawi.com
Volume 2018
Volume 2018
Hindawi
www.hindawi.com
Volume 2018
Hindawi
www.hindawi.com
Volume 2018
International Journal of
Journal of
Endocrinology
Immunology Research
Hindawi
www.hindawi.com
Disease Markers
Hindawi
www.hindawi.com
Volume 2018
Volume 2018
Submit your manuscripts at
www.hindawi.com
BioMed
Research International
PPAR Research
Hindawi
www.hindawi.com
Hindawi
www.hindawi.com
Volume 2018
Volume 2018
Journal of
Obesity
Journal of
Ophthalmology
Hindawi
www.hindawi.com
Volume 2018
Evidence-Based
Complementary and
Alternative Medicine
Stem Cells
International
Hindawi
www.hindawi.com
Volume 2018
Hindawi
www.hindawi.com
Volume 2018
Journal of
Oncology
Hindawi
www.hindawi.com
Volume 2018
Hindawi
www.hindawi.com
Volume 2013
Parkinson’s
Disease
Computational and
Mathematical Methods
in Medicine
Hindawi
www.hindawi.com
Volume 2018
AIDS
Behavioural
Neurology
Hindawi
www.hindawi.com
Research and Treatment
Volume 2018
Hindawi
www.hindawi.com
Volume 2018
Hindawi
www.hindawi.com
Volume 2018
Oxidative Medicine and
Cellular Longevity
Hindawi
www.hindawi.com
Volume 2018
�
Hindawi
BioMed Research International
Volume 2018, Article ID 2786163, 11 pages
https://doi.org/10.1155/2018/2786163
Research Article
Unsupervised versus Supervised Identification of Prognostic
Factors in Patients with Localized Retroperitoneal Sarcoma:
A Data Clustering and Mahalanobis Distance Approach
Rita De Sanctis ,1,2 Alessandro Viganò,2,3 Alessandro Giuliani,4
Alessandro Gronchi,5 Antonino De Paoli,6 Pierina Navarria,7 Vittorio Quagliuolo,8
Armando Santoro,1,9 and Alfredo Colosimo 2
1
Department of Medical Oncology and Hematology, Humanitas Cancer Center and Research Hospital, IRCCS, Rozzano,
Milan, Italy
2
Molecular and Cellular Networks Lab, Department of Anatomy, Histology, Forensic Medicine and Orthopaedics,
“Sapienza” University of Rome, Rome, Italy
3
Department of Neurology and Psychiatry, “Sapienza” University of Rome, Rome, Italy
4
Department of Environment and Health, Istituto Superiore di Sanità, Rome, Italy
5
Department of Surgery, Fondazione IRCCS Istituto Nazionale dei Tumori, Milan, Italy
6
Department of Radiation Oncology, Centro di Riferimento Oncologico, National Cancer Institute, Aviano, Italy
7
Department of Radiotherapy and Radiosurgery, Humanitas Cancer Center and Research Hospital, IRCCS, Rozzano, Milan, Italy
8
Department of Surgery, Humanitas Cancer Center and Research Hospital, IRCCS, Rozzano, Milan, Italy
9
Humanitas University, Rozzano, Milan, Italy
Correspondence should be addressed to Rita De Sanctis; rita.desanctis@yahoo.it
Received 28 September 2017; Accepted 12 March 2018; Published 23 April 2018
Academic Editor: Maria C. De Rosa
Copyright © 2018 Rita De Sanctis et al. This is an open access article distributed under the Creative Commons Attribution License,
which permits unrestricted use, distribution, and reproduction in any medium, provided the original work is properly cited.
The aim of this report is to unveil specific prognostic factors for retroperitoneal sarcoma (RPS) patients by univariate and
multivariate statistical techniques. A phase I-II study on localized RPS treated with high-dose ifosfamide and radiotherapy followed
by surgery (ISG-STS 0303 protocol) demonstrated that chemo/radiotherapy was safe and increased the 3-year relapse-free survival
(RFS) with respect to historical controls. Of 70 patients, twenty-six developed local, 10 distant, and 5 combined relapse. Median
disease-free interval (DFI) was 29.47 months. According to a discriminant function analysis, DFI, histology, relapse pattern, and
the first treatment approach at relapse had a statistically significant prognostic impact. Based on scientific literature and clinical
expertise, clinicopathological data were analyzed using both a supervised and an unsupervised classification method to predict
the prognosis, with similar sample sizes (66 and 65, resp., in casewise approach and 70 in mean-substitution one). This is the first
attempt to predict patients’ prognosis by means of multivariate statistics, and in this light, it looks noticable that (i) some clinical
data have a well-defined prognostic value, (ii) the unsupervised model produced comparable results with respect to the supervised
one, and (iii) the appropriate combination of both models appears fruitful and easily extensible to different clinical contexts.
1. Introduction
Retroperitoneal sarcomas (RPS) are a peculiar soft tissue
sarcoma (STS) subgroup including 4 or 5 subtypes and an
expected incidence of less than 1 case per 100,000 inhabitants/year [1–4]. Although surgery is the standard treatment
for localized lesions [5–13], the role of radiation therapy (RT)
in RPS is not fully defined as of yet. In order to complement
surgery, the use of preoperative and intraoperative RT is
under increasing investigation. In addition, chemotherapy
(CT), concurrent to RT, could have a radiosensitizer effect
and a precautionary role in eradicating micrometastases,
thus increasing the therapeutic index of RT alone [14,
15].
�2
The analysis of prognostic factors and risk stratification,
in order to decide the better therapeutic approach, is still
pivotal in patients with rare tumors; moreover, the usefulness
of the few tools available to predict good or poor prognosis is
not completely defined [16].
In this contribution, we present an exploratory univariate
analysis of possible disease predictors as well as a multivariate
prognostic model for RPS based on discriminant function
analysis (DFA), Mahalanobis distance (MD), and decision
trees (DT) classification. An unsupervised approach in the
analytical strategy showed a comparable efficiency with
respect to a supervised one, which is suggestive of their
possible combined use in clinical practice.
2. Materials and Methods
2.1. Clinical Data. Clinicopathological data about RPS were
obtained from patients treated at three Italian referral centers according to the protocol Italian Sarcoma Group-Soft
Tissue Sarcoma Trial 0303 (ISG-STS0303; EudraCT number: ITASARC ∗ II 2004 003) between December 2003 and
December 2010. At the end of this protocol, patients underwent further follow-up, thus collecting further information
concerning (i) pattern of relapse (local and/or distant), (ii)
disease-free interval (DFI), and (iii) postrelapse outcome
(type of treatment at recurrence, response rate according
to RECIST (Response Evaluation Criteria in Solid Tumors)
criteria [17], and postrelapse survival).
Institutional databases from the 3 main participating
enrolling centers (Fondazione IRCCS Istituto Nazionale dei
Tumori, Milan, Italy; Humanitas Research Hospital, IRCCS,
Rozzano, Milan, Italy; and CRO, IRCCS, Aviano, Italy)
allowed updating the follow-up of 70 patients operated on
with a median follow-up time from surgery of 91.7 months
(interquartile range (IQR): 72.5, 111.3 months). Patients lost to
follow-up were excluded from the analysis. Male/female ratio
was 1.25 : 1. Median age was 58.5 years (range: 27–75). The
patients’ distribution among six relevant clinical descriptors
is reported in Table 1.
Notice that, for the 70 patients considered in Table 1,
the following information was also available: type of resection (macroscopically complete or incomplete, multivisceral
surgery), adjuvant therapies, percentage of necrosis of the
surgical specimen, DFI, relapse pattern (local and/or distant),
first type of treatment at recurrence (first-line chemotherapy
regimen, best response and RT), and further treatments
(second-line chemotherapy regimen, best response, and further CT lines).
41 out of the 70 patients included in the study developed
local (𝑛 = 26) or distant (𝑛 = 10) or both local and distant
(𝑛 = 5) relapse. Main histological relapsed subtypes were
dedifferentiated liposarcoma (14 out of 41, 34%), leiomyosarcoma (10, 24%), well-differentiated liposarcoma (6, 14%),
and NOS (not otherwise specified) sarcoma (6, 14%). Median
DFI was 29.47 months. Patients with any local relapse (with or
without distant disease) presented an infield (23/31), outfield
(4/31), or mixed (4/31) recurrence. Among patients with
only local relapse, 16/26 (61.5%) received surgery (in two
cases after preoperative chemotherapy), 9/26 (34%) received
BioMed Research International
Table 1: Distribution of patients by six relevant clinical parameters.
FNCLCC (French Fédération Nationale des Centres de Lutte Contre le Cancer) grading, proliferative index (ki67 expression), and
CT-RT preoperative chemo/radiotherapy treatment. For the other
acronyms, see the Abbreviations section.
Feature
Age, median (range)
Sex
Female
Male
Tumor size (cm), median (range)
STS histology
WDLPS
DDLPS
LMS
Others
FNCLLC grading (missing data = 1)
G1
G2
G3
Response to CT-RT (missing data = 3)
SD
PR
PD
𝑁
58.5
%
(27–75)
32
38
15
45.7
54.3
(5–45)
16
22
15
17
22.9
31.4
21.4
24.3
19
32
18
27.2
45.7
25.7
50
8
9
71.4
11.4
12.9
chemotherapy, and 1 (4%) received RT. After metastatic
relapse, 2/15 (13%) patients underwent surgery, 9/15 (60%)
first-line chemotherapy, and 4/15 (27%) both. In addition,
four (27%) of these patients received palliative RT. Of the
41 relapsed patients, sixteen (39%) and 4 (9.7%) received
≥2 and ≥3 lines of chemotherapy, respectively. The most
commonly used agents included anthracyclines, trabectedin,
and gemcitabine. The response rate to first-line chemotherapy
was 23% and 10% to subsequent lines.
In order to test the significance of any statistical model
based upon the various diagnostic–therapeutic–prognostic
parameters arising from clinical practice, a first and most
important step was the recoding of those parameters on
homogeneous scales so that quantitative classification and
comparison become possible. An exemplary application of
the above is illustrated in Figure 1, where, with the aim of
checking a therapeutic approach, three clinical parameters,
namely, DFI, tumor size, and histology, were numerically
scaled by a 4-point (0–3) rating scale, in which 0 corresponded to a null risk and 3 to the highest risk of poor
prognosis (see Table 2).
2.2. Statistical Methods
2.2.1. Setup of a Data (Cases/Variables) Matrix. From the
available clinicopathological information, some relevant variables endowed with good and similar prognostic value were
selected and tested in order to optimize their prognostic
value. Chemotherapy regimens and second-line therapies as
effective modifiers and potential confounders, respectively,
�BioMed Research International
3
Table 2: Clinical descriptors and prognostic reclassification. Each variable was reclassified according to the prognostic information deriving
from literature data and clinical expertise. Each reclassification group could range from 0 (better prognosis) to 3 (worst prognosis). For more
details on the recoding, see the Appendix.
Clinical characteristics
Age (years)
Histology
FNCLLC grading
Size (cm)
Response after chemo- and radiotherapy
Type of resection
DFI (months)
Relapse pattern
First type of retreatment at recurrence
Values
<50
51–60
61–65
66–70
70–75
WDLPS, SFT
Myxoid LPS
Pleomorphic LPS, fibrosarcoma
LMS, DDLPS
MPNST, NOS sarcoma
G1
G2
G3
<10
11–15
16–20
20–30
30–45
PR
SD
PD
No resection
R0/R1
R2
Never relapsed
>36
24–36
12–24
6–12
0–6
Never NED
No relapse
Local
Distant
Local + distant
Surgery, surgery + RT
CT followed by surgery
CT or RT
Debulking surgery, no surgery
were eliminated. As a matter of fact, different chemotherapeutic agents, potentially active in specific histologies, may
contribute to a different prognosis of the patients’ outcome.
On the other hand, second-line therapies could have an
uncertain impact on the outcome: a patient undergoing a
further chemotherapy line should live a sufficient time to
undergo a second-line therapy, but second-line therapies are
offered to progressive patients with evidence of disease.
Reclassification
1
1.5
2
2.5
3
1
1.5
2
2.5
3
1
2
3
1
1.5
2
2.5
3
1
2
3
1
2
3
0
0.5
1
1.5
2
2.5
3
0
1
2
3
1
1.5
2
3
Variables a priori considered as possible confounders
of the exposure–outcome association(s) and also possible
modifiers of the size or even the direction of the association
between exposure and outcome were filtered out. Thus, the
resulting data set included 9 main variables for each patient.
If necessary, relevant data were numerically recorded and
reclassified in groups at a 0.5-unit resolution (for the rescale
parameters, see Table 2). These groups ranged from 0 to
�4
BioMed Research International
0.6
0.5
0.4
0.3
0.2
0.1
0
Histology
1
1.5
2
2.5
3
0.6
0.5
0.4
0.3
0.2
0.1
0
Size
1
1.5
(a)
2
2.5
3
0.4
0.35
0.3
0.25
0.2
0.15
0.1
0.05
0
DFI
0
0.5
1
1.5
2
2.5
3
(c)
(b)
Figure 1: Distribution of histology (a), size (b), and disease-free interval or DFI (c) among the patients considered in this work, according to
Table 2, recoding parameters. In histology (a), group 1 indicates WDLPS and SFT, group 1.5 myxoid LPS, group 2 pleomorphic LPS and
fibrosarcoma, group 2.5 LMS and DDLPS, and group 3 MPNST and NOS sarcoma. In size (b), group 1 (<10 cm), group 1.5 (11–15 cm), group 2
(16–20 cm), group 2.5 (20–30 cm), and group 3 (30–45 cm) correspond to different sizes in the largest diameter of the tumor. In DFI (c), group
0 corresponds to never relapsed patients, groups 0.5 stays for patients with a DFI superior to 36 months, group 1 is for a DFI from 24 to 36
months, group 1.5 is for a DFI ranging from 12 to 24 months, group 2 is for a DFI of 6–12 months, group 2.5 is for a DFI inferior to 6 months,
and group 3 is for patients with no eradication of the disease (never NED). Notice that (i) liposarcoma and leiomyosarcoma accounted for
75% of all patients, (ii) the variable size was normally distributed, and (iii) the majority of patients treated on the protocol ISG-STS 03.03 were
in “no relapse” (0 group), confirming the potential effectiveness of the therapeutic approach.
3, where 0 corresponded to the better outcome while 3
corresponded to the worst prognosis. As an example, for the
first type of retreatment at recurrence, an adequate treatment
comprising radical surgery with or without radiotherapy was
considered as the best approach (and reclassified as 1) in the
prognosis, while a debulking surgery, which is known to be
detrimental in the management of retroperitoneal sarcomas,
was considered as the worst possible therapeutic approach
(and, therefore, it was reclassified as 3).
2.2.2. Data Analysis (Univariate and Multivariate Methods).
The association of the survival status with clinical variables
was analyzed by univariate analysis, and the multivariate
analysis was conducted at different levels of supervision
applied to the independent variables. On the basis of the
scientific literature and of clinical expertise of specialists in
the field, the multivariate approach focused on the supervised
clustering by discriminant function analysis (DFA) of clinicopathological profiles endowed with similar prognostic impact
and Mahalanobis distance. It is worth stressing the particular
meaning we associate here with the term “supervised.” On
a purely statistical (syntactic) perspective, a discriminant
analysis is by definition a supervised approach, even if
we do not attach an a priori weight to the intervening
variables, given that the system optimizes the fitting to a
known outcome. Here, we adopt a “semantic” definition of
the term implying the a priori setting of the “weight of
evidence” of each variable, instead of limiting ourselves to
make this weight emerge a posteriori by the least square
optimization. We could use the term “Bayesian” for this
approach, but we prefer “supervised” given that Bayesian
approaches imply a particular mathematical computation of
a posteriori probabilities that we do not apply here.
DFA estimates the linear combinations of descriptors
maximizing the separability among subjects according to
their survival status [18]. DFA and Mahalanobis distance
classification was performed on the clinical regressors (previous medical knowledge and data fitting). DFA allowed
building a model able to predict the group (alive/dead)
that each patient belongs to, through a forward stepwise
optimization paradigm. Structural classification was derived
from the whole dataset of variables to see if individuals could
be grouped into any natural system of groups.
The Mahalanobis distance is a measure of the distance
between a point 𝑃 and a distribution 𝐷 introduced by Mahalanobis in 1936 [19]. It is a generalization of the Euclidean
distance taking into consideration the mutual empirical
correlation allowing the estimation of the distance of a unit
(in our case a patient) from his/her reference population. This
distance is zero if 𝑃 is at the mean of its group (being the
mean defined as a vector of 𝑘 components correspondent to
the means of the 𝑘 variables) and grows as 𝑃 moves away
from the mean. In the case of two-class discrimination, the
Mahalanobis distance of a patient 𝑃 from the centers of
the two classes is computed and 𝑃 assigned to the nearest
group.
The main outcome of univariate and multivariate analyses
was the assignment of each patient to one of the two
alive/dead groups, and results were considered significant at
𝑝 < 0.05, after correction.
The statistical analyses were carried out by JMP version
13 and STATISTICA version 7.
3. Results
3.1. Univariate Analysis. Taking the vital status of patients as
the main outcome in the univariate analysis, the association
of the outcome (survival status) with each clinical variable
of interest was examined, regardless of all other variables.
We found that histology, grading, response to preoperative
treatment, disease-free interval (DFI), pattern of relapse, and
first treatment approach at relapse showed a relatively better
prognostic impact (Table 3). Notice that, in spite of the
relatively fewer cases considered in the unfiltered condition,
the overall association performance of the abovementioned
variables was not improved in the “filtered” homogeneous
condition, which was entitled to focus on the latter in the
following analyses.
�BioMed Research International
5
Table 3: Univariate DFA over filtered and unfiltered cases. The association with the survival status was independently tested for each of the
remaining 9 variables. In the “unfiltered” condition (on the left), the valid cases depended upon the presence of missing cases (to be excluded)
on that variable. In the “filtered” condition (on the right), all cases having any type of missing values (9 in total) were excluded.
Unfiltered
Filtered
Valid cases # wrong % correct 𝑅-squared −2 log prob. Valid cases # wrong % correct 𝑅-squared −2 log prob.
Age
Histology
Grading
Size
Response to
CTRT
Resection
DFI
Relapse pattern
First type of
retreatment
70
70
69
68
32
27
25
35
54.3
61.4
63.8
48.5
0.00037
0.078
0.131
−0.0023
96.95
89.40
83.01
94.25
61
61
61
61
27
25
23
31
55.7
59.0
62.3
49.2
−0.003
0.060
0.114
−0.002
84.4
78.7
74.6
84.28
67
26
61.2
0.016
91.38
61
35
42.6
−0.004
84.52
70
70
66
32
11
12
54.3
84.3
81.8
0.02
0.49
0.24
95.05
49.62
69.39
61
61
61
32
11
11
47.5
82.0
82.0
0.007
0.458
0.219
83.6
45.61
65.71
68
15
77.9
0.12
83.36
61
14
77.0
0.120
74.045
3.2. Multivariate Analysis. Since the multivariate version of
DFA is particularly sensitive to the number of cases, we
recovered as many cases as possible by both “mean-substitution” and “casewise” validation procedures. In the meansubstitution procedure, missing data were substituted by their
respective means. In the casewise method, those patients with
too many missing values were automatically excluded from
the analysis: out of 9 patients with missing values (Table 4),
4 and 5 patients were excluded from the supervised and
unsupervised multivariate analysis, respectively. Under both
conditions, variables were stepwise added to the discriminant
function with an Enter 𝐹 of 1.00, an Exit 𝐹 of 0.0, and a
tolerance of 0, through a forward stepwise method, selecting
at each step the variable that made the most significant
contribution to the discrimination.
Casewise DFA (𝑛 = 66 patients) showed that DFI, age,
and histology were endowed with a relevant predictive value,
while the mean-substitution (𝑛 = 70 patients) method found
DFI, relapse pattern, and histology as the best predictors.
In both cases, DFI and histology were the most and the
least important variables, respectively (see Table 5). For each
variable, Wilks’ lambda and its 𝑝 value have been reported.
Wilks’ lambda is a statistical test used in multivariate analysis
of variance (like a 𝑡-test in the multivariate setting) to test
whether there are differences between the means of the
samples on a combination of dependent variables. In the
present case, Wilks’ lambda indicated the unique contribution
of the respective variable to the discrimination.
3.3. Multivariate Analysis: Supervised and Unsupervised
Methods. In the unsupervised analysis, the rescaling of each
variable was not performed and, most importantly, the variables were not a priori selected according to clinical expertise
or literature data. All the known and independent variables
were possible candidates for inclusion into the model. Under
these conditions, the 16 variables initially found independent of each another (gender, histology, grading, tumor
size, response to neoadjuvant CT-RT, multivisceral surgery,
adjuvant therapies, margins, DFI, relapse, local recurrence,
distant metastases, surgery for relapsed disease, first-line CT,
and second-line CT) were submitted to the further constraint
of the minimum possible number of missing values and
finally reduced to 9.
In the unsupervised analysis, the discriminant function
showed that DFI had a statistically significant predictive value
in both casewise (𝑛 = 65 patients) and mean-substitution
(𝑛 = 70 patients) methods (Table 5).
3.4. Canonical Analysis. A canonical analysis is generally
used to get some orthogonal (independent of each other) discriminant functions through the computation of orthogonal
discriminant roots. Computationally, a canonical correlation
analysis determines the successive discriminant functions
and canonical roots, corresponding to the eigenvalues associated with the respective canonical function. The maximum
number of functions cannot exceed the number of groups
used in the classification minus one. Thus, in the present case,
one discriminant function was estimated, which provided
the best overall discrimination between alive and dead
patients: in Figures 2(a) and 2(b), alive patients (red dots) are
concentrated in the left or the right part, respectively, of the
scatterplot.
Since the main goal of any DFA method is to classify cases,
a distance estimator in the multivariate space defined by the
model’s variables is needed. In such a context, Mahalanobis
distance has been selected since it takes into account the
existing correlation structure of the data, generating a wellconditioned metric for the system at hand. In brief, points
are classified as belonging to distinct groups by measuring
the distance of each point 𝑃 from the multidimensional
mean (centroid) of a distribution according to the covariance
of the same distribution, so to scale the actual Euclidean
distance in the multivariate space by the mutual correlation
of the intervening variables. Briefly, such distances can
be considered as weighted Euclidean distances; the model
derived from a representative sample of the population at
�6
BioMed Research International
Table 4: Supervised features of the 70 patients considered in this work. The minus sign indicates cases with missing values, excluded from
the analysis.
Patient #
1
2 (−)
3
4
5
6 (−)
7 (−)
8
9
10 (−)
11 (−)
12 (−)
13
14
15
16
17
18 (−)
19
20
21
22
23
24
25
26
27
28
29
30
31
32
33 (−)
34
35
36
37
38
39
40
41
42
43
44
45
46
47
48
49
50
51
Age
3
1
2
2
1.5
1.5
1
2.5
1.5
1
1.5
2
1.5
2.5
1.5
1.5
3
2
2
1.5
1
1.5
2.5
1.5
3
1.5
2
1.5
1
1.5
1
1.5
2
3
2
1.5
2.5
1
1
1.5
1
2.5
1
2.5
2.5
2
3
2
1.5
1.5
2.5
Histology
1
3
2.5
2.5
1
3
2.5
3
3
2
3
1
1
1
1
1
2
2.5
3
2.5
2.5
2.5
2.5
3
2
2.5
3
2.5
2.5
1
2.5
1
1
2.5
1
1
3
2.5
2
1
3
2.5
1.5
2.5
2.5
2.5
2.5
2.5
2.5
2.5
2.5
Grading
1
3
1
2
1
2
2
2
2
3
2
1
1
2
1
3
2
2
2
3
3
2
3
3
3
3
3
3
1
3
1
1
3
3
1
2
2
1
2
3
2
1
2
2
2
2
3
2
2
2
Size
2
1.5
1
1
2
2.5
1
2
2.5
2
2.5
3
2
2
2.5
1.5
1
1.5
1.5
2.5
1
2
1.5
1
1
2
3
2.5
2
2.5
2.5
1
2
2
1.5
1
1
1
1.5
1.5
2
2.5
2.5
2
1.5
2
1
1.5
1.5
CTRT response
2
3
2
1
1
2
2
2
2
3
3
2
2
2
2
2
3
3
2
2
2
3
2
2
2
1
3
2
2
2
2
2
3
2
2
2
2
1
2
2
1
2
2
2
2
2
2
2
2
Resection
2
1
1
1
1
1
1
1
1
1
3
2
1
1
1
1
1
3
1
1
1
1
1
1
1
1
1
1
1
1
1
1
1
1
1
1
1
1
1
1
1
1
1
1
1
1
1
1
1
1
1
DFI
0.5
3
0.5
1.5
0.5
1.5
0
1.5
0.5
0.5
3
3
0
1
0
0
0
3
0.5
1
1
1
2
1
1.5
1.5
1.5
2.5
0.5
0
0
0
0
1.5
2.5
0
0
0
0.5
0.5
0
0
0.5
1.5
0
0.5
1
2
0.5
0
2
Relapse pattern
3
2
1
2
1
0
1
1
1
0
1
0
0
0
1
1
1
1
2
1
1
3
1
3
1
0
0
0
0
1
2
0
0
0
2
2
0
0
1
1
0
1
3
3
1
0
2
Retreatment (I)
1
1.5
1
1
1
2
2
2
1
2
3
1
3
3
3
2
1
1
1
1
2
3
3
3
1
2
2
3
3
3
3
2
2
3
3
3
2
1
3
3
1.5
2
3
2
1.5
2
1.5
3
2
Status
Alive
Dead
Alive
Dead
Dead
Dead
Alive
Dead
Dead
Alive
Dead
Dead
Alive
Alive
Alive
Alive
Alive
Dead
Dead
Dead
Dead
Dead
Dead
Dead
Dead
Dead
Dead
Dead
Dead
Alive
Dead
Alive
Alive
Dead
Dead
Alive
Alive
Alive
Dead
Alive
Alive
Alive
Dead
Dead
Alive
Dead
Dead
Dead
Alive
Alive
Dead
�BioMed Research International
7
Table 4: Continued.
Grading
1
2
1
2
2
2
1
2
2
1
2
1
2
1
2
1
3
3
2
Size
1
2.5
2
1.5
2
2.5
1.5
2
2
2.5
1.5
2.5
2.5
3
2
2.5
1.5
1.5
2
CTRT response
2
2
2
2
1
Resection
1
1
1
1
1
1
1
1
1
1
1
1
1
1
1
1
1
1
1
2
2
2
2
2
2
2
2
2
2
3
1
1
Relapse pattern
Canonical 2
First type of re-treatment at recurrence
Histology
−1
0
Retreatment (I)
3
3
2
3
2
2
1
2
3
1
2
3
3
2
3
3
3
3
2
Status
Alive
Alive
Alive
Alive
Dead
Dead
Alive
Dead
Alive
Alive
Alive
Alive
Alive
Dead
Alive
Alive
Alive
Alive
Alive
0.5
0.0
−0.5
−1.0
DFI
−2
Relapse pattern
0
0
2
0
1
3
1
2
0
1
2
0
0
1
0
0
0
0
1
1.0
dead
Grading
DFI
0
0
0.5
0
2
1
0.5
1.5
0
0.5
0.5
0
0
0.5
0
0
0
0
1.5
alive
2.0
1.5
1.0
0.5
0.0
−0.5
−1.0
−1.5
Histology
2.5
2.5
2.5
2.5
2.5
2.5
1
2.5
2.5
1
2.5
1
2.5
1
2.5
1
2.5
2.5
2.5
dead
Age
1.5
2.5
1
1.5
3
1.5
2.5
2.5
1.5
1
3
1.5
2.5
1
1
2
2
1
2.5
alive
Canonical 2
Patient #
52
53
54
55
56
57 (−)
58
59
60
61
62
63
64
65
66
67
68
69
70
1
2
3
Canonical 1
4
5
(a)
6
−3
−2
−1
0
Canonical 1
1
2
(b)
Figure 2: Scatterplots in monodimensional canonical space. (a) Supervised condition (cases # = 64 (dead = 23, alive = 30); wrong = 11; % wrong
= 17.2; 𝑅2 = 0.51). (b) Unsupervised condition (cases # = 56 (dead = 25, alive = 25); wrong = 6; % wrong = 10.7; 𝑅2 = 0.55).
Table 5: Multivariate analysis of clinical descriptors by stepwise
DFA. The association with the vital status by stepwise discriminant
function analysis (DFA) was carried out according to the casewise
(on the left) or the mean-substitution (on the right) methods.
DFI
Histology
Age
Relapse pattern
Size
Casewise
Wilks’ 𝜆 (pi level)
0.60 (<0.001)
0.45 (0.04)
0.45 (0.04)
0.43 (0.10)
0.43 (0.17)
Mean substitution
Wilks’ 𝜆 (pi level)
0.58 (<0.001)
0.43 (0.03)
0.42 (0.18)
0.43 (0.04)
0.41 (0.11)
hand could be easily extended and applied to new clinical
cases. If the distance from the centroid is higher than a certain
threshold, the point is no longer considered as belonging to
the group.
The classification method based on Mahalanobis distance showed in the unsupervised method 86.6% and 83.3%
of accuracy of prediction of patients’ outcome for casewise and mean-substitution methods, respectively (Table 6,
columns 4 and 5), and in the supervised method 85.3%
and 84.7% accuracy of prediction between alive and dead
patients in casewise and mean-substitution method, respectively (Table 6, columns 2 and 3). Such accuracy values
are quite high, even if post hoc classifications are considered.
3.5. Partitioning Classes (Groups) by Decision Trees Methods.
Partitioning multivariate data according to a relationship
between the predictors and response values creates an empirical decision tree useful for exploring relationships in the
absence of a good prior model. Figure 3 shows how a decision
tree can visually and explicitly represent our database in a
typical diagnostic or prognostic context.
�8
BioMed Research International
Table 6: Summary of results. In the casewise method, 4 and 5 cases were excluded because of too many missing values in the supervised
and unsupervised methods, respectively. In the mean substitution, no cases were excluded since missing values were substituted by their
respective means. Accuracy was computed considering the number of misclassified cases on the total of analyzed cases (68, 67, or 72 in
supervised casewise, unsupervised casewise, or mean substitution, resp.).
Supervised
Unsupervised
Casewise
Mean substitution
Casewise
Mean substitution
10
11
9
12
4
85.3
/
84.7
5
86.6
/
83.3
All
Relapse pattern
3
<3
2, 1
Grading
1, 2
<2
2
DFI
<1
≥1
≥2
DFI
≥3
≥3
<3
Grading
(a)
(b)
Yes
Yes
0.043
(?)Gr ≥ 3
No
Yes
(?)DFI ≥ 1
No
0.591
(?)Gr ≥ 2
(?)RP ≥ 1
No
0
Grading
3
3, 1, 2
Grading
<1
Grading
≥1
Grading
1, 2
All
Relapse pattern
1
Missing values
% accuracy
1.5, 0.5
Incorrect classification
Yes
0.763
No
0.979
Yes
0.134
No
0.497
(?)Gr ≥ 3
(c)
Yes
Yes
0.043
Yes
Yes
(?)Gr == 3
No
(?)Gr == 2
No
0.763
(?)RP ==
1|2|3
(?)DFI ==
1|2
No
No
(?)Gr == 1 |
2
Yes
0.591
No
0.079
Yes
0.373
No
0.264
(?)DFI ==
0.5 | 1.5
0.979
(d)
Figure 3: Decision tree picture of the supervised- and unsupervised-based partitioning. Panels (a) and (c) depict the first three branches (splits)
of the decision tree obtained by the numeric, supervised coding (scales reported in Table 2) of the 5 best performing variables in Table 3
(histology, grading, DFI, relapse pattern, and 1st-type treatment at recurrence). Panels (b) and (d) refer to the same data coded as alphanumeric
symbols, hence loosing any quantitative specificity assigned by supervisors. The rectangular boxes in panels (c) and (d) contain the 𝑅2 values,
namely, an indication of the % of explained variability. Ideally, repeated partitioning should eventually produce a total 𝑅2 = 1. Modeling has
been carried out by the Partition Platform of JMP, version 13.
�BioMed Research International
A classic application of partitioning is to create a diagnostic heuristic for a disease. Moreover, given symptoms
and outcomes for a number of subjects, partitioning can be
used to generate a hierarchy of questions helpful for new
patients’ prognosis. Figures 3(a) and 3(b) depict the first three
partitions (decision trees) identifying the probable alive and
dead subjects on the basis of five selected variables (see the
legend to the figure). Such variables were coded by numeric
and alphanumeric symbols, in order to reproduce supervised
and unsupervised learning, respectively. The diagrams in
Figures 3(c) and 3(d) correspond to Figures 3(a) and 3(b),
respectively. In spite of the intimidating aspect, such diagrams
are a direct application of simple logical rules for the probable
association of each single subject with the “alive” or dead
“group” on the basis of the predictor variables, and they
actually open the door to the prognostic application of the
model to new subjects. It is important to note, however, that
enriching the currently available database in order to check
the model by the traditional approach of splitting the cases
into two groups (to be used in a “learning” and a “test” phase)
is in due course now.
4. Discussion
Recently, concomitant chemo- and radiotherapy proved to be
a safe and promising treatment in RPS, leading to an increase
of the 3-year relapse-free survival (3y-RFS) with respect to
historical controls. However, no significant prognostic factors
were found by the classical Cox proportional hazards model,
except for a trend toward a better RFS and overall survival
(OS) in patients with nonliposarcoma histology [14]. To date,
only nomogram-based prognostic tools are available for RPS
[16], and thus the present study is, to our knowledge, the
first application of univariate and multivariate methods to the
prediction of clinical outcome in STS patients.
In univariate analysis, several variables, chosen among
the more important clinicopathological parameters, showed
a significant prognostic role in the cohort of RPS patients
treated on ISG-STS 03.03: DFI and relapse patterns appeared
to be significantly associated with survival status, while size
and age failed to reach statistical significance. The lack of
significance of age is probably due to the epidemiology of
the disease, mainly affecting young adults, and the inefficacy
of size may be attributed to its anatomical peculiarity. The
retroperitoneal site in fact, since it is not always directly in
contact with abdominal organs, requires a highly specialized
surgery which may limit the local invasiveness of the disease.
The effectiveness of the multivariate approach was tested
in the context of both a supervised and an unsupervised
method. Since, according to several sources [20, 21], DFA
is very sensitive to outliers, we carried out the supervised
analysis first, in order to reduce the variance of variables
distribution and the number of outliers.
In the supervised classification model for DFA, the input
variables were chosen and stratified by physicians on the basis
of their clinical expertise in identifying lower and higher risk
classes correlated with a proportional risk of death. Thus,
the “relapse pattern” variable was defined as 0 if the patient
did not experience a recurrence, 1 if the patient developed a
9
local relapse, 2 if metastases were detected, and 3 if both local
and distant relapse were diagnosed. Quite interestingly, the
longest DFI, classified as 0, or null risk of progression and
death, showed a statistically significantly positive prognostic
role. In addition, in the supervised method, the gender was
not included since, at present, any suggestion of a prognostic
role of the gender in STS is missing and, finally, surgical
margins (R0, R1, and R2) and relapse (yes/no) were reported
in a more synthetic form.
In the unsupervised model, we introduced in the model
all relevant variables without any a priori selection or
rescaling, but with the lowest minimum possible number
of missing values. Since every patient with missing values
should be excluded from the analysis and, at the same time,
a very limited sample size would thwart any statistics, 8 of
the initial 24 variables, biased by several missing values, were
excluded from the analysis.
In both supervised and unsupervised learning methods,
we carried out the DFA analysis following either the meansubstitution or the casewise procedure. The results of the
supervised and unsupervised model were fairly similar, with a
misclassification rate of 15.3% and 16.7% when missing values
were substituted by their respective means, and 14.7% versus
13.4% in the casewise setting, respectively. However, in some
cases, the substitution of the missing values by the means
could be inappropriate, such as for histology or response to
preoperative chemoradiotherapy.
In the supervised model, DFI and histology were the
best predictors in both casewise and mean-substitution
approaches. Age was significant in casewise analysis and
relapse pattern was significant in mean substitution. Indeed,
the main factors influencing patients’ outcomes are expected
to be grading, with a poorer prognosis for G3 histologies, and
histotype, with a greater metastatic potential for leiomyosarcomas and MPNST.
The role of DFI as a predictor of outcome seems straightforward since a longer time interval to relapse is intuitively
a good prognostic factor and it could include other variables
by itself, such as adequate surgery, response to preoperative
treatments, or a less aggressive disease. It is worth noticing
that, in the unsupervised model, only DFI was significant in
both casewise and mean-substitution approaches.
Concerning the results presented in Figure 3 on the
decision tree methods, the following points deserve attention.
(1) The 𝑅2 quantitative indicators of the obtained stratification are the same in the supervised and unsupervised procedure. In spite of the small number of clinically
homogeneous subjects which could impair the stability of
our statistical model, the emerging indication is that the
two approaches are not incompatible among each other. A
necessary prerequisite for an optimal diagnostic/prognostic
performance remains, in any case, a solid expertise in the
appropriate management of (possibly both, but at least or)
clinical or statistical information.
(2) The diagrams of the type in panels (c) and (d), once
properly mastered, may play a crucial role in extending the
decision tree method to any clinical condition of similar or
different pathology.
�10
(3) On a more theoretical ground, it is worth noting
that, in the multivariate approach (both supervised and
unsupervised), we rely on “configuration of symptoms” and
not on the simple additivity of single prognostic factors.
This is particularly evident for Mahalanobis distances where
the classification comes up from the distance computed
on the whole 𝑘-dimensional space. This implies that even
information that per se does not have a relevant prognostic
power can contribute to the classification when considered
altogether.
5. Conclusions
All in all, it seems fair to conclude that unsupervised
and supervised analyses produced slightly similar results
and a fair outcome prediction in retroperitoneal sarcoma
patients treated on ISGSTS0303 protocol. No clinically significant differences were observed among the two methods, even if the supervised one was mainly based on the
a priori medical knowledge of the disease. In particular, DFA allowed obtaining a good evaluation of single
cases in terms of Mahalanobis distances, which can be
possibly converted into probabilities. This methodological
approach may well be included into the decision-making
process in oncology and, more in general, in medicine,
in a sort of “from bed to bioinformatic bench and back”
strategy.
Appendix
Detailed Prognostic Reclassification of Clinical
Descriptors in Table 2
Age cut-offs were defined on the basis of the nomogram
for retroperitoneal sarcomas [16]. Histology reclassification
derived from expertise and specific literature data [22–24].
R0/R1 resection was considered equivalent since there is no
radical resection in the retroperitoneal space, by definition.
Chemotherapy followed by surgery was reclassified as 1.5
since a chemotherapeutic treatment upfront is usually offered
to locally advanced or rapidly growing disease; chemotherapy
was evaluated as 2 since it had the objective of controlling
the disease but not of eradicating it; no surgery or debulking
surgery was classified equally as a 3-point factor (worst
prognostic therapeutic approach, since debulking surgery
is not effective in RPS and sometimes is also detrimental).
Abbreviations
3y-RFS: 3-Year relapse-free
survival
CT:
Chemotherapy
DDLPS: Dedifferentiated
liposarcoma
DFA:
Discriminant function
analysis
DFI:
Disease-free interval
DT:
Decision trees
BioMed Research International
FNCLCC:
French Fédération
Nationale des Centres de
Lutte Contre le Cancer
ISG-STS 0303 protocol:
Italian Sarcoma
Group-Soft Tissue
Sarcoma 0303 Protocol
LMS:
Leiomyosarcoma
LPS:
Liposarcoma
MANOVA:
Multivariate analysis of
variance
MD:
Mahalanobis distance
MPNST:
Malignant peripheral
nerve sheath tumors
NED:
Not evident disease
NOS:
Not otherwise specified
OS:
Overall survival
PD:
Progressive disease
PR:
Partial response
R0, R1, and R2 surgical margins: R0, no residual tumor;
R1, microscopic residual
tumor; R2, macroscopic
residual tumor
RECIST:
Response Evaluation
Criteria in Solid Tumors
Relapse Y/N:
Yes/no
RPS:
Retroperitoneal sarcoma
RT:
Radiation therapy
SD:
Stable disease
SFT:
Solitary fibrous tumor
STS:
Soft tissue sarcomas
WDLPS:
Well-differentiated
liposarcoma.
Conflicts of Interest
The authors declare that there are no conflicts of interest
regarding the publication of this paper.
References
[1] A. Ferrari, I. Sultan, T. T. Huang et al., “Soft tissue sarcoma
across the age spectrum: a population-based study from the
surveillance epidemiology and end results database,” Pediatric
Blood & Cancer, vol. 57, no. 6, pp. 943–949, 2011.
[2] G. A. Porter, N. N. Baxter, and P. W. T. Pisters, “Retroperitoneal
sarcoma: a population-based analysis of epidemiology, surgery,
and radiotherapy,” Cancer, vol. 106, no. 7, pp. 1610–1616, 2006.
[3] J. J. Lewis, D. Leung, J. M. Woodruff, and M. F. Brennan,
“Retroperitoneal soft-tissue sarcoma: Analysis of 500 patients
treated and followed at a single institution,” Annals of Surgery,
vol. 228, no. 3, pp. 355–365, 1998.
[4] I. Hassan, S. Z. Park, J. H. Donohue et al., “Operative management of primary retroperitoneal sarcomas: a reappraisal of an
institutional experience,” Annals of Surgery, vol. 239, no. 2, pp.
244–250, 2004.
[5] K. Cardona, R. Williams, and S. Movva, “Multimodality therapy
for advanced or metastatic sarcoma,” Current Problems in
Cancer, vol. 37, no. 2, pp. 74–86, 2013.
[6] D. P. Jaques, D. G. Coit, S. I. Hajdu, and M. F. Brennan,
“Management of primary and recurrent soft-tissue sarcoma of
�BioMed Research International
[7]
[8]
[9]
[10]
[11]
[12]
[13]
[14]
[15]
[16]
[17]
[18]
[19]
[20]
[21]
[22]
the retroperitoneum,” Annals of Surgery, vol. 212, no. 1, pp. 51–
59, 1990.
The ESMO/European Sarcoma Network Working Group, “Soft
tissue and visceral sarcomas: ESMO Clinical Practice Guidelines for diagnosis, treatment and follow-up,” Annals of Oncology, vol. 25, supplement 3, pp. iii102–iii112, 2014.
A. Gronchi, S. Lo Vullo, M. Fiore et al., “Aggressive surgical policies in a retrospectively reviewed single-institution case series of
retroperitoneal soft tissue sarcoma patients,” Journal of Clinical
Oncology, vol. 27, no. 1, pp. 24–30, 2009.
S. Bonvalot, R. Miceli, M. Berselli et al., “Aggressive surgery in
retroperitoneal soft tissue sarcoma carried out at high-volume
centers is safe and is associated with improved local control,”
Annals of Surgical Oncology, vol. 17, no. 6, pp. 1507–1514, 2010.
P. W. T. Pisters and B. O’Sullivan, “Retroperitoneal sarcomas:
combined modality treatment approaches,” Current Opinion in
Oncology, vol. 14, no. 4, pp. 400–405, 2002.
C. Colombo, R. L. Randall, R. H. Andtbacka, and A. Gronchi,
“Surgery in soft tissue sarcoma: more conservative in extremities, more extended in the retroperitoneum,” Expert Review of
Anticancer Therapy, vol. 12, no. 8, pp. 1079–1087, 2012.
C. Mussi, P. Colombo, A. Bertuzzi et al., “Retroperitoneal sarcoma: Is it time to change the surgical policy?” Annals of Surgical
Oncology, vol. 18, no. 8, pp. 2136–2142, 2011.
A. Gronchi, R. Miceli, C. Colombo et al., “Frontline extended
surgery is associated with improved survival in retroperitoneal
low- to intermediate-grade soft tissue sarcomas,” Annals of
Oncology, vol. 23, no. 4, pp. 1067–1073, 2012.
A. Gronchi, A. De Paoli, C. Dani et al., “Preoperative chemoradiation therapy for localised retroperitoneal sarcoma: A phase
I-II study from the Italian Sarcoma Group,” European Journal of
Cancer, vol. 50, no. 4, pp. 784–792, 2014.
W. O. Lane, C. K. Cramer, D. P. Nussbaum et al., “Analysis
of perioperative radiation therapy in the surgical treatment
of primary and recurrent retroperitoneal sarcoma,” Journal of
Surgical Oncology, vol. 112, no. 4, pp. 352–358, 2015.
A. Gronchi, R. Miceli, E. Shurell et al., “Outcome prediction in
primary resected retroperitoneal soft tissue sarcoma: Histologyspecific overall survival and disease-free survival nomograms
built on major sarcoma center data sets,” Journal of Clinical
Oncology, vol. 31, no. 13, pp. 1649–1655, 2013.
E. A. Eisenhauer, P. Therasse, J. Bogaerts et al., “New response
evaluation criteria in solid tumours: revised RECIST guideline
(version 1.1),” European Journal of Cancer, vol. 45, no. 2, pp. 228–
247, 2009.
P. A. Lachenbruch and M. Goldstein, “Discriminant analysis,”
Biometrics, vol. 35, no. 1, pp. 69–85, 1979.
P. C. Mahalanobis, “On thegeneralised distance in statistics,”
Proceedings of the National Institute of Sciences of India, vol. 2,
no. 1, pp. 49–55, 1936.
H. E. A. Tinsley and A. D. Brown, Handbook of Applied Multivariate Statistics and Mathematical Modeling, Academy Press,
2000.
P. Lewicki and T. Hill, Statistics: Methods and Applications, A
Comprehensive Reference for Science, Industry, and Data Mining,
StatSoft, 2006.
M. Toulmonde, S. Bonvalot, P. Méeus et al., “Retroperitoneal
sarcomas: patterns of care at diagnosis, prognostic factors and
focus on main histological subtypes: a multicenter analysis of
the French Sarcoma Group,” Annals of Oncology, vol. 25, no. 3,
Article ID mdt577, pp. 735–742, 2014.
11
[23] I. Alldinger, Q. Yang, C. Pilarsky, H.-D. Saeger, W. T. Knoefel,
and M. Peiper, “Retroperitoneal soft tissue sarcomas: prognosis
and treatment of primary and recurrent disease in 117 patients,”
Anticancer Reseach, vol. 26, no. 2 B, pp. 1577–1581, 2006.
[24] X. D. Zhao, P. Li, X. H. Huang, L. Chen, N. Liu, and Y. G. She,
“Prognostic factors predicting the postoperative survival period
following treatment for primary retroperitoneal liposarcoma,”
Chinese Medical Journal, vol. 128, no. 1, pp. 85–90, 2015.
�MEDIATORS
of
INFLAMMATION
The Scientific
World Journal
Hindawi Publishing Corporation
http://www.hindawi.com
www.hindawi.com
2013
Volume 2018
Gastroenterology
Research and Practice
Hindawi
www.hindawi.com
Journal of
Diabetes Research
Hindawi
www.hindawi.com
Volume 2018
Volume 2018
Hindawi
www.hindawi.com
Volume 2018
Hindawi
www.hindawi.com
Volume 2018
International Journal of
Journal of
Endocrinology
Immunology Research
Hindawi
www.hindawi.com
Disease Markers
Hindawi
www.hindawi.com
Volume 2018
Volume 2018
Submit your manuscripts at
www.hindawi.com
BioMed
Research International
PPAR Research
Hindawi
www.hindawi.com
Hindawi
www.hindawi.com
Volume 2018
Volume 2018
Journal of
Obesity
Journal of
Ophthalmology
Hindawi
www.hindawi.com
Volume 2018
Evidence-Based
Complementary and
Alternative Medicine
Stem Cells
International
Hindawi
www.hindawi.com
Volume 2018
Hindawi
www.hindawi.com
Volume 2018
Journal of
Oncology
Hindawi
www.hindawi.com
Volume 2018
Hindawi
www.hindawi.com
Volume 2013
Parkinson’s
Disease
Computational and
Mathematical Methods
in Medicine
Hindawi
www.hindawi.com
Volume 2018
AIDS
Behavioural
Neurology
Hindawi
www.hindawi.com
Research and Treatment
Volume 2018
Hindawi
www.hindawi.com
Volume 2018
Hindawi
www.hindawi.com
Volume 2018
Oxidative Medicine and
Cellular Longevity
Hindawi
www.hindawi.com
Volume 2018
�
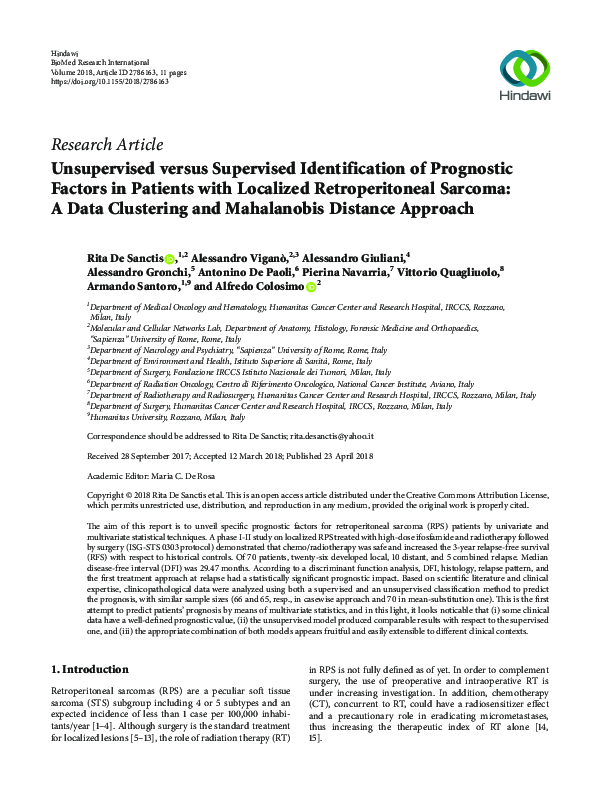
 Alessandro Giuliani