Journal of Applied and Natural Science
Research Article
12(2): 270 - 276 (2020)
Published online: June 15, 2020
ISSN : 0974-9411 (Print), 2231-5209 (Online)
journals.ansfoundation.org
Economic analysis of integrated farming systems in the Kuttanad
region of Kerala state, India: A case study
Aiswarya Sabu
Department of Agricultural Economics, Centre for Agricultural and Rural Development
Studies (CARDS), Tamil Nadu Agricultural University, Coimbatore-641003 (Tamil Nadu),
India
S Padma Rani*
Department of Agricultural Economics, Centre for Agricultural and Rural Development
Studies (CARDS), Tamil Nadu Agricultural University, Coimbatore-641003 (Tamil Nadu),
India
A Vidhyavathi
Department of Agricultural Economics, Centre for Agricultural and Rural Development
Studies (CARDS), Tamil Nadu Agricultural University, Coimbatore-641003 (Tamil Nadu),
India
*Corresponding author: Email: padmaranisentil@yahoo.com
Abstract
Agriculture, with its allied sectors, is unquestionably the largest livelihood provider in India. According to Committee on Doubling of Farmers’ Income Report, the average annual
earning of a small and marginal farmer household was Rs 79,779 in 2015-16 and indicates that 86% of farmer households earn only 9% of total income and rest of the farmers
earn 91% of total income. Integrated farming system practised mostly by small and marginal farmers, is a viable option for increasing farm income. The present study was undertaken to identify the farming systems practised by small and marginal holdings in
Kuttanad region of Kerala state, India and also attempts to assess the profitability of these farms and suggest optimal farm plans using linear programming technique. The study
revealed that rice + fish and Coconut + Banana+ Dairy cow + Poultry+ Goat were the
most profitable farming systems with a benefit cost ratio of 2.63 and 2.86, respectively.
The resource allocation in the existing plan was sub-optimal. The optimisation of resource
use led to maximization of net returns, indicating the potential for realising greater income. The net returns of rice + fish increased from Rs. 181724 to Rs. 220010 in the optimal plan. The study also suggests the extent to which net returns can be increased with
additional units of constraint resources viz., land/labour. The net returns in FS IV can be
increased by Rs.286177.9 per additional acreage of land allotted. Thus, the farmers in
Kuttanad can increase their income by optimal resource allocation and by deploying
additional units of land or labour.
Article Info
https://doi.org/10.31018/
jans.vi.2292
Received: May 10, 2020
Revised: June 11, 2020
Accepted: June 13, 2020
How to Cite
Sabu, A. et al.
(2020).
Economic analysis of integrated farming systems in
the Kuttanad region of
Kerala state, India: A case
study. Journal of Applied
and Natural Science, 12
(2): 270 - 276
https://doi.org/10.31018/
jans.vi.2292
Keywords: Integrated farming system, Linear programming, Optimisation, Shadow price
INTRODUCTION
In India, agriculture is the largest enterprise and it
can only survive if it can grow consistently. The
growth of agriculture as an enterprise is dependent upon investment and savings, which are a
function of net returns. The net returns in this enterprise in turn determine the level of income of
the farmer as per report of the Committee on Doubling of Farmers Income (Government of India,
2017). An increase in farmer’s income will help to
decrease the agrarian distress in India. Indian agriculture is dominated by small and marginal holders, and this does not allow the adoption of technology by farmers and efficient utilisation of farm
resources. According to Agricultural Census 2015
-16, India has an estimated 12.56 crore small and
marginal farmers. They together operate 86 per
cent of the total farm holdings and held 47.34 per
cent in the operated area.
In comparison, the large and medium farmers
operate under 30 per cent of the farm area. Kerala has an estimated 75 lakh small and medium
farmers, who together operate 99 per cent of the
total farm holdings and held 78.70 per cent in the
operated area. According to Committee on Doubling of Farmer’s Income Report, the average
annual earning of a small and marginal farmer
household was Rs. 79779 in 2015-16 and this
indicates that 86 per cent of farmer households
This work is licensed under Attribution-Non Commercial 4.0 International (CC BY-NC 4.0). © 2018: Author (s). Publishing rights @ ANSF.
�Sabu, A. et al. / J. Appl. & Nat. Sci. 12(2): 270 - 276 (2020)
farming” through crop and livestock enterprises.
The present study was undertaken to identify the
major integrated farming systems of Kuttanad,
Kerala. The study also attempts to assess the
economics of integrated farming system and suggest optimum farm plans for small and marginal
farm holdings.
earn only 9 per cent of total income and the rest
earn income 91 per cent of total income. Thus, it
is imperative to increase the income of small and
marginal farmers through sustainable means for
the upliftment of the economy as a whole.
As per the Agricultural Census 2015-16, the average landholding size is 0.18 ha, and it was 0.22
ha in 2010-11. This necessitates a system that
integrates various farming components while assuring a reasonable return to the farm family
(Nataraja, 2016). An integrated farming system
with available resources accessible to farmers
ensures a high standard of food production with
minimum environmental impact even in highly
vulnerable climate. It is a viable option for small
and marginal farmers. It has revolutionised the
conventional farming of livestock, aquaculture,
poultry, horticulture, agroforestry and allied sector
(Mamatha, 2017).
Integrated Farming System (IFS) is a dynamic
concept and a practical way forward for agriculture that benefits not only the farmers but also the
society as a whole. A major advantage of the IFS
approach is that it generates additional income
and employment to the tune of 200 to 400 per
cent and thereby increasing the standard of living
of farm families. Padmanabhan et al. (2001) studied the economic viability of integrated farming
system model in Kumarakom, Kerala and concluded that the rice+ fish+ pig+ cow+ poultry model yielded a net income of Rs. 1, 29,508 from the
integrated farming model. Dadhwal et al. (2012)
suggested integrated farming systems suited for
Western Himalayas and concluded that such systems improve productivity, provide employment
opportunities for small and marginal farmers and
increase resource use efficiency in farms. The
study also found that farming systems based on
small scale poultry unit recovered with an overall
BC ratio of 1.9:1.
Felix et al. (2013) used linear programming model
for small farmers in Bindura district, Zimbabwe
and found that the LP model with optimal resource
allocation yielded a gross income of $12,295.10
as compared to $8,500.00 obtained in traditional
resource use methods. According to the Report of
Committee on DFI (Vol I), the risk in agriculture
can be reduced to a great extent by practising IFS
so that the farmers get an assured income from
any of the enterprise during adverse conditions.
The Regional Agricultural Research Station
(RARS), Problem Zone under Kerala Agricultural
University and the Committee on Doubling of
Farmers Income under Government of Kerala
recommends integrated farming system models
for farmers in Kuttanad. The Kerala State Planning Board in its report titled “A Special Package
for Post Flood Kuttanad”, 2019 recommended
“Integrated farming in paddy fields with multicommodity enterprises” and “revival of coconut
MATERIALS AND METHODS
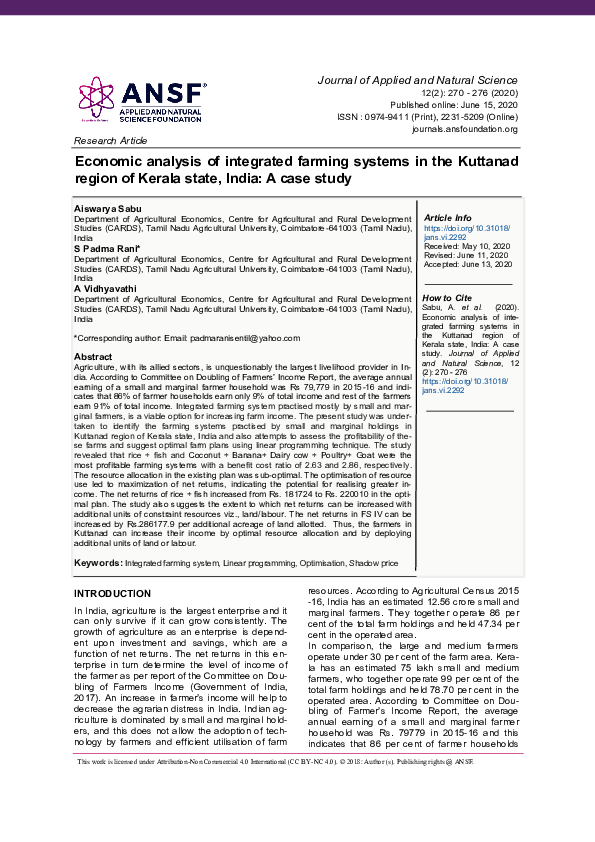
Study area: A primary survey was conducted in
Kuttanad, popularly known as the rice bowl of Kerala. About 95% of farmers in Kuttanad are small
and marginal farmers. Kuttanad spans across
Alappuzha, Kottayam and Pathanamthitta districts
of Kerala. About 32 panchayats of Alappuzha district, 32 panchayats of Kottayam district and five
districts of Pathanamthitta district constituted
Kuttanad region or Kuttanad Wetland System
(KWS). One panchayat from each of the three
districts was chosen for the study. Niranam panchayat of Alappuzha district, Kumarakom panchayat of Kottayam district and Nedumudi district of
Pathanamthitta district were selected. A map demarcating Kuttanad or KWS is shown in Fig. 1.
Random sampling was undertaken to select forty
farmers from each panchayat. The total sample
size of 120 included both small and marginal farmers.
Method of data collection: Primary data was
collected from the sample respondents by personal interview method with the help of pre-tested
interview schedule, specifically designed for the
study. General information like age, educational
status, family details, landholding pattern, cropping pattern, and inventory of farm assets and
details of livestock inventory were collected from
respondents. Detailed information on the integrated farming system model, cost and returns of
crop, cost and returns of livestock enterprises,
cost and returns of the fishery were also collected
from the respondents. The primary data were collected from the respondents with the help of a
personal interview conducted during December
2019 and January 2020. The primary data collected from the sample respondents were processed
and tabulated.
Method of data analysis: In order to analyse the
cost of cultivation, all operational cost, material
cost and fixed cost were taken into account. For
livestock enterprises, fixed cost involves depreciation on poultry shed and interest on fixed capital
assets (Osti, 2016). Fixed cost for fishery component involved depreciation on pond and interest
on fixed capital assets. Variable cost included cost
incurred in purchase, cost of feed, labour cost,
medicine cost and interest on variable cost for
livestock enterprises (Osti, 2016).
Linear programming was used to suggest optimum farm plans using the given resources. Linear
programming is a mathematical modelling tech271
�Sabu, A. et al. / J. Appl. & Nat. Sci. 12(2): 270 - 276 (2020)
expenses of the farmer producer. The net returns
of livestock components were calculated by subtracting expenses on feed, labour, medicine etc.
The basic assumptions of the model include linearity, additivity, certainty, proportionality and divisibility. The problems of resource allocation in the
study were based on the assumption that the economic decision-making unit is the farm, and the
farmer has the sole right to make decisions regarding resource allocation and farm management.
Another major assumption of the model was its
operational period. The operational period of the
model was twelve months. The yield and price
expectations of the farmers were assumed to be
single-valued in the model. The model also assumed that each farm was operated such a way
so as to maximize the net returns subject to
resource constraints.
The activities in the model indicated the resources
often put into alternative uses. The model had the
following activities: i). Crop, poultry, dairy and
fishery activities, ii). Labour hiring activities,
iii). Perennial crop cultivation, iv). Sale of product
activities, v). Working Capital.
The constraints included in the LP model were
land, labour, working capital, fertilizer and feed.
The land, labour and working capital available,
chemical fertilizers and farm yard manure availa-
nique used to determine the level of operational
activity in order to achieve an objective, subject to
restrictions called constraints. The optimum allocation was the one which showed the activities to
undertake under physical and technical resource
conditions and the amount of resource to be allocated to each activity so that the net returns in a
year are maximized (Nataraja, 2016). Linear programming, one of the most appropriate tools, was
used to allocate limited farm resources. The mathematical formulation of the linear programming
model (Nataraja, 2016) is given below:
Maximize Z = Σ ck yk + Σ aj xj
…Eq. 1
Subject to
Σ bik yk + Σ bij xj ≤ Gi
Where
Z - Total net returns to maximize
ck - Net returns of the kth crop enterprise
yk - Amount of the kth crop enterprise
aj - Net returns from the jth poultry enterprise
xj - Amount (poultry unit) of the jth poultry enterprise
bij - ith resource of the jth poultry enterprise
bik - ith resource of the kth crop enterprise
Gi - Maximum level of ith resource available
The gross returns of the crop enterprises and
other allied enterprises per acre were calculated
using data collected from the primary survey. The
net returns were arrived by subtracting the
Sampling Site
Fig. 1. Delimitation map of Alappuzha district and Kuttanad Region of Kerala state (Source: MSSRF Report , 2007).
272
�Sabu, A. et al. / J. Appl. & Nat. Sci. 12(2): 270 - 276 (2020)
ble for cultivation, feed available for livestock and
other allied enterprises like fishery were considered. In the case of labour available, both family
labour and hired labours were considered. In this
study, input coefficients were land, labour, fertilizer requirement, farmyard manure and feed requirements. The feed requirements for poultry,
dairy and fishery were considered. In the case of
land, owned land was considered. Labour includes both family and hired labour. The inputoutput coefficients for an average farm were derived from primary data collected. The linear programming problem was solved with Microsoft Excel using the solver option.
farming system in Kuttanad, and the allied enterprises included fishery, duckery, dairy and poultry
and these results are same as in the study conducted in Kuttanad region, Kerala by Mamatha
(2017).
Net income: The annual net income of the farming systems in the study area is shown in Table 3.
Among the rice-based systems, rice + fishery (FS
II) was the most profitable system with a net income of Rs. 181725.58 and benefit-cost ratio of
2.63. The results are in agreement with recommendations of “A Special Package for Post-Flood
Kuttanad” Report (2018), integration of fisheries
with agriculture is the best way to increase the
profitability of farming households in Kuttanad.
Crop + Dairy cow + Poultry+ Goat (FS VII) was
the most profitable system among the coconutbased farming systems in the study area. Being
the most diversified system, the annual net income of FS VII is Rs. 1964503.57 with a benefitcost ratio of 2.86. This result indicated that as the
degree of integration increases, net returns of the
system also increases. A similar result was observed in the study conducted by Nataraja (2016)
in Chikkaballapura district, Karnataka. Coconut +
Poultry + Cow (FS V) and Coconut + Banana +
Goat (FS VI) systems appeared to be the least
profitable systems relatively with a benefit-cost
ratio of 1.24 and 1.51 respectively. The total cost
and net income of FS V appeared to be Rs.
744352.93, and Rs. 183594.57 respectively.
Optimal plans: The enterprise combinations of
the existing, as well as optimal farm plans of the
farming systems identified in Kuttanad, are presented in Table 4 to 5. The major objective of optimisation was to increase the net income, and this
has been achieved in all farming systems. The
increase in net returns was highest in case of FS
VII from Rs 192223 to Rs 462367. The results of
the LP model indicated that major crop activities
identified like rice and coconut appeared in the
optimum plans as they were found to be remunerative. The crop activity banana being less remunerative did not appear in optimum farm plans of
FS III, FS VII and FS IX. All the livestock activities
under the existing farm plan appeared in the optimum plans.
Since land, human labour and working capital
were constraints, the amount of these resources
available were fully utilised in most farming systems. The land was fully utilised in FS IV, FS V,
RESULTS AND DISCUSSION
The small and marginal farmers in Kuttanad emphasised on both crop and livestock activities.
About 71 per cent of farmers in the study area
possessed livestock components like dairy, small
ruminants and poultry and about 29% of the farmers were engaged in the fishery. The major crop
activities were rice, coconut and banana. Rice
was the major crop cultivated in the study area.
The average size of land holdings of marginal and
small farm households are given in table 1. More
than half of the sample farmers (54 per cent) were
marginal farmers. The average size of marginal
farm holding was 1.20 acres, whereas it was 3.69
acres in case of small farm holdings.
Farming systems: The integrated farming systems identified in the study area are presented in
table 2. Rice-based and coconut-based systems
were the major farming systems in the study area.
Rice + Fishery (FS II) formed the most common
integrated farming system followed by the sample
farmers in Kuttanad, accounting for 31 per cent of
the total. Among 55 small farmers, the most common system was Rice + Fishery (45.5 per cent)
followed by Rice + Duckery (23.6 per cent). Rice
+ Duckery system (FS I) was followed by 34 per
cent of marginal farmers and 26 per cent follow
Coconut + Banana + Poultry system (FS III).
Among the coconut-based farming system, Coconut + Banana + Poultry was the most common
system. Coconut + Banana + dairy cow system
(FS IV) was practised by 6 per cent of the sample
farmers whereas Coconut + Banana + Poultry +
dairy Cow system (FS VII) was followed by 4.1 per
cent of the respondents. Other coconut-based
systems namely Coconut + Poultry + dairy cow
(FS V) and Coconut + Banana + Poultry + Goat
(FS VIII) were practised by only a small proportion
of the farmers’ viz., 2.5 per cent and 1.6 per cent
respectively. Coconut + Banana + Goat system
(FS V) was followed only in a small farm household. Similarly, Coconut + Banana + Poultry +
Goat + dairy cow system (FS VII) were followed
by a single marginal farm household. The ricebased farming system was identified as the major
Table 1. Average size of the landholdings in different categories of farm households of Kuttanad.
273
Types of farmers
Number of
farmers
Marginal farmers
65
Average landholding size
(acres)
1.20
Small farmers
55
3.69
�Sabu, A. et al. / J. Appl. & Nat. Sci. 12(2): 270 - 276 (2020)
Table 2. Integrated farming system followed by sample farmers of Kuttanad.
Farming
system
Farming System
No. of marginal
Farmers
No. of small
farmers
Total
FS I
Rice + Duckery
22 (34)
13 (23.6)
35 (29)
FS II
Rice + Fishery
12 (18.4)
25 (45.5)
37 (31)
FS III
Coconut + Banana + Poultry
17 (26.1)
11 (20)
28 (24)
FS IV
Coconut + Banana + Cow
7 (10.76)
1 (1.8)
8 (6)
FS V
Coconut + Poultry + Cow
2 (3.07)
1 (1.8)
3 (2.5)
FS VI
Coconut + Banana + Goat
0
1 (1.8)
1 (0.83)
FS VII
Coconut + Banana + Poultry + Cow
3 (4.6)
2 (3.6)
5 (4.17)
FS VIII
Coconut + Banana + Poultry + Goat
1 (1.53)
1 (1.8)
2 (1.6)
FS IX
Coconut + Banana + Poultry + Goat + Cow
1 (1.53)
0
1 (0.83)
Total
65 (100)
55 (100)
120 (100)
Note: Figures in parenthesis indicate percentage to the total
Table 3. Annual net income (Rupees/annum) from existing integrated farming systems of Kuttanad.
Farming
system
Farming System
Total Cost
Gross Returns
Net Returns
BC Ratio
FS I
FS II
FS III
Rice + Duckery*
Rice + Fishery
Coconut+ Banana + Poultry**
1010188.88
111355.81
503334.66
1549052.14
293081.37
1147197.9
538863.26
181725.58
643862.63
1.53
2.63
2.27
FS IV
Coconut+ Banana + Cow***
134284.6
292508.6
158223.9
2.17
FS V
FS VI
Coconut + Poultry + Cow
Coconut+ Banana + Goat
744352.93
163809.14
927947.67
248325
183594.57
184515.9
1.24
1.51
FS VII
Coconut+ Banana + Poultry
+ Cow
639200.91
1473329.1
834128.19
2.30
FS VIII
Coconut+ Banana + Poultry
+ Goat
645593
1361198
714497.3
2.10
FS IX
Coconut+ Banana + Poultry
+ Goat + Cow
892821.76
2557325.33
1964503.57
2.86
Mean
Standard Deviation
538326.9
335315.4
1094441
757719.1
600435
575716.5
2.06
0.54
*Duckery- pre 1000 layers;**Poultry- per 1000 layers;***Dairy- per cattle
Table 4. Existing vs Optimal plan for rice-based integrated farming systems of Kuttanad.
Particulars
Rice
Unit
FS I
FS II
P 01
P 11
P 02
P 12
Acres
3.09
1.28
2.34
1.26
3.09
1.20
67
85
Fishery
Acres
Duckery
Nos
Human Labour
MD
160
145
120
82
Working Capital
Rs.
185610.7
166866.5
58694.3
58694.3
Net Returns
Rs.
181724
220010
52814
67017
P 01 – P 02 shows Existing plans; P 11 – P 12 shows optimal plans;*Duckery unit shows no. of birds
274
�FS VI, FS VII and FS VIII. Human labour was fully
utilised in FS III, FS IV, FS VI, FS VII and FS IX.
Working capital was fully utilised in FS II and FS
VIII. The shadow prices of fully utilised resources
are presented in table 6. The shadow price of land
in FS IV is Rs.286177.9; this indicates that the net
income in Kuttanad could be increased by Rs.
286177.9 per additional acreage of farmland allotted for FS IV. The shadow price of labour in FS III
is Rs.285.3; this indicates that the net farm income
in Kuttanad could be increased by Rs. 285.3 per
additional man-days of labour allotted for FS III.
The existing use of resources in Kuttanad was
less than the optimum level, and these suggest
that optimum farming system models help in increasing the net income of the farm families. The
study conducted by Igwe and Onyenweaku (2013)
in Aba agricultural zone of Nigeria and Nataraja
(2016) in Chikkaballapura district, Karnataka also
found that existing resource used by farmers was
sub-optimal.
About 15 man-days of labour in FS I, 38 man-days
in FS II, 26 man-days in FS V and 69 man-days of
labour in FS VIII were left unused. Similarly, Rs.
6831 of working capital in FS III, Rs. 2825 in FS
V, Rs. 408 in FS VI, Rs. 8577 in FS VII and Rs.
6848 of capital in FS IX were left unused. These
results are in agreement with the findings of a
study conducted in Central Niger Delta of Nigeria by Allison (2009), suggesting that the other
complimentary resources available on the farm
are not enough to be combined with these unused resources in order to achieve the objective
of maximisation of net returns. Therefore, it is
necessary to increase the area under cultivation
and deploy more labour in order to utilise these
unused resources.
MD**
Rs.
Rs.
Human Labour
Working Capital
Net Returns
P 03 – P 09 shows Existing plans; P 13 – P 19 shows optimal plans; *Dairy unit indicates no of cows, Goat unit indicates no. of the goat; poultry unit indicates no. of birds; **MD – Man days
462367
192223
403222
368538 335568.6 497327.9 158224
152698
69291
25258
52055
Nos
Goat
31855
102395
47455
30318
93175
155
Nos
Dairy
54286
212
212
155
25
92714.3
96000
240124
90763.45 90763.45 61881.67 55033.58
86239
94816
94227
203
253
253
196
290
264
196
2.00
1.00
94635
88
134
0.84
1.00
0.53
46
2.00
1.00
1.00
1.00
23
25
1.00
60
1.00
13
58
Nos
Poultry
27
Acres
Banana
2.50
1.00
22
23
88
1.00
1.00
3.00
0.23
3.70
1.45
0.13
0.30
2.50
2.05
2.83
3.00
3.47
3.70
1.45
FS IX
FS VIII
FS VII
1.45
1.91
2.19
1.50
1.71
2.50
Acres
Coconut
Particulars
1.50
2.50
2.05
P 16
FS VI
P 06
P 15
FS V
P 05
P 14
FS IV
P 04
FS III
P 13
Unit* P 03
Table 5. Existing vs optimal plan for coconut-based integrated farming systems of Kuttanad.
P 07
P 17
P 08
P 18
P 09
P 19
Sabu, A. et al. / J. Appl. & Nat. Sci. 12(2): 270 - 276 (2020)
Conclusion
Integrated farming systems are viable option to
address the distress faced by small and marginal farmers. The study revealed that Coconut +
Banana + Dairy cow + Poultry+ Goat and Rice +
fish were the most profitable farming systems in
the study area, with a benefit-cost ratio of 2.86
and 2.63 respectively. The allied activities practised by the farmers like fishery, duckery, poultry and dairy enterprises appeared to complement the crop activities in the study area. The
farm resources in the existing plan were not
optimally allocated. The optimisation of farm
plans led to an increase in net returns and effective utilisation of available resources. The net
returns can be increased with additional units of
land/labour, as land and labour were the common resource constraint in all farming systems.
Farmers in Kuttanad can attempt to increase the
area under cultivation and deploy more labour in
order to utilise the excess resources and to realise
higher income.
275
�Sabu, A. et al. / J. Appl. & Nat. Sci. 12(2): 270 - 276 (2020)
Table 6. Shadow prices (Rupees) of fully utilized resources of Kuttanad.
Resources
FS I
FS II
FSIII
FS IV
FS V
FS VI
FS VII
FS VIII
FS IX
Land
Labour
Working
capital
FYM
N
-*
1.10
-
285.3
-
11953.2
44.78
-
4059.9
-
24895.09
310.74
-
286177.9
33.17
-
6749.33
0.73
761.05
-
-
308.98
-
-
-
-
-
-
2635.96
P
K
18.45
-
-
56.35
-
-
-
-
1109.82
-
Fish feed
-
105.06
-
9.91
234.00
2.88
122.82
-
-
*- sign indicates unused resources
REFERENCES
M.Sc. Thesis. Department of Agricultural Extension.
Kerala Agricultural University. Thrissur.
8. MSSRF (2007). Measures to Mitigate Agrarian Distress in Alappuzha and Kuttanad Wetland Ecosystem,
A Study Report, M. S. Swaminathan Research Foundation, Chennai.
9. Nataraja, H. M. (2016). An Economic Analysis of Integrated Farming System in Sidlaghatta Taluk of
Chikkaballapura District, Karnataka. M.Sc. Thesis.
Department of Agricultural Economics. University of
Agricultural Sciences. Bengaluru.
10.Oguru, Allison., Igben, M. S. and Chukwuigwe E. C.
(2009). “Revenue maximising combination of rice
monocrop and cassava-based farm enterprises in the
Central Niger Delta: A linear programming solution”.
Ghana Jnl. Agric. Sci., 42: 123-130. 10.4314/
gjas.v42i1-2.60651
11.Osti, Rajani and zhou, Deyi and Singh, Virendra and
Bhattarai, Dinesh and Choudhary, Harshika. (2016).
An economic analysis of poultry egg production in
Nepal. Pakistan Journal of Nutrition, 15: 715-724.
10.3923/pjn.2016.715.724.
12.Padmanabhan, P G., Narayanan, N. C. and
Padmakumar, K. G. (2001) Integrated Farming Systems, In Economic Viability of an Integrated and Sustainable Resource Use Model for Kuttanad. Kerala
Research Programme on Local Level Development,
Centre for Development Studies, Centre for Development Studies, Thiruvananthapuram pp 19-36.
1. Dadhwal, K and Tomar, Jagmohan and Muthiah,
Muruganandam and Kaushal, R. and Chaturvedi, Om
Prakash. (2012). Integrated Farming Systems for
Food and Nutritional Security in North Western Himalayas. Indian Forester, 138: 689-696 10.36808/if/20
12/v138i8/14129.
2. Felix, M., Judith, M., Jonathan, M., and Munashe, S.
(2013). Modelling a Small Farm Livelihood System using
Linear Programming in Bindura, Zimbabwe. Research.
J. Manag. Sci., 2 (5): 20-23. 10.5897/AJAR10.0 28.
3. Government of India (2019). “Agricultural Census
2015-16 (Phase-I)- All India Report on Number and
Area of Operational Holdings”: Department of Agriculture, Cooperation and Farmers Welfare, Ministry of
Agriculture and Farmers’ Welfare, New Delhi.p 97.
4. Government of India (2017). “Report of the Committee on Doubling of Farmers Income: Vol 1”, Ministry
of Agriculture and Farmers’ Welfare, Govt. of India,
New Delhi.
5. Government of Kerala (2019). “A Special Package
For Post-Flood Kuttanad”, Kerala State Planning
Board, Govt. of Kerala, Thiruvananthapuram.
6. Igwe, K. C. and Onyenweaku, C. E. (2013). A linear
programming approach to food crops and livestock
enterprises planning in Aba Agricultural Zone of Abia
State, Nigeria. Am. J. Exp. Agric., 3(2): 412-431.
7. Mamatha, G. Nair. (2017). Multidimensional Analysis
of Farmers of Integrated Farming system in Kuttanad.
276
�
 A Vidhyavathi