International Journal of Environmental Analytical
Chemistry
ISSN: 0306-7319 (Print) 1029-0397 (Online) Journal homepage: https://www.tandfonline.com/loi/geac20
Detection of equimolar EDTA and DTPA in spiked
wastewater effluents
Travis K. Sander, Astha Gautam, Sophia Sarpong-Kumankomah & Jürgen
Gailer
To cite this article: Travis K. Sander, Astha Gautam, Sophia Sarpong-Kumankomah
& Jürgen Gailer (2019) Detection of equimolar EDTA and DTPA in spiked wastewater
effluents, International Journal of Environmental Analytical Chemistry, 99:6, 541-556, DOI:
10.1080/03067319.2019.1600685
To link to this article: https://doi.org/10.1080/03067319.2019.1600685
Published online: 23 Apr 2019.
Submit your article to this journal
Article views: 34
View Crossmark data
Full Terms & Conditions of access and use can be found at
https://www.tandfonline.com/action/journalInformation?journalCode=geac20
INTERNATIONAL JOURNAL OF ENVIRONMENTAL ANALYTICAL CHEMISTRY
2019, VOL. 99, NO. 6, 541–556
https://doi.org/10.1080/03067319.2019.1600685
ARTICLE
Detection of equimolar EDTA and DTPA in spiked
wastewater effluents
Travis K. Sander, Astha Gautam, Sophia Sarpong-Kumankomah and Jürgen Gailer
Department of Chemistry and BSc Environmental Science Program, University of Calgary, Calgary/AB, Canada
ABSTRACT
ARTICLE HISTORY
Ethylenediaminetetraacetic acid (EDTA) and diethylenetriaminepentaacetic acid (DTPA) are water ‘softening’ agents that are present in numerous household and industrial detergents. Since these
particular chelating agents are not significantly degraded during
conventional wastewater treatment processes, wastewater treatment plant (WTP) effluents can contain up to 19 µM of EDTA and 7
µM of DTPA. Little, however, is known about the release of EDTA
and DTPA from WTPs to rivers. To gain insight, we here report on
the development of a cost-effective analytical method. This
method is based on the chromatography of a humic acidcadmium (HA-Cd) complex on a size-exclusion chromatography
column (SEC, Sephadex G-15) while using WTP effluents from
Lethbridge, Banff and Canmore which contained 10 mM Trisbuffer as the mobile phase (pH 8.2). The intact HA-Cd complex is
detected by means of a flame atomic absorption spectrometer
(FAAS). The addition of equimolar EDTA and DTPA up to 10 µM
allowed us to observe a concentration-dependent increase of the
retention time of the main Cd-peak. This behaviour was qualitatively comparable between the WTP effluents and was rationalised
by the EDTA/DTPA-mediated mobilisation of Cd from the HA-Cd
complex. The signal intensity that corresponded to the mobilised
Cd was used to establish calibration curves with corresponding
correlation coefficients in the range of 0.950–0.978. Therefore, the
developed method yields robust results for realistic concentrations
of equimolar EDTA/DTPA in real WTP effluents. The developed
method can now be applied to analyse real WTP effluent for the
presence of chelating agents, whose concentrations may be
expressed as being equivalent to a particular equimolar EDTA/
DTPA concentration.
Received 28 January 2019
Accepted 21 February 2019
KEYWORDS
Water quality; chelating
agents; EDTA; DTPA;
pollution quantification;
water-reuse
1. Introduction
EDTA and DTPA are synthetic chelating agents (CAs) which are present in a large variety
of consumer products (household/industrial detergents and personal care products) [1]
and are therefore commonly used worldwide in considerable quantities [2,3]. With
regard to EDTA (Figure 1), for example, ~34,000 t were consumed in Europe in 1999
[4]. While EDTA is known to be environmentally persistent [5,6] and its world production
is estimated at 100,000 t per year, a critical evaluation of its chemistry in natural waters is
CONTACT Jürgen Gailer
jgailer@ucalgary.ca
© 2019 Informa UK Limited, trading as Taylor & Francis Group
542
T. K. SANDER ET AL.
Figure 1. Chemical structure of the investigated chelating agents: EDTA and DTPA.
missing [7]. Surface waters, such as rivers may, therefore, contain up to 4 μM of EDTA [8]
and its concentration in municipal wastewater treatment plant (WTP) effluents can reach
up to 19 μM [9–11]. DTPA, a structurally related aminopolycarboxylate CA (Figure 1), is
consumed at comparable rates (14,732 t in Western Europe in 1999) [4] and has been
detected in WTP effluent from a paper recycling factory at concentrations of 7.3 μM [4].
Although EDTA and DTPA in themselves do not pose a problem to human health, there is
increasing concern with regard to the bioavailability of the metal complexes that these CAs
form in the environment [8,12,13]. To unravel the potentially unintended consequences that
the release of CAs from WTPs to rivers may have on the biogeochemical cycle of toxic
metals, such as lead (Pb) in the ecosystem downstream [14], it is necessary to gain insight
into their temporal release from WTPs. In India and China, for example, WTP effluents are
widely used for the irrigation of food crops [15] and 359,000 km2 of croplands worldwide
depend on the irrigation with urban wastewater[16]. Since this practice has already been
shown to adversely affect food safety [15] and will likely be used in more regions that are
affected by climate change, the development of analytical methods for their quantification
in WTP effluents must be a priority. While a few instrumental analytical methods for the
quantification of individual CAs in surface waters have been developed [3,17–23], faster and
more efficient analytical methods that can directly analyse WTP effluents without the need
for time-consuming sample treatment (i.e. derivatisation [19]) would be desirable.
Previously, we have reported on the analysis of a humic acid-Cd (HA-Cd) complex by
size-exclusion chromatography (SEC) coupled on-line to a flame atomic absorption
spectrometer (FAAS) as a Cd-specific detector [12]. The utilisation of a 10 mM Tris buffer
(pH 8.0) as the mobile phase allowed us to observe the intact HA-Cd complex, while the
addition of 2–20 µM of either EDTA, DTPA (Figure 1) or methylglycine diacetic acid
(MGDA) to this mobile phase resulted in a chelating agent-specific increase of the
retention time of the Cd-peak. This behaviour was rationalised by a partial or complete
CA-mediated abstraction of Cd from HA [12]. Since this approach allowed to observe the
mobilisation of Cd from HA at CA concentrations that are encountered in real WTP
effluent [12], we sought to adapt this approach for the analysis of EDTA and DTPAspiked WTP effluent. We chose these particular CAs because they are most widely used
and are therefore frequently present in WTP effluent [4]. After collecting WTP effluent
INTERNATIONAL JOURNAL OF ENVIRONMENTAL ANALYTICAL CHEMISTRY
543
from Lethbridge, Banff and Canmore, we added Tris buffer (pH 8.0) to achieve a final
concentration of 10 mM and then 1 µM, 3 µM, 5 µM, 7.5 µM and 10 µM of equimolar
EDTA/DTPA. Using these spiked WTP effluents as the mobile phase, we then employed
the SEC-FAAS system to observe the chromatographic behaviour of HA-Cd complex. Our
main motivation was to establish if the previously observed CA-mediated abstraction of
Cd2+ from HA can be observed in real WTP effluent (i.e. in the presence of a significant
matrix). Based on our previous results [12] the corresponding approach should allow to
detect realistic concentrations of the investigated CAs in a mixture in real WTP effluent
while avoiding time-consuming extraction/derivatisation steps [3] and expensive instrumental equipment [17].
2. Experimental
2.1. Chemicals and solutions
CdCl2 (>99%), tris(hydroxymethyl)aminomethane (≥99.5%, Trizma base), ethylenediaminetetraacetic acid (EDTA) disodium salt dihydrate (>99%), diethylenetriaminepentaacetic
acid (DTPA, ≥99%), sodium hydroxide (>97%) and humic acid (HA derived from natural
oxidised brown coal, technical grade, Lot #BCBN1711V, pH 6.4, carbon content: 43.12%,
hydrogen content: 3.95%, nitrogen content 0.99%; residue on ignition: 29.59%) were
acquired from Sigma-Aldrich (St. Louis, MO, United States). All solutions were prepared
with distilled water obtained from a Simplicity Water Purification System (Millipore,
Billerica, MA, USA).
2.2. Collection of WTP effluent and preparation of mobile phases
Effluent samples (0.85–1.0 L, 6 time points) were collected into acid-washed polypropylene
bottles after the UV treatment stage from the WTP in Lethbridge (November 20) starting at
6:30 am in 2 h intervals until 3:30 pm; Banff (November 29) starting at 9:00 am in 1 h intervals
until 2:00 pm and Canmore (December 13) starting at 9:00 am in 1 h intervals until 2:00 pm.
The WTP effluent samples were transported to Calgary in a cooler (4º), filtered (0.45 μm;
Whatman nylon filter membranes, GE Healthcare, Buckinghamshire, UK) and equal volumes
from each time point were mixed to obtain a representative WTP effluent sample. Each WTP
sample was then characterised by pH, total organic carbon (TOC), total nitrogen (TN) and
electric conductivity (EC) (Table 1). After the addition of 2.0 mL of a 1.25 M Tris buffer (pH 8.0)
to 250 mL WTP effluent aliquots, the pH of the buffered WTP effluent was in the range
Table 1. Physico-chemical characterisation of the collected, representative WTP effluent samples
after filtration.
Wastewater treatment
plant
pH
Lethbridge
8.06 ± 0.03
Banff
8.18 ± 0.01
Canmore
8.19 ± 0.01
a
Electrical conductivity (EC)
(μS/cm)a
1212 ± 2
718 ± 2
685 ± 2
Total organic carbon (TOC) Total nitrogen (TN)
(ppm)
(ppm)
9.1 ± 0.0
4.5 ± 0.0
5.0 ± 0.1
5.1 ± 0.0
7.4 ± 0.1
15.9 ± 0.3
For comparison the EC of tap water was 4.3 ± 0.4 μS/cm, DI water was 0.366 ± 0.001 μS/cm and 10 mM Tris buffer
(pH 8.0) was 463 ± 3 μS/cm.
544
T. K. SANDER ET AL.
between 8.22 and 8.25 (Symphony SB20 pH Meter, Thermo Electron Corporation, Beverly,
MA, USA). Thereafter, 250 mL aliquots of each Tris-buffered WTP effluent were spiked with 1
μM, 3 μM, 5 μM, 7.5 μM and 10 μM of EDTA and DTPA by adding 167 µL, 500 µL, 833 µL, 1250
µL or 1667 µL of 1.5 mM stock solutions of equimolar EDTA and DTPA, which were prepared
by dissolving 140 mg of Na2EDTA 2H2O and 148 mg DTPA in 10 mM Tris buffer pH 8.0 ± 0.02
and filling to the 250 mL mark. WTP effluents which either contained 7.5 μM EDTA or DTPA
were prepared in a similar manner.
2.3. Preparation of the HA-Cd complex
The HA-Cd complex was prepared as previously described [12]. In brief, 0.2 g HA
were added to a 100 mL volumetric flask and 10 mM Tris buffer (pH 8.0) was added
to the mark. The obtained slurry was stirred at room temperature for 16 h, filtered
(0.45 μm) and the clear brown solution was kept in a refrigerator overnight. This HA
solution was quantitatively transferred to a volumetric flask and 250 μL of a 5000 mg
Cd L−1 solution were added in a dropwise manner while stirring in 60 s intervals. The
brown solution which contained a HA-Cd complex contained 5 μg of Cd and 1.0 mg
of HA per 0.5 mL (pH 7.78 ± 0.02), which based on the MW of the HA of 4 kDa
corresponds to one HA molecule labelled by 5 Cd2+2ions. This HA-Cd stock solution
was kept in a refrigerator (4ºC) from which aliquots (~3.0 mL) were removed for each
experiment.
2.4. Analytical methods
The employed HPLC system consisted of a 426 HPLC Pump (Alltech Associates, Inc.,
Deerfield, IL, USA), a manually packed 30 × 1.0 cm (I.D.) Sephadex G-15 size-exclusion
chromatography glass column (fractionation range: 1,500–100 Da) and a Rheodyne six-port
injection valve, which was equipped with a 500 μL PEEK sample-loop. The flow rate was
1.0 mL min−1, and the void volume was determined by injecting Blue Dextrane (v0 = 572 s).
To detect the HA-Cd complex in the column effluent, the column exit was connected to the
pneumatic nebuliser of the FAAS with PEEK tubing (20 cm). Cd-specific detection at 228.8
nm (bandpass 0.7 nm) was accomplished with a Buck Model 200A flame atomic absorption
spectrometer (FAAS)(Buck Scientific, East Norwalk, CT, USA). The FAAS was operated with
an air/acetylene flame (oxidant pressure: 241 kPa, fuel pressure: 83 kPa). The column was
equilibrated with each WTP effluent mobile phase for 75 min at a flow rate of 1.0 mL/min
before the HA-Cd complex was injected (quadruplicate analysis). After every analysis, the
column was cleaned with 0.2 M NaOH (flow rate: 1.0 ml/min) for 1 h followed by rinsing
with distilled water from the Simplicity Water Purification System using the same flow rate
for 1 h. Raw chromatographic data (i.e. the obtained Cd-specific chromatograms) were
smoothed using Sigmaplot 14.0 software and the Cd-peaks were integrated using
OriginPro software (version 9.1). The obtained Cd-specific chromatograms were integrated
up to 1500 s. The raw data (Salsa Software) were imported into Sigmaplot 14.0 and
smoothed using the bi-square algorithm.
INTERNATIONAL JOURNAL OF ENVIRONMENTAL ANALYTICAL CHEMISTRY
545
3. Results
WTP effluents contain a large number of pharmaceuticals and heavy metals that can
adversely affect the aquatic ecosystem downstream [24–27]. In fact, >36 polar pollutants
were initially identified in European WTP effluent [28], while more recent studies have
identified 160 micropollutants. These facts constitute major public health concerns all
around the world [27]. CAs represent another important class of pollutants that are
present in WTP effluents at comparatively high concentrations [28]. In fact, the average
EDTA concentration in WTP effluents is one of the highest of synthetic chemicals in
municipal WTP effluents [27]. Since CAs may, therefore, play an important role in
mediating the effect that toxic metals have on the ecosystems downstream [29], it is
important to gain insight into their release via the effluent stream. While the development of analytical methods to quantify individual CAs in surface waters has been
reported [3,17,19], we investigated if the inherent capability of EDTA and DTPA to
mobilise Cd2+ from HA [12] may be exploited to detect multiple CAs in WTP effluents.
This conceptual approach offers the considerable advantage of completely avoiding
time-consuming sample preparation steps and involves comparatively cost-effective
equipment. To leave the physico-chemical conditions compared to our previous studies
largely unchanged, we added a concentrated Tris-buffer (pH 8.0, 1.25 M) to the filtered
WTP effluent to achieve a final concentration of 10 mM and then chromatographed a
HA-Cd complex as a function of increasing equimolar EDTA/DTPA in the WTP effluents.
In order to streamline the discussion that follows, we will shorten the term ‘WTP
effluent that has been amended with 10 mM Tris buffer pH 8.0ʹ to ‘WTP effluent’. The
retention time of all Cd peaks and corresponding peak areas are depicted in Table 2. To
enhance the clarity of the following discussion, we will first describe the results that
were obtained with WTP effluent from Lethbridge and then those obtained with WTP
effluent from Banff and Canmore. Thereafter, the results of the investigated WTP
effluents will be compared to each other to critically evaluate the developed SECFAAS method in terms of its advantages, disadvantages as well as its robustness to
reliably detect these particular CAs in real WTP effluents from Lethbridge, Banff and
Canmore.
3.1. Lethbridge effluent
Owing to the considerable matrix that is present in real WTP effluents, we expected the
Cd recovery̶ defined as the fraction of the total injected Cd (5 µg) that eluted from the
column̶ to be adversely affected. Indeed, the total Cd-peak area that was obtained for
the HA-Cd complex using WTP effluent (4.823 ± 0.117 AU s) was significantly smaller
compared to that for the HA-Cd complex using 10 mM Tris buffer (pH8.0)[9.473 ± 0.251
AU s], which translates to a Cd recovery of 44%[12]. Thus, 56% of Cd were lost to the
column when the HA-Cd complex was chromatographed with real WTP effluent. While
this loss of Cd is undesirable, one needs to recognise that only 5 µg of Cd were injected
as the HA-Cd complex. The fact that 44% of the injected HA-Cd complex remained
intact during the chromatographic process, however, allowed us to systematically
investigate the retention behaviour of the HA-Cd complex as a function of increasing
equimolar EDTA/DTPA. One needs to be aware, however, that all obtained Cd-specific
546
T. K. SANDER ET AL.
Table 2. Results obtained for the analysis of an HA-Cd complex by SEC-FAAS using mobile phases that were comprised of WTP effluents collected from
Lethbridge, Banff and Canmore containing 10 mM Tris-buffer (~pH 8.2) without or spiked with EDTA and DTPA.
Lethbridge
Concentration of EDTA & DTPA
(μM)
0
1
3
5
7.5
10
7.5 EDTA
7.5 DTPA
HA-Cd control (Tris buffer)
Retention time (s)
pH
8.25 ± 0.01
8.23 ± 0.01
8.24 ± 0.01
8.23 ± 0.01
8.22 ± 0.01
8.24 ± 0.01
8.23 ± 0.02
8.23 ± 0.02
8.05 ± 0.03
Banff
Canmore
Retention time (s)
Retention time (s)
Peak area
Peak area
(AU*s)
pH
(AU*s)
pH
HA-Cd
CA-Cd
HA-Cd
CA-Cd
HA-Cd
CA-Cd
588 ± 1
4.823 ± 0.117 8.38 ± 0.01 563 ± 1
3.764 ± 0.160 8.44 ± 0.02 560 ± 1
569 ± 4
7.877 ± 1.154 8.19 ± 0
564 ± 3
5.105 ± 1.321 8.41 ± 0.02 563 ± 1
574 ± 2
10.513 ± 0.991 8.41 ± 0.01 572 ± 4
11.962 ± 2.079 8.40 ± 0.01 568 ± 1
568 ± 4 724 ± 12 6.706 ± 0.391 8.38 ± 0.01 577 ± 3 714 ± 14 9.958 ± 0.477 8.36 ± 0.01 571 ± 3
693 ± 7
6.277 ± 0.434 8.38 ± 0.02
714 ± 15 9.954 ± 1.325 8.51 ± 0.02
695 ± 12
698 ± 8 10.009 ± 0.352 8.39 ± 0.01
685 ± 5
9.636 ± 0.250 8.58 ± 0.02
680 ± 2
N/D
N/D
8.975 ± 1.724 8.42 ± 0.01 566 ± 5 721 ± 14 9.594 ± 0.253 8.58 ± 0.01 556 ± 6
N/D
N/D
763 ± 4 10.794 ± 1.188 8.40 ± 0.01 584 ± 2 773 ± 9 11.091 ± 2.801 8.60 ± 0.01 573 ± 2
N/D
586 ± 2
9.473 ± 0.251 8.05 ± 0.03 586 ± 2
9.473 ± 0.251 8.05 ± 0.03 586 ± 2
Peak area
(AU*s)
3.270 ± 1.061
6.166 ± 1.837
11.666 ± 1.311
10.517 ± 0.951
10.025 ± 0.683
11.685 ± 0.697
8.585 ± 1.145
14.447 ± 1.821
9.473 ± 0.251
INTERNATIONAL JOURNAL OF ENVIRONMENTAL ANALYTICAL CHEMISTRY
547
chromatograms are actually comprised of two contributing factors, namely the CAmediated mobilisation of Cd from the injected HA-Cd complex and the CA-mediated
decreased adsorption of total Cd species to the stationary phase. The latter contributing factor is conceptually likely to result in increasing Cd recovery values as the
concentration of CAs in the WTP effluent is increased. Representative Cd-specific
chromatograms that were obtained with the CA-spiked WTP effluents are depicted in
Figure 2.
Using WTP effluent, the injection of an HA-Cd complex resulted in a brown band that
migrated through the column bed and produced a single Cd-peak with a retention time
(tr) of 588 ± 1 s (Figure 2(a)) and a total Cd area of 4.823 ± 0.117 AU s. The retention time
of this Cd-peak was close to that obtained when the HA-Cd complex was chromatographed with 10 mM Tris buffer pH 8.0 (tr = 586 ± 2 s; total Cd area 9.473 ± 0.251 AU s).
The Cd-specific chromatogram that was obtained with 1.0 µM of EDTA/DTPA in WTP
effluent (Figure 2(b)) revealed a distinct Cd-peak (tr = 569 ± 4 s) followed by several
poorly separated Cd-peaks of lower intensity. The distinct Cd-peak had a ~ 20 s smaller
retention time than that detected with unspiked WTP effluent (Figure 2(a)) and corresponds to a fraction of the parent HA-Cd complex from which Cd2+ was not mobilised,
likely due to the existence of comparatively strong Cd2+2 binding sites. The 19s smaller
retention time of this Cd-peak is attributed to a conformational change that is associated
with the removal of Cd2+ from the weaker HA binding sites. The low-intensity Cd-peaks
that eluted thereafter correspond to Cd-CA complexes, which interacted with the stationary phase as was previously observed [12]. The total Cd-peak area of 7.877 ± 1.154
AU s indicates that the presence of 1.0 µM EDTA/DTPA in the WTP effluent notably
increased the Cd recovery from 44% to 72% and is attributed to the reduced adsorption
of Cd species to the stationary phase.
Figure 2. Representative Cd-specific chromatograms that were obtained for the analysis of a HA-Cd
complex with WTP effluent from Lethbridge that contained 10 mM Tris (pH 8.0) (a), or WTP effluent
from Lethbridge that contained 10 mM Tris (pH 8.0) and was spiked with 1 µM (b), 3 µM (c), 5 µM
(d), 7.5 µM (e) and 10 µM (f) of equimolar EDTA/DTPA. SEC column: Sephadex G-15 (30 x 1.0 cm);
flow rate: 1.0 mL/min; injection volume: 0.5 mL (5.0 µg of Cd); detector: FAAS at 228.8 nm.
548
T. K. SANDER ET AL.
Using WTP effluent which contained 3 µM EDTA/DTPA revealed the presence of the
same distinct HA-Cd complex (tr = 574 ± 2 s) followed by a more intense Cd-peak
cluster, which reached the baseline at ~1200 s (Figure 2(c)). The total Cd-peak area of
10.513 ± 0.991 AU s (Cd-recovery: 95%) indicates a further decrease of the matrixmediated adsorption of total Cd to the column.
An increase of the WTP effluent concentration to 5 µM EDTA/DTPA resulted in a 30%
decrease in the intensity of the distinct HA-Cd complex peak (tr = 568 ± 4 s) and the
elution of a broad Cd-peak (tr = 724 ± 12 s), which reached the baseline at ~1000
s (Figure 2(d)) and corresponded to a Cd-peak area of 6.706 ± 0.391 AU s (Cd-recovery:
61%). Thus, less Cd eluted from the column compared to 3 µM EDTA/DTPA. While the
underlying cause for this comparatively low Cd recovery is unknown, we have observed
similar results in our previous experiments[12].
WTP effluent which contained 7.5 µM EDTA/DTPA resulted in the elution of essentially
a single Cd-peak (tr = 693 ± 7 s; Figure 2(e)), which exhibited a very minor contribution from
the parent HA-Cd complex. The Cd-peak intensity decreased to baseline at ~900 s, and the
total Cd-peak area was 6.277 ± 0.434 AU s, which corresponds to a Cd-recovery of 57%. This
observation is somewhat reminiscent to the results obtained with 5.0 µM EDTA/DTPA.
The results obtained with WTP effluent that contained 10 µM EDTA/DTPA were
qualitatively similar to those for 7.5 µM EDTA/DTPA. A single Cd-peak (tr = 698 ± 8 s)
was observed, which had a total Cd-peak area of 10.009 ± 0.352 AU s (Cd-recovery: 91%).
We also investigated the chromatographic retention behaviour of the HA-Cd complex
with WTP effluent that contained 7.5 µM of each EDTA or DTPA and compared the results
to those obtained with WTP effluent that contained 7.5 µM of both CAs (Figure 3, black
line). As expected, the effect that EDTA had, when compared to DTPA, on the stability of
the HA-Cd complex differed significantly because EDTA is a hexadentate ligand, which
exerts a lower complex formation constant with Cd (log K = 16.4) than the octadentate
ligand DTPA (log K = 19.0). Using WTP effluent that contained 7.5 µM EDTA resulted in
a rather distinct HA-Cd peak, which was comparable to those observed with the WTP
effluent that contained 1–5 µM of both CAs (Figure 2(bd)) and a rather broad Cd-peak
cluster that did not return to baseline at 1200 s (Figure 3, black line). These results
demonstrate that the on-column formed Cd-EDTA complexes have a considerable affinity
for the stationary phase, which is in accord with our previous observations[12]. WTP
effluent that contained 7.5 µM of DTPA produced a notably different Cd-peak cluster
than that obtained with equimolar EDTA. The fact that the intensity of the Cd-peak reached
baseline at ~950 s (Figure 3(b), black line) demonstrates that the on-column formed CdDTPA complexes have a lower affinity for the stationary phase. Further evidence in support
of this behaviour comes for the fact that the total Cd area was 10.794 ± 1.188 AU
s compared to the Cd-EDTA complexes, which was 8.975 ± 1.724 AU s. The results that
were obtained with the individual CAs do not show an additive effect and cannot be used
to predict the results that are obtained when both CAs were present because EDTA and
DTPA compete for the finite number on Cd2+ ions bound to the HA.
3.2. Banff effluent
The total Cd-peak area that was obtained for the HA-Cd complex using this WTP effluent as
the mobile phase (3.764 ± 0.160 AU s) was also considerably smaller than that for the HA-Cd
INTERNATIONAL JOURNAL OF ENVIRONMENTAL ANALYTICAL CHEMISTRY
549
Figure 3. Representative Cd-specific chromatograms that were obtained for the analysis of an HA-Cd
complex with WTP effluents from Lethbridge, Banff and Canmore that were spiked with 7.5 µM
EDTA (top), DTPA (middle) and 7.5 µM DTPA and EDTA (bottom). SEC column: Sephadex G-15 (30
x 1.0 cm); flow rate: 1.0 mL/min; injection volume: 0.5 mL (5.0 µg of Cd); detector: FAAS at 228.8 nm.
complex using 10 mM Tris buffer (pH8.0) [9.473 ± 0.251 AU s] (Figure 4). These results
translate to a total Cd recovery of 40%, which is slightly lower than the corresponding
value with the Lethbridge WTP effluent. Using unspiked WTP effluent, the injection of a HACd complex resulted in a single Cd-peak with a retention time of 563 ± 1 s (Figure 4(a)), which
was shorter than the HA-Cd complex when chromatographed with 10 mM Tris buffer pH 8.0
(tr = 586 ± 2 s; total Cd area 9.473 ± 0.251 AU s). This 23s reduced retention time correlates
with the smaller EC of this WTP effluent compared to that from Lethbridge (Table 1) and can
be rationalised in terms of a larger hydrodynamic radius of the HA-Cd complex. Overall, the
Cd-specific chromatograms that were obtained with the CA spiked WTP effluent from Banff
550
T. K. SANDER ET AL.
Figure 4. Representative Cd-specific chromatograms obtained for the analysis of a HA-Cd complex
either with WTP effluent from Banff that contained 10 mM Tris (pH 8.0) (a), or WTP effluent from
Banff that contained 10 mM Tris (pH 8.0) and was spiked with 1 µM (b), 2 µM (c), 5 µM (d), 7.5 µM (e)
and 10 µM of equimolar EDTA/DTPA. SEC column: Sephadex G-15 (30 x 1.0 cm); flow rate: 1.0 mL/
min; injection volume: 0.5 mL (5.0 µg of Cd); detector: FAAS at 228.8 nm.
(Figure 4(bf)) were rather similar compared to those from Lethbridge (Figure 2(bf)) and they
will therefore not be described in detail. The total Cd areas that were obtained with the
various CA concentrations are summarised in Table 2, while the results for the individual
EDTA/DTPA spiked WTP effluent are depicted in Figure3 (red line).
3.3. Canmore effluent
The total Cd-peak area that was obtained for the HA-Cd complex using this WTP effluent
(3.270 ± 1.061 AU s) was also considerably smaller than that for the HA-Cd complex using
10 mM Tris buffer (pH8.0)[9.473 ± 0.251 AU s] (Figure 5). These results translate to a total Cd
recovery of 35%, which is comparable to the value that was obtained with the Banff WTP
effluent. Using unspiked WTP effluent, the injection of a HA-Cd complex resulted in a single
Cd-peak with a retention time of 560 ± 1 s (Figure 5(a)), which was also shorter than that
when the HA-Cd complex was chromatographed using 10 mM Tris buffer pH 8.0 as the
mobile phase (tr = 586 ± 2 s). This 26s reduced retention time is in accord with the results
obtained with the WTP effluent from Banff. Overall, the Cd-specific chromatograms that
were obtained with the CA spiked WTP effluent from Canmore (Figure 5(bf)) were rather
similar compared to those from Banff (Figure 4(bf)) and they will therefore not be described
in detail. The total Cd areas that were obtained with the various CA concentrations are
summarised in Table 2, while the results for the individual EDTA/DTPA spiked WTP effluent
are depicted in Figure 3 (blue line).
4. Discussion
The results of the studies that are presented in this manuscript represent an extension of
our previous studies in which we investigated the chromatographic retention behaviour
INTERNATIONAL JOURNAL OF ENVIRONMENTAL ANALYTICAL CHEMISTRY
551
Figure 5. Representative Cd-specific chromatograms obtained for the analysis of a HA-Cd complex
either with WTP effluent from Canmore that contained 10 mM Tris (pH 8.0) (a), or WTP effluent from
Canmore that contained 10 mM Tris (pH 8.0) and was spiked with 1 µM (b), 2 µM (c), 5 µM (d), 7.5
µM (e) and 10 µM of equimolar EDTA/DTPA. SEC column: Sephadex G-15 (30 x 1.0 cm); flow rate:
1.0 mL/min; injection volume: 0.5 mL (5.0 µg of Cd); detector: FAAS at 228.8 nm.
of the same HA-Cd complex on the same SEC stationary phase using 10 mM Tris buffer
(pH 8.0) which contained increasing concentration of individual CAs as the mobile phase
[12]. Two notable differences of the results from this study compared to those from the
previous study are recognisable.
Previously, the retention time of the Cd-peak that was observed after the HA-Cd
complex was chromatographed increased by 30 s or 16 s when 20 µM of EDTA or DTPA
were added to the 10 mM Tris buffer (pH 8.0) mobile phase[12]. These results are in
contrast to those of the present study where the retention time of the Cd-peak that
was obtained when the HA-Cd complex was chromatographed with WTP effluent that
was amended with 10 µM EDTA and DTPA increased by ~100 s (Table 2). A likely
explanation for this behaviour is that the matrix of the WTP effluents (either the
contained polar pollutants and/or the ionic matrix) increased the interaction of the oncolumn formed Cd-EDTA/DTPA complexes with the Sephadex G-15 stationary phase.
Given the existence of free hydroxyl-groups on this stationary phase, it is conceivable
that these functional groups play an important role in terms of mediating this
increased interaction.
Furthermore, in the present study the addition of 1–5 µM EDTA/DTPA to the WTP
effluent mobile phase resulted in the mobilisation of Cd from weak HA binding sites,
while a minor fraction of the Cd ions remained bound to strong HA binding sites. This
behaviour was not observed in our previous study, [12] which was conducted with
a 10 mM Tris buffer (pH 8.0) as the mobile phase. Therefore, this observation must be
attributed either to the matrix and/or the increased EC of the employed WTP effluent
mobile phases. Since the EC of 10 mM Tris buffer (pH 8.0) was 463 ± 3 µS/cm, whereas
the EC of the WTP effluents was in the range of 685–1212 µS/cm, the higher EC may
have exerted a conformational change of the HA-Cd complex when the latter was
injected and immediately interacted with the mobile phase. Thereafter, EDTA/DTPA
552
T. K. SANDER ET AL.
interacted with the ‘altered’ HA-Cd complex, with 4 Cd2+ [2]+ ions being mobilised from
the HA, while one Cd2+2 ion remained bound to strong binding sites on the HA.
The 50–65% loss of Cd to the column when three different WTP effluents were used
(compared to 10 mM Tris buffer pH 8.0) is attributed to the matrix-mediated partial
adsorption of Cd species to the stationary phase. Another possibility for this loss is the
displacement of Cd from the HA by other metal ions that are present in the WTP effluent
followed by the subsequent adsorption of the liberated Cd2+ ions to the stationary phase.
Real WTP effluents contain other metal ions that may affect/participate in the complex
equilibria that unfold when the HA-Cd complex is chromatographed. Since at >3 µM EDTA/
DTPA in the WTP effluent the metal concentrations will not matter as their concentration is
much smaller compared to that of EDTA/DTPA, only the situation with the 1 µM EDTA/DTPA
in the WTP effluents needs to be discussed. The complex stability constants (log K) of Ca2+
and Mg2+ for EDTA/DTPA are smaller than those for Cd [2, 17]. Therefore, their presence in
the WTP effluents is irrelevant. WTP effluents, however, also contain Zn 2+2 and Fe3+. With
regard to Zn2+ the log K for EDTA is identical to that of Cd2+ (log K = 16.4) and that for DTPA
is smaller compared to that of Cd2+ (log K = 18.3 vs log K = 19.0). Thus, Cd2+ will be mobilised
from the HA. With regard to Fe3+, its log K for EDTA is larger than that for Cd2+ (log K = 25.0
vs log K = 16.4) and the same holds true for DTPA (log K = 28.0 vs log K = 19.0). In the WTP
effluents that were spiked with 1 µM of EDTA/DTPA, all Fe3+ will be complexed and only
free/leftover EDTA/DTPA will be able to mobilise Cd2+ from the HA. Since this was observed
with all WTP effluents (Figures 2, 4, 5), the Fe3+ concentration therein must have been
smaller than the total concentration of EDTA and DTPA (i.e. 2 µM).
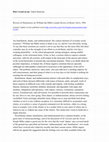
In order to extract quantitative results from the obtained data, it is evident from Figures
2, 4 and 5 that the signal intensity of the second, broad Cd-peak which corresponds to CACd complexes increased with the total concentration of both CAs in the WTP effluent. We,
therefore, plotted the concentration of equimolar EDTA/DTPA in the WTP effluent against
the signal intensity of the second Cd-peak at a retention time of 700 s for effluent
collected from Lethbridge, Banff and Canmore (Figure 6). These results revealed rather
similar slopes, linear correlation coefficients in the range 0.954–0.978 indicating that the
developed method is robust. We note that at 1 µM EDTA/DTPA in WTP effluent the
intensity of the analytical signal, i.e. the Cd peak intensity at 700 s does not fall onto the
calibration curve, but that at >2 µM EDTA/DTPA the quantification is more accurate.
Collectively, these data indicate that the developed method should be able to detect
realistic concentrations of CA in WTP effluent. Given that real WTP effluent may contain
several CAs, the results that are obtained with the developed method would allow one to
express the results that are obtained with this method in terms of ‘being equivalent to
a concentration of x µM EDTA/DTPA’.
Overall, the most relevant finding of our investigations is that the developed method
can reliably detect ≥2 µM of equimolar EDTA/DTPA in real WTP effluents. Apart from the
fact that no time-consuming sample pretreatment of the WTP effluent is necessary and
that results can be obtained in < 20 min, the employed instrumental analytical equipment
is considerably more cost-effective compared to previously reported analytical methods
[3,17]. Arguably the most important advantage of the developed method is the fact that
the underlying detection principle (i.e. the CA-mediated mobilisation of Cd from HA)
allows to detect multiple CAs in WTP effluent, which is important considering at least
13 other chelating agents, which can be structurally classified as aminopolycarboxylates,
INTERNATIONAL JOURNAL OF ENVIRONMENTAL ANALYTICAL CHEMISTRY
553
Figure 6. Calibration curve obtained by plotting the observed Cd-signal signal intensity at retention
time 700 s (corresponding to the presence of CA-Cd complexes) with equimolar EDTA/DTPA in WTP
effluents obtained from Lethbridge (blue), Banff (red) and Canmore (green).
hydroxycarboxylates or organophosphonates have been detected in WTP effluent [4]. The
single most important disadvantage of the developed method is that no precise information about the concentration of each CAs that is present in any given WTP effluent can be
obtained.
The practical value of the developed method pertains to the fact that it is ideally suited to
analyse WTP effluents for CAs. This information in itself is of considerable practical use since
EDTA-based soil remediation is moving from the exploratory scale to the scale of demonstrational facilities, and the focus of investigation is, therefore, shifting from remediation
efficiency to possible negative environmental side-effects[30]. The rapid assessment of
wastewaters for CAs is also destined to become progressively more important as water
scarcity is projected to increase in various parts of the world [31]. In parts of India, China and
other regions that suffer from severe drought WTP effluents are already utilised for the
irrigation of food crops, [15,16] which has been demonstrated to result in an inadvertent
uptake of Cd. This uptake is most likely caused by the fact that CAs form complexes with
toxic Cd and Pb species which bioavailable and are uptaken by periphyton in rivers [29,32]
and into food crops [12,33]. The developed method represents a useful tool to help mitigate
this problem and constitutes a unique research tool to address two important environmental issues. Firstly, WTP effluent that contains comparatively high concentrations of CAs
could be diverted into holding tanks for their subsequent degradation using established
degradation methods to significantly increase water reuse, which is not yet widely executed
in Canada [34] but may have to be embraced in the near future[35]. To this end, it has long
been known that EDTA can be photochemically degraded after Fe3+ or Cu2+ 2 is added
[7,36]. The developed method is ideally suited to develop faster processes to degrade CAs.
554
T. K. SANDER ET AL.
Secondly, the developed method may also be employed to obtain a more detailed understanding of the mechanisms by which anthropogenic activities perturb the biogeochemical
cycling of Cd downstream of WTPs [37], which is a starting point to improve the regulatory
framework to curb its influx into human tissues [38,39].
5. Conclusion
Global water pollution is of increasing public health concern [26]. EDTA and DTPA are
frequently present in WTP effluent at low µM concentrations, [13] which may adversely
affect the aquatic ecosystems downstream of WTPs [8] and compromise food safety if
it is used for the irrigation of food crops. Considering that climate change-induced
water stress will force more regions to utilise WTP effluent for the irrigation of food
crops, the analysis of WTP effluents for CAs will become more important. We obtained
representative WTP effluents from Lethbridge, Banff and Canmore, added 1–10 μM of
equimolar EDTA/DTPA to each effluent and then chromatographed an HA-Cd complex.
The CA-mediated abstraction of Cd from the HA-Cd complex resulted in the elution of
a new Cd-peak, the intensity of which correlated strongly with the concentration of
EDTA/DTPA in the WTP effluent mobile phase (r [2]= 0.954–0.978). Although WTP
effluents may contain many other CAs in addition to EDTA and DTPA [17], the developed method will detect all CAs that are present at a sufficient concentration to
mobilise Cd from the HA-Cd complex. Hence, the developed method is useful to
gain insight into the temporal release of CAs of WTP effluents (hourly/weekly/seasonally) into rivers. Perhaps most importantly, this method is particularly useful to help
mitigate the known problems that are associated with the practice of using WTP
effluent for the irrigation of food crops [15], which is inherently problematic because
certain CA-Cd complexes that are present therein are known to be absorbed into the
root system [14,40]. The subsequent translocation of Cd to the edible parts of food
crops may ultimately compromise food safety, [15] which must be avoided at all costs
since contaminated foods have become the dominant source of human exposure to
environmental Cd. In fact, many durum wheats grown in North America often exceed
the maximum food safety limit of 200 ppb of Cd[33]. Faced with the challenge to
produce enough food to feed 9 billion people by 2050 [41], it will become progressively more important to better understand the mechanisms by which toxic metals
inadvertently invade the food chain and ultimately human tissues. The role that
environmentally abundant CAs [42–44] and small molecular weight thiols play in this
context [45] clearly deserves more attention in the near future. To this end, it is
important to better understand the phytoavailability and translocation of CA-Cd complexes at the soil–plant interface [13,46] to better hitherto unknown sources of the
chronic exposure of humans to environmental chemicals [47–51].
Acknowledgments
This research was funded by the Natural Sciences and Engineering Research Council (NSERC) of
Canada. Farzin Malekani is gratefully acknowledged for measuring the TOC and TN concentrations
in the WTP effluent samples and Duane Guzzi (Lethbridge WTP), Bryant Rathbone (Banff WTP) and
Dennis Letourneau (Canmore WTP) for their help in obtaining WTP effluent samples.
INTERNATIONAL JOURNAL OF ENVIRONMENTAL ANALYTICAL CHEMISTRY
555
Disclosure statement
No potential conflict of interest was reported by the authors.
Funding
This work was supported by the National Science and Engineering Research Council of Canada
[RGPIN-2014-04156].
References
[1] P.C. DeLeo, M. Ciarlo, C. Pacelli, W. Greggs, E.S. Williams, W.C. Scott, Z. Wang and B.
W. Brooks, ACS Sustainable Chem. Eng. 6, 2094 (2018). doi:10.1021/
acssuschemeng.7b03510.
[2] I.S.S. Pinto, I.F.F. Neto and H.M.V.M. Soares, Environ. Sci. Pollut. Res. 21, 11893 (2014).
doi:10.1007/s11356-014-2592-6.
[3] J.J. Jimenez, Anal. Chim. Acta 770, 94 (2013). doi:10.1016/j.aca.2013.01.060.
[4] T.P. Knepper, Trends Anal. Chem. 22 708–724 (2003). doi:10.1016/S0165-9936(03)01008-2.
[5] B. Nowack, R. Schulin and B.H. Robinson, Environ. Sci. Technol. 40, 5225 (2006).
[6] M. Bucheli-Witschel and T. Egli, FEMS Microbiol. Rev. 25, 69 (2001). doi:10.1111/j.15746976.2001.tb00572.x.
[7] B. Nowack, Environ. Sci. Technol. 36, 4009 (2002).
[8] C. Oviedo and J. Rodriguez, Quim. Nova. 26, 901 (2003). doi:10.1590/S010040422003000600020.
[9] W.W. Bedsworth and D.L. Sedlak, J. Chromatogr. A. 905, 157 (2001).
[10] M. Fuehrhacker, G. Lorbeer and R. Haberl, Chemosphere. 52, 253 (2003). doi:10.1016/S00456535(03)00037-7.
[11] E. Bloem, S. Haneklaus, R. Haensch and E. Schnug, Sci. Total. Environ. 577, 166 (2017).
doi:10.1016/j.scitotenv.2016.10.153.
[12] A.E. North, S. Sarpong-Kumankomah, A.R. Bellavie, W.M. White and J. Gailer, J. Environ. Sci.
57, 249 (2017). doi:10.1016/j.jes.2017.02.004.
[13] T. Karak, R.K. Paul, D.K. Das and R.K. Boruah, Environ. Monit. Assess. 188, 670 (2016).
doi:10.1007/s10661-016-5685-5.
[14] L.A. Schaider, D.R. Parker and D.L. Sedlak, Plant Soil. 286, 377 (2006). doi:10.1007/s11104006-9049-8.
[15] S. Khan, Q. Cao, Y.M. Zheng, Y.Z. Huang and Y.G. Zhu, Environ. Pollut. 152, 686 (2008).
doi:10.1016/j.envpol.2007.06.056.
[16] A.L. Thebo, P. Drechsel, E.F. Lambin and K.L. Nelson, Environ. Res. Lett 12, 074008 (2017).
doi:10.1088/1748-9326/aa75d1.
[17] T.P. Knepper, A. Werner and G. Bogenschuetz, J. Chromatogr. A. 1085, 240 (2005).
[18] C.Z. Xie, T. Haley, P. Robinson and K. Stewart, Int. J. Environ. Ecol. Eng. 2, 82 (2008).
[19] J.B. Quintana and T. Reemtsma, J. Chromatogr. A. 1145, 110 (2007). doi:10.1016/j.
chroma.2007.01.044.
[20] R. Geschke, M. Zehringer and J. Fresen., Anal. Chem. 357, 773 (1997). doi:10.1007/
s002160050247.
[21] R.L. Sheppard and J. Henion, Electrophoresis. 18, 287 (1997). doi:10.1002/elps.1150180218.
[22] M. Sillanpaa, R. Kokkonen and M.-L. Sihvonen, Anal. Chim. Acta. 303, 187 (1995).
doi:10.1016/0003-2670(94)00535-T.
[23] J.J. Jimenez, Talanta. 116, 678 (2013). doi:10.1016/j.talanta.2013.07.052.
[24] J. Munoz, M.J. Gomez-Ramos, A. Aguera, J.F. Garcia-Reyes, A. Molina-Diaz and A.
R. Fernandez-Alba, Trends Anal. Chem. 28, 676 (2009). doi:10.1016/j.trac.2009.03.007.
556
T. K. SANDER ET AL.
[25] T.J. Stewart, R. Behra and L. Sigg, Environ. Sci. Technol. 49, 5044 (2015). doi:10.1021/
es505289b.
[26] R.P. Schwarzenbach, T. Egli, T.B. Hofstetter, U. von Gunten and B. Wehrli, Annu. Rev. Environ.
Resour. 35, 109 (2010). doi:10.1146/annurev-environ-100809-125342.
[27] J. Margot, L. Rossi, D.A. Barry and C. Holliger, WIREs Water. 2, 457 (2015). doi:10.1002/
wat2.1090.
[28] T. Reemtsma, S. Weiss, J. Mueller, M. Petrovic, S. Gonzales, D. Barcelo, F. Verntura and T.
P. Knepper, Environ. Sci. Technol. 40, 5451 (2006).
[29] P. Bradac, R. Behra and L. Sigg, Environ. Sci. Technol. 43, 7291 (2009).
[30] E. Jez and D. Lestan, Chemosphere. 151, 2020 (2016). doi:10.1016/j.
chemosphere.2016.02.088.
[31] D. Molden, T. Oweis, P. Stdeuto, P. Bindraban, M.A. Hanjra and J. Kijne, Agric. Water Manage.
97, 528 (2010). doi:10.1016/j.agwat.2009.03.023.
[32] J.R. McCauley and J.L. Bouldin, Bull. Environ. Contam. Toxicol. 96, 757 (2016). doi:10.1007/
s00128-016-1813-8.
[33] N.S. Harris and G.J. Taylor, BMC Plant Biol. 13, 103 (2013). doi:10.1186/1471-2229-13-103.
[34] K. Exall, Water Qual. Res. J. Canada. 39, 13 (2004). doi:10.2166/wqrj.2004.004.
[35] M.B. Masud, T. McAllister, M.R.C. Cordeiro and M. Faramarzi, Sci. Total Environ. 616–618, 208
(2018). doi:10.1016/j.scitotenv.2017.11.004.
[36] M.E.T. Sillanpae, T.A. Kurniawan and W.-H. Lo, Chemosphere. 83, 1443 (2011). doi:10.1016/j.
chemosphere.2011.01.007.
[37] L. Malmauret, D. Parent-Massin, J.-L. Hardy and P. Verger, Food Additives and Contaminants.
19, 524 (2002). doi:10.1080/02652030210123878.
[38] P.G.C. Campbell and J. Gailer, in Metal Sustainability: Global Challenges, Consequences and
Prospects, edited by R. M. Izatt (John Wiley & Sions Ltd., Chichester, United Kingdom, 2016),
p. 221.
[39] G.A. Drasch, Sci. Total Environ. 26, 111 (1983).
[40] D.L. Van Engelen, R.C. Sharpe-Pedler and K.K. Moorhead, Chemosphere. 68, 401 (2007).
doi:10.1016/j.chemosphere.2007.01.015.
[41] H.C.J. Godfray, J.R. Beddington, I.R. Crute, L. Haddad, D. Lawrence, J.F. Muir, J. Pretty,
S. Robinson, S.M. Thomas and C. Toulmin, Science. 327, 812 (2010). doi:10.1126/
science.1185383.
[42] G.R. Aiken, H. Hsu-Kim and J.N. Ryan, Environ. Sci. Technol. 45, 3196 (2011). doi:10.1021/
es103992s.
[43] L. Verheyen, F. Degryse, T. Niewold and E. Smolders, Sci. Total. Environ. 426, 90 (2012).
doi:10.1016/j.scitotenv.2012.03.044.
[44] H. Yan, L. Yang and Q. Wang, Talanta. 84, 287 (2011). doi:10.1016/j.talanta.2011.01.019.
[45] F. Liu, C. Fortin and P.C.G. Campbell, Limnol. Oceanogr. 62, 2604 (2017). doi:10.1002/
lno.10593.
[46] V. Antoniadis, E. Levizou, S.M. Shaheen, Y.S. Ok, A. Sebastian, C. Baum, M.N.V. Prasad, W.
W. Wenzel and J. Rinklebe, Earth Science Rev. 171, 621 (2017). doi:10.1016/j.
earscirev.2017.06.005.
[47] A. Kataria, L. Trasande and H. Trachtman, Nat. Rev. Nephrol 11, 610 (2015). doi:10.1038/
nrneph.2015.94.
[48] A.M. Newbigging, R.E. Paliwoda and X.C. Le, J. Environ. Sci. 30, 129 (2015). doi:10.1016/j.
jes.2015.03.001.
[49] C.Y. Chang, H.Y. Yu, J.J. Chen, F.B. Li, H.H. Zhang and C.P. Liu, Environ. Monit. Assess. 186,
1547 (2014). doi:10.1007/s10661-013-3472-0.
[50] J.M. Custos, C. Moyne, T. Treillon and T. Sterckeman, Plant Soil. 374, 497 (2014). doi:10.1007/
s11104-013-1906-7.
[51] S. Sarpong-Kumankomah, M.A. Gibson and J. Gailer, Coord. Chem. Rev. 374, 376 (2018).
doi:10.1016/j.ccr.2018.07.007.
Keep reading this paper — and 50 million others — with a free Academia account
Used by leading Academics

Cesar Mello
Massachusetts Institute of Technology (MIT)

Tobias Takas Shumba
Harare Polytechnic

Bruno Boulanger
Université de Liège

Rgo Araujo
UFBA - Federal University of Bahia