Journal of Archaeological Science: Reports 43 (2022) 103433
Contents lists available at ScienceDirect
Journal of Archaeological Science: Reports
journal homepage: www.elsevier.com/locate/jasrep
Smartphone application for ancient mortars identification developed by a
multi-analytical approach
Mirco Ramacciotti a, b, Gianni Gallello a, *, Marco Lezzerini c, Stefano Pagnotta c, Andrea Aquino c,
Llorenç Alapont a, Juan Antonio Martín Ruiz d, Alejandro Pérez-Malumbres Landa e,
Ramón Hiraldo Aguilera f, David Godoy Ruiz g, Angel Morales-Rubio b, M. Luisa Cervera b,
Agustín Pastor b
a
Department of Prehistory, Archaeology and Ancient History, University of Valencia, Avenida de Blasco Ibañez 28, 46010 Valencia, Spain
Department of Analytical Chemistry, University of Valencia, Edificio Jeroni Muñoz, Dr. Moliner 50, 46100 Burjassot, Spain
c
Department of Earth Sciences, University of Pisa, via S. Maria 53, 56126 Pisa, Italy
d
Universidad Internacional de Valencia, c/del Pintor Sorolla 21, 46002 Valencia, Spain
e
Department of Culture and Historical Heritage of Andalusian Government, Edificio Eurocom, c/Mauricio Moro Pareto 2, 29006 Málaga, Spain
f
Institute of Studies of Ronda and la Serranía, c/Virgen de la Paz 15, 29400 Ronda, Málaga, Spain
g
Múrex Arqueólogos, S. L. c/Santa Teresa 6, 29651 Mijas, Málaga, Spain
b
A R T I C L E I N F O
A B S T R A C T
Keywords:
Smartphone
REE
pED-XRF
Imaging
CIELAB
Mortars
Islamic period
The present work shows the results of the chemical, mineralogical and colorimetric characterisation of the
ancient mortars from Silla Islamic Tower (Valencia, Spain) and Fuengirola Castle (Malaga, Spain). The samples
were characterised from the mineralogical point of view by X-ray diffractometry and mid-infrared attenuated
total reflection spectroscopy, while portable energy dispersive X-ray fluorescence spectroscopy and inductively
coupled plasma mass spectrometry were employed to obtain the concentrations of major and trace elements,
including rare earth elements. Data analysis through multivariate statistics was used to evaluate features to
discriminate among the mortars from the different construction phases and to classify undated samples. Finally,
colour features of powdered and intact samples were characterised by smartphone photo processing and with a
Vis-spectrophotometer as reference technique to evaluate the effectiveness of smartphones for archaeometric
studies of historic mortars. The analytical results permitted the classification of most undated samples from Silla
and evidenced the presence of peculiar chemical characteristics in some samples from Fuengirola. Imaging data
for powdered samples showed a good potential as a reliable, cheap and non-destructive fast method to characterise mortars and carry out the study of construction phases in historical complexes.
1. Introduction
1
The analysis of architecture and ancient building materials is of
particular interest for different fields of study being a fundamental step
for the archaeological interpretation of architectural heritages construction phases, development of a complex, the employed construction
techniques, the provenance of raw materials and their manufacture, as
well as the implication of all these aspects for social history, and to
program restoration interventions (Ferris, 1989; Francovich and Bianchi, 2002; Brogiolo, 2007; Dessales, 2017; Columbu et al., 2018; Azkarate, 2020).
Several methods have been employed to characterise ancient mortars, including the use of different analytical techniques such as optical
microscopy (OM), thermogravimetry with differential scanning calorimetry (TG-DSC), X-ray diffractometry (XRD), energy dispersive X-ray
fluorescence (ED-XRF) and inductively coupled plasma mass spectrometry (ICP-MS) (Crisci et al., 2004; Lezzerini et al., 2014; 2018). The use
of these archaeometric methods, often carried out during archaeological
works or in the study of a monument, can provide important information
concerning the employed raw materials and the production technology
of mortars (Miriello et al., 2015; Lezzerini et al., 2016; Sitzia et al., 2020;
Cantisani et al., 2021) and can be a support for the interpretation of the
* Corresponding author.
E-mail address: gianni.gallello@uv.es (G. Gallello).
1
This paper is part of the Special Issue “Advances in Archaeometry during COVID-19 pandemic” edited by Celestino Grifa, Donata Magrini e Francesco Izzo.
https://doi.org/10.1016/j.jasrep.2022.103433
Received 20 November 2021; Received in revised form 7 February 2022; Accepted 5 April 2022
Available online 11 April 2022
2352-409X/© 2022 The Authors. Published by Elsevier Ltd. This is an open access article under the CC BY-NC-ND license (http://creativecommons.org/licenses/bync-nd/4.0/).
�M. Ramacciotti et al.
Journal of Archaeological Science: Reports 43 (2022) 103433
wall stratigraphy, recognising similarities and diversities among group
of samples driven by different manufacturing recipes (Corti et al., 2013;
Chiarelli et al., 2015; Lezzerini et al., 2018). Mortars trace elements have
been employed as markers of different construction phases (Miriello
et al., 2010a). For example, in the last few years, Gallello and colleagues
successfully used the rare earth elements (REE) data, processed though
multivariate statistics, as elemental markers of the different construction
phases for the structures of Sagunto Castle and its surroundings (Gallello
et al., 2017; Ramacciotti et al., 2018).
The present study shows the results of the archaeometric characterisation of the ancient mortars from the Islamic Tower of Silla
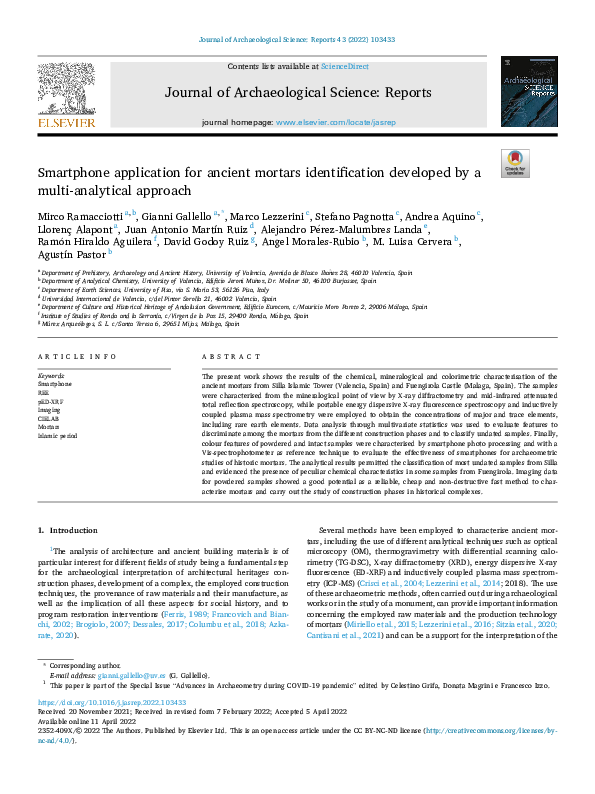
(Valencia, Spain) and the Castle of Fuengirola (Malaga, Spain; Fig. 1) in
order to understand the construction phases of the wall structures,
implementing non-invasive screening approaches such as image analysis
on smartphone photos.
The Islamic Tower of Silla (Fig. 1b) was founded in the 11th century
CE as a defensive building. This was part of the defensive belt of the city
of Valencia and is built on the basis of Roman ashlars. Its function was to
defend the population from possible enemy attacks and served also as a
refuge for the population. Later, it was employed as prison and as a
warehouse. It is mentioned by historical fonts in Wars of the Union
(1347–1348), in War of Castile (1356–1375) and in the episodes of
Germanía of 1521, being abandoned during the 19th century (Alapont
et al., 2016).
About Fungirola Castle (Fig. 1c), such as the Silla Tower, it was built
by the Muslims in the 11th century CE to control an area of the coast. It
was occupied by Christians in 1485 and suffered several reforms in the
16th and 18th centuries, when its towers were demolished and several
canvases were enlarged for the placement of artillery. In the 19th century one of the walls was rebuilt and at the end of that century it became
a police station (Aguilar Cuesta et al., 2019).
Multielement analysis employing a portable ED-XRF (pED-XRF) and
an ICP-MS, and mineralogical characterisation through XRD were carried out for all the samples from the two historical complexes. The
mortars from Fuengirola Castle were also characterised by attenuated
total reflection infrared spectroscopy (ATR-IR). Finally, colour features
of mortars from both the sites were measured by a portable Visspectrophotometer and through image processing of smartphone
photos as a test to evaluate the performance and the possible employment of this last device in ancient mortar archaeometric studies for
construction phases identification. Colour features were characterised in
previous studies by colorimetric devices in order to investigate technological aspect of the production of ancient mortars (e.g.: Miriello et al.,
2010b; Centauro et al., 2017). However, although smartphone as a nondestructive, fast and cheap analytical tool is more and more employed in
various fields of analytical chemistry (e.g.: Cruz-Fernández et al., 2017;
Rezazadeh et al., 2019; Herreros-Chavez, 2021), its use is still underdeveloped in archaeological science (De Luca et al., 2021). In this study,
mortars were analysed and for the first time imaging data from smartphone photos were cross-referenced with other analytical data to evaluate the image analysis effectiveness in distinguishing among samples
from different periods. The test was especially developed for the study of
historical complexes characterised by several building interventions
through the centuries. Indeed, the proposed developed approach could
become useful as a prior screening step before running further invasive
sampling strategies for standard methods.
2. Materials and methods
2.1. The mortars
The samples collected from both the Silla Islamic Tower and Fuengirola Castle are shown in Table 1.
Twenty-one samples come from Silla Islamic Tower. Nine samples
were collected from the rammed earth external northern (N3A-B, N4),
western (O8-10) and southern (S6, SA-B) walls of the tower, pertaining
to different construction phases from the Islamic period to the past
century. Four samples of bedding mortar were collected from an Islamic
structure (P0M1-2), found in the ground floor (P0) of the Tower, and
from the remains of a Roman Villa (P0M3-4). Eight samples were
collected in the interior walls of the tower: four samples come from the
first floor (P1), three from the second (P2) and one from the third (P3).
P1M1-2, P2M1-2 and P3M1 come from the rammed earth structure and
dated back to the Islamic phase of the tower, except for P2M3 which is
possibly a modern restoration. P1QU comes from the ceiling lathwork
structure, which pertains to the Islamic phase as well, while P1EN is a
Fig. 1. Localisation of Fuengirola and Silla towns in the Iberian Peninsula (a), Silla Islamic Tower (b) and 3D reconstruction of Fuengirola Castle (c).
2
�M. Ramacciotti et al.
Journal of Archaeological Science: Reports 43 (2022) 103433
mineralogical qualitative identification was performed by DIFFRAC.
EVA v4.1.1 software (by Bruker).
Table 1
Samples from the two sites, localisation and dating.
Sample
Location*
Dating
Location*
Dating
Islamic
Christian
(?)
20th c.
Second
floor (int.)
P2M2
Second
floor (int.)
P2M3
Second
floor (int.)
P3M1
Third floor
(int.)
Fuengirola Castle
20th c.
M01
Section 3rd
14th c.
M02
Tower 3
13th or 13th15th c. (?)
14th c. (?)
Islamic
M03
Section 2nd
14th c. (?)
(?)
M04
Section 4th
(?)
M05$
Tower 4
Islamic
M06
Section 8th
Beginning of
19th c.
10th or 12th
c. (?)
End of 18th c.
Islamic
M07
Tower 1
12th c.
Roman
M08
Tower 1
16th c.
Roman
M09
(?)
M10
Section
10th
Section 1st
Ending 18th
c. (?)
14th c. (?)
Islamic
M11B
(?)
Islamic
M11W
Islamic
M12
Section 9th
b
Section 9th
b
Section 7th
P2M1
Silla Islamic Tower
N3A
N3B
N4
O8
O9
O10
S6
SA
SB
P0M1
P0M2
$
P0M3
P0M4$
P1EN
P1QU
P1M1
P1M2
Northern
wall (ext.)
Northern
wall (ext.)
Northern
wall (ext.)
Western
wall (ext.)
Western
wall (ext.)
Western
wall (ext.)
Southern
wall (ext.)
Southern
wall (ext.)
Southern
wall (ext.)
Ground
floor (int.)
Ground
floor (int.)
Ground
floor (int.)
Ground
floor (int.)
First floor
(int.)
First floor
(int.)
First floor
(int.)
First floor
(int.)
Sample
Islamic
Islamic
Notes: * ext. = external, int. = interior;
uncertain dating; c.: century.
$
2.3. Attenuated total reflection infrared spectroscopy (ATR-IR)
Islamic
The powdered samples of Fuengirola Castle were analysed with a
portable spectrometer 4300 Handheld FT-IR by Agilent Technologies.
Each spectrum is the average of 50 scans. Background was measured
between an analysis and the others. Resolution of 4 cm−1 and Boxcar
apodization were employed.
Modern
restoration
Islamic
2.4. Multielement analysis
Major elements (Al, Si, K, Ca, Ti and Fe) concentrations were
measured in all the samples with a portable energy dispersive X-ray
fluorescence spectrometer (pED-XRF) S1 Titan by Bruker, equipped with
a Rh X-ray tube (50 kV) and X-Flash® SDD (resolution: 147 eV; FWHM:
5.9 keV). Geochem-trace application was employed for the analysis.
Although its high limits of detection compared with the standard
laboratory spectrometers, pED-XRF is increasingly employed in
archaeometry, also in order to obtain quantitative and semi-quantitative
elemental data of ancient mortars (Donais et al., 2009; Tenconi et al.,
2018). Internal calibration was adjusted using geologic certified reference materials, and the accuracy and precision of the analytical data
were controlled employing NIM-GBW07408 (Soil) and NCS DC 73375
(Limestone) reference materials (Annex 1).
Trace elements (Ba, Bi, Cd, Cr, Co, Cu, Pb, Li, Mn, Mo, Ni, Sr, Th, Tl,
U, V, Zn), including rare earth elements (REE: La, Ce, Pr Nd, Sm, Eu, Gd,
Tb, Dy, Ho, Er, Tm, Yb, Lu, and Sc and Y), concentrations were analysed
by an inductively coupled plasma mass spectrometer (ICP-MS) Elan
DRCII by Perkin Elmer. The powdered samples were previously brought
in solution by acid attack (aqua regia). Details on sample preparation and
equipment setting can be found in Gallello et al., 2017. Accuracy and
precision of the analytical data were controlled employing NIMGBW07408 and NCS DC 73375 reference materials.
14th c. (?)
14th c. (?)
indicates earth mortars; (?) indicates
very thin layer of plaster from an uncertain phase. The macroscopic
features of the Roman samples suggest that they can be classified as
earthen mortars, an ancient technique in which the mortar was the
result of the mixing of soil and water and, in some cases a stabiliser, such
as lime, plant or organic matter (Gómez Morgade et al., 2021) while the
others as lime mortars, characterised by sandy aggregate, whitish-light
gray binder and presence of lumps, except for P1EN in which aggregate was not visible by naked-eye.
Thirteen samples of mortars were collected from different sectors of
the Fuengirola Castle. Samples M01-03, M05, M09-12 come from rammed earth structures. Most of the samples have been attributed to
structures of uncertain dating. Anyway, structures of M07 and M08 are
from phases of the 12th and 16th centuries respectively, while M04 and
M06 from Modern times interventions. Except for M05, which looks
earthy, the other samples are lime mortars. M11 was divided in two
samples due to the different colour of the binder, which is whitish for
M11W and brownish for M11B. Binder fraction is whitish to light grey
for the lime mortars. All the lime samples present a sandy aggregate
fraction with mainly greyish clasts except for M06 which shows mainly
whitish clasts.
2.5. Colour analysis
Colour features were measured in powdered samples from the two
buildings and in intact samples of Fuengirola Castle. The analyses were
carried out employing reflectance spectroscopy in the visible region
(Vis-SP) as reference technique through a portable CM-26d spectrophotometer by Konica Minolta, calibrated with reference white and
black to convert the signal to CIELAB colour space coordinates. In the
CIELAB colour space, L* represents the perceptual lightness, ranging
from 0 (black) to 100 (white), while a* and b* correlate with chroma
perceptions on green–red and blue-yellow axes, respectively (Fairchild,
2013). Powdered samples were put in a small cylindric container and
analysed with a 3 mm measurement spot, while intact samples were
analysed with an 8 mm spot in five different random areas in which both
aggregate and binder fractions were present, and median values were
used. Concerning imaging (see Annex 2 for a flowchart resuming the
procedure), the smartphone photos were made in a controlled environment with a Samsung Galaxy S7 Edge (powdered samples camera
setting: ISO: 100, f: 1/350 s, T: 5500 K, focus: manual, zoom: 3.0 x;
intact samples camera setting: ISO: 80, f: 1/500 s, T: 3700 K, focus:
manual, zoom: 3.0 x). Image were processed with MATLAB (version:
R2019b) by MathWorks and Colorlab toolbox (Malo and Luque, 2002).
Firstly, the photos were cropped in order to process data from mortar
surface only, RGB parameters for each pixel were converted to XYZ
tristimulus values and, finally, to the parameters of the CIELAB colour
space employing the photo of a reference white taken in the same conditions of the other ones. Median L*, a* and b* were employed.
2.2. X-ray diffraction (XRD)
All the analyses were carried out on the whole sample, without the
separation of aggregate and binder fractions. As a first step, each sample
was powdered and homogenised by agate mortar and pestle prior to the
analysis. The analyses were carried out through using a Bruker D2
Phaser X-ray diffraction instrument, Cu Kα radiation λ = 1.5418 Å, range
5-65◦ 2θ with 0.02◦ 2θ per step and accumulation time of 10 s. The
3
�M. Ramacciotti et al.
Journal of Archaeological Science: Reports 43 (2022) 103433
can be observed from major elements composition, since the first ones
show higher levels of Al, Si, K, Ti and Fe and lower ones of Ca than the
lime mortars. These major elements profiles are consistent with mineralogical features evidenced by mineralogical profiles obtained by XRD
which pointed out higher amounts of quartz and aluminosilicates in
earth mortars than in lime ones, and lower amounts of carbonates. Earth
mortar samples are also richer in REE and most trace elements (Bi, Cd,
Co, Cr, Li, Mn, Mo, Ni, Th, Tl, and V) and lower in Sr than lime mortars.
The chemometric exploration of the multielement analysis data
conducted by PCA allowed to highlight similarities and differences
among the lime mortars. The first model (Annex 4) shows the results
obtained on all the considered elements. Earth mortars were excluded
from this analysis since their peculiar features could have hidden the
differences among lime ones in the model. Annex 4a shows the scores of
the two first PC for the samples, while Annex 4b-c shows the variables
loadings. The first two components explain 53.3% and 12.9% of the total
variance respectively. The first PC is positively correlated with most of
the elements and negatively with Ca and some trace elements (Pb, Mo,
Sr and U), while PC2 shows the most intense positive correlations with
Si, Bi, Cd, Cu, Pb, Mn, V and Zn, and negative ones with Ca, Ba, Cr, Co, Li
and Sr. As can be observed in the Annex 4a, mortars from different
chronologies are scattered in the samples/scores plot and clusters
related to the different construction phases cannot be clearly observed.
Most Islamic samples have lower PC1 scores than most mortars from the
following phases. However, P2M3 falls among them. The unclassified
sample of SB fall isolated in the first quadrant. N3B is in the third
quadrant, close to the two samples of the 20th century (O8-9), the unclassified sample of plaster and the 14th century one (O10).
The second model was made employing REE as variables (Fig. 2),
since previous archaeometric studies proved their effectiveness as
chronological markers in mortars (Gallello et al., 2017; Ramacciotti
et al. 2018). The first two PC explain more than 95% of the total variance. The first PC (Fig. 2b) is positively correlated with all the variables,
while PC2 (Fig. 2c) shows a fractionation of REE since lighter REE (from
La to Pr) and heavier REE (from Tm to Lu) have negative coefficients,
while the others (from Nd to Er) have positive ones. Sc and Y have
negative and positive coefficients respectively. Concerning the scores
diagram (Fig. 2a), samples from the centuries 14th (O10) and 20th (O89) have lowest scores for PC1 or higher scores for PC2 than Islamic
samples, which are scattered on the two PC-axes. The sample from the
modern restoration (P2M3), which previously grouped with the Islamic
mortars, falls isolated due to high PC2 scores. The unclassified samples
group clearly with the mortars from the Islamic constructive phases,
except for the plaster one, which shows PC1 scores closer to the 14th and
20th century mortars but negative PC2.
2.6. Exploratory data analysis
Statistics and data visualisation were carried out in R (version 4.0.2;
R Core Team, 2020) employing the following R packages: factoextra
(version: 1.0.7; Kassambara and Mundt, 2020), ggplot2 (version: 3.3.3;
Wickham, 2016), signal (version: 0.7–6; signal developers, 2013),
ggrepel (version: 0.9.1; Slowikovski, 2021), ggpubr (version: 0.4.0;
Kassambara, 2020). Principal component analysis (PCA) was used
separately in Silla Tower samples and in Fuengirola Castle ones to
reduce dimensionality and analyse the main variance tendencies of the
datasets, evaluating the presence of groups. Concerning multielement
analysis data, for both the sites, two models were built: the first with all
the elemental concentrations, the second only with REE as variables.
The concentrations were standardised prior to the analysis. Principal
component analysis was carried out also for ATR-IR data in the region
between 2000 and 700 cm−1. Each spectrum was pre-processed by
Savitzky-Golay filter (polynomial order: 2nd, length: 13, derivative:
2nd) and signals were mean-centred prior to the PCA. Cluster analysis
(CA method: average linkage) employing the first two PC as variables
was also carried out for Fuengirola Castle samples.
3. Results and discussion
3.1. The mortars from Silla Islamic Tower
3.1.1. X-ray diffraction results
The mineralogical analysis (Table 2) conducted on the samples
allowed to highlight the qualitative mineralogy of the mortars under
examination.
In qualitative mineralogy, what immediately stands out is the substantial difference of the mortars of the Roman period (P0M3 and P0M4)
compared to the other subsequent periods. These mortars have a relatively high quartz content compared to calcite. High amounts of quartz
are not unusual in earth mortars aggregate fraction, as observed in
previous studies (Gómez Morgade et al., 2021). The samples P2M1 and
P2M2, from Islamic period presents traces of gypsum. Gypsum-lime
mortars are known for the same period in other places in Spain and
Portugal (Genestar and Pons, 2003; Freire et al, 2008; Vitti, 2021).
However, minor amount of this mineral can probably be better
explained by chemical weathering products (Lanas et al., 2005). The
P1EN sample has also traces of gypsum, but a lower quartz content than
the previous ones. Samples SA and SB are qualitatively similar to each
other. Likewise, the O8, O9 and O10 samples are mineralogically
similar, although O10 is archaeologically attributed to the 14th century.
3.1.2. Multielement analysis
Major elements concentrations are reported in Table 3, while the
trace elements and REE ones are reported in the Annex 3a and Annex 3b,
respectively.
The difference between earth mortars (P0M3-4) and lime mortars
3.1.3. Archaeological evidence
Resuming the obtained results from an archaeological point of view,
it is interesting to observe that the first discrimination is between the
walls from the Roman phase and the one the following periods, being the
Table 2
Results of XRD analyses of Silla Islamic Tower mortars.
Sample
Cal
Dol
Qtz
Kfs
N3A
N3B
N4
S6
SA
SB
O8
O9
O10
P0M1
P0M2
XX
XXX
XX
XXX
XXX
XXX
XXX
XXX
XXX
XX
XXX
tr
XX
XX
XX
XX
XX
XX
tr
tr
tr
XX
XX
X
tr
tr
X
X
X
Pl
Phyll.
Others
tr
tr
tr
tr
tr
tr
tr
tr
tr
tr
tr
tr
tr
tr
tr
tr
tr
tr
Sample
Cal
P0M3
P0M4
P1EN
P1QU
P1M1
P1M2
P2M1
P2M2
P2M3
P3M1
X
X
XXX
XXX
XXX
XXX
XXX
XXX
XXX
XXX
Dol
Qtz
Kfs
Pl
Phyll.
XXX
XXX
X
XX
XX
XX
XX
XX
XX
XX
tr
tr
tr
tr
tr
tr
tr
tr
tr
tr
tr
tr
Others
Gp (tr)
Gp (tr)
Gp (tr)
tr
Note: Semiquantitave estimates are reported from traces (tr), and to small amounts (X) to large amounts (XXX). Cal: calcite, Dol: dolomite, Qtz: quartz, Kfs: K-feldspar,
Pl: plagioclase, Phyll.: phyllosilicates, Gp: gypsum.
4
�M. Ramacciotti et al.
Journal of Archaeological Science: Reports 43 (2022) 103433
Table 3
Major elements concentrations for Silla Tower samples.
Sample
Al
Si
K
Ca
Ti
Fe
Sample
Al
Si
K
Ca
Ti
Fe
N3A
N3B
N4
S6
SA
SB
O8
O9
O10
P0M1
P0M2
0.90
0.82
1.03
0.78
0.98
0.89
0.88
0.38
0.70
1.16
1.29
9.85
5.63
9.78
8.05
9.76
9.55
2.06
3.06
2.82
9.52
10.04
0.09
ND
0.27
0.16
0.41
1.06
ND
ND
ND
0.60
0.62
24.96
32.33
25.24
30.18
25.79
21.28
37.26
30.36
32.40
27.44
26.18
0.06
0.05
0.06
0.06
0.07
0.05
0.02
0.04
0.02
0.10
0.12
0.6
0.53
0.59
0.57
0.65
0.57
0.34
0.5
0.38
0.89
0.92
P0M3
P0M4
P1M1
P1M2
P1EN
P1QU
P2M1
P2M2
P2M3
P3M1
4.03
4.41
1.32
1.57
0.78
1.05
0.86
0.80
0.74
0.57
18.53
19.26
7.36
9.12
2.19
5.88
8.16
8.48
8.61
7.21
2.23
2.59
0.35
0.70
ND
0.14
0.20
0.49
0.07
0.07
8.82
8.00
27.58
25.11
34.76
29.39
29.05
25.54
23.87
28.67
0.32
0.33
0.08
0.12
0.02
0.06
0.05
0.07
0.05
0.05
2.22
2.27
0.61
0.93
0.23
0.5
0.48
0.63
0.47
0.47
Note: Concentrations are expressed as mass percentage. ND: not detected.
Fig. 2. Samples/scores plot (a) and variables/loadings plots of PC1 (b) and PC2 (c) for the lime mortars of Silla Islamic Tower employing REE as variables.
former made with earth mortars. The use of this technology was
observed also in the structures from the Roman Republican phase of
Sagunto Castle (Gallello et al., 2017) and it is possibly a recurring
technique in the area during this period, although more studies are
needed in order to confirm this hypothesis. The mortars from the 14th
(O10) and the 20th (O8-9) centuries structures cannot be discriminated
through multivariate statistics, but their elemental concentrations and
especially REE ones are quite different from those of samples from the
previous periods. Concerning the unclassified samples, the plaster
sample (P1EN) does not show clear relationship with the others, maybe
because it is a completely different type of mortar, while N4, SA and SB
have REE levels similar to the Islamic mortars. The results for N4 seem in
contradiction with the archaeological hypothesis, which suggested a
more recent dating (Christian period), however, it could also be
explained by a continuity in raw material use and mortar manufacturing
recipe also in a part of the period following the Islamic occupation.
Table 4
Results of XRD analyses of Fuengirola Castle mortars.
Sample
Cal
M01
M02
M03
M04
M05
M06
M07
M08
M09
M10
M11B
M11W
M12
X
X
X
X
X
X
XXX
XX
X
XX
XX
XX
XX
Dol
X
X
XXX
X
X
Qtz
Kfs
XXX
XXX
XXX
XX
XXX
tr
XX
XXX
XXX
XXX
XXX
XXX
XX
tr
tr
tr
X
tr
tr
tr
tr
tr
Pl
X
tr
X
tr
tr
tr
Phyll.
tr
tr
tr
X
X
tr
tr
tr
XX
tr
X
Others
Arg (X)
Arg (tr), Hl (tr)
Note: Semiquantitave estimates are reported from traces (tr), and to small
amounts (X) to large amounts (XXX). Cal: calcite, Dol: dolomite, Qtz: quartz, Ffs:
K-feldspar, Pl: plagioclase, Phyll.: phyllosilicates, Arg: aragonite, Hl: Halite.
3.2. The mortars from Fuengirola Castle
3.2.1. X-ray diffraction results
From the point of view of the mineralogical composition (Table 4),
the presence of traces of halite in the M11W sample is highlighted,
5
�M. Ramacciotti et al.
Journal of Archaeological Science: Reports 43 (2022) 103433
probably due to the interaction with the marine environment. The
samples M01 and M02 seem to be quite similar. The presence of
aragonite in the samples M04 and M11W could be due to the presence of
crushed shells in the composition of the mortar. Sample M09 is characterized by the marked presence of phyllosilicates.
(Fuentes et al., 2006; Olivares et al., 2009; Shillito et al., 2009). The
wide band at ~ 3400 cm−1 and the one of ~ 1635 cm−1 in some samples
suggest the presence of water (Silva et al., 2005), maybe linked to
phyllosilicates or other hydrated phases. Some samples seem to be
earthy (M02, M11B) and M05 is an earth mortar.
The PCA was carried out to determine the main characteristics
concerning the variance of the dataset and to evaluate the presence of
groups. Cluster analysis was also employed to validate the interpretation. The results of the data analysis can be observed in Fig. 4. The first
two PC explain 75.2% and 13.7% of the overall variance respectively.
The variables that have the highest influence for PC1 are signals close to
1400, 875 and 715 cm−1 (Fig. 4b). These wavenumbers correspond to
bands of carbonates and their intensities in the original spectra are
positively correlated to the first PC. It can be observed in the scores plot
(Fig. 4a), corroborated by the dendrogram, that M07 (12th c.) and M12
can be distinguished due to the higher scores of PC1. It is worth noting
that although the earth mortar M05 does not differ significantly from the
other samples according to the dendrogram, it is characterised by the
3.2.2. Infrared spectroscopy
The ATR-IR spectra are shown in Fig. 3. As can be observed, the main
bands of the spectra correspond to the vibrational modes of carbonates
between 1420 and 1405 cm−1, between 725 and 715 cm−1, and at ~
875 cm−1 (Clark et al., 1990; Silva et al., 2005; Bruckman and Wriessnig,
2013). Less intense band probably linked to carbonates can be observed
in all the samples except for the one of earth mortar (M05) at ~ 1800
cm−1 (Silva et al., 2005). Another relevant feature can be seen at ~ 990
cm−1 in all the mortar samples, except for M06, and it is probably caused
by the presence of aluminosilicates (Shillito et al., 2009). Bands at ~
1160 and ~ 1085 cm−1, as well as those of about 795 and 780 cm−1
could mark the presence of aluminosilicates as well or silicon dioxide
Fig. 3. Spectra of ATR-IR of the Fuengirola Castle mortars (spectra are offset to avoid excessive overlapping).
6
�M. Ramacciotti et al.
Journal of Archaeological Science: Reports 43 (2022) 103433
Fig. 4. Samples/scores plot for ATR-IR analysis with dendrogram (a) and variables/loadings plots for PC1 (b) and PC2 (c).
lowest PC1 scores.
Carbonate bands have a relevant influence also on PC2 (Fig. 4c).
Indeed, the loading peaks close to 1420, 1395, 885 and 730 cm−1 are
probably ascribable to this class of minerals. In particular, the intensity
of the bands at about 1420, 885 and 730 cm−1 in the original spectra are
linked to higher scores on the PC2, while the intensity at about1395
cm−1 is linked to lower values of the same PC. The feature at ~ 1340
cm−1, observable as a shoulder of ~ 1400 cm−1 band in M11W and
M11B, and the one at ~ 850 cm−1, shoulder of the ~ 875 cm−1 band, are
possibly caused by the presence of organic matter (Legan et al., 2020)
and aragonite (Pronti et al., 2020), respectively. On this direction, a
band related to the aluminosilicates has a certain influence, as indicated
by loadings around 1000 cm−1. In this case, higher intensity corresponds
to lower score. Sample M06 (18th c.) is characterised by the highest PC2
score. Its peculiarity, compared to the other samples is evidenced also by
the dendrogram. Looking at the spectrum (Fig. 3), it can be observed
that its carbonate band close to 1400 cm−1 peaks at ~ 1420 cm−1 and,
furthermore, it has an intense band at ~ 730 cm−1, which hides the
calcite one at ~ 715 cm−1. These two features suggest a relevant amount
of dolomite (Bruckman and Wriessnig, 2013). This characteristic was
pointed out also by XRD analysis which revealed large amount of
dolomite in M06, while the other samples were characterised by a small
to moderate presence of this carbonate mineral in the other sample.
Sample score is also coherent with the absence of aluminosilicate band
at ~ 990 cm−1. These facts indicate that for the production of this
sample (M06) the employed raw materials were considerably different
from those of the other lime mortars.
Table 5
Major elements concentrations for Fuengirola Castle samples.
Sample
Al
Si
K
Ca
Ti
Fe
M01
M02
M03
M04
M05
M06
M07
M08
M09
M10
M11B
M11W
M12
0.98
1.19
ND
1.41
3.35
ND
ND
0.42
2.81
0.41
1.86
0.60
0.28
18.63
11.92
13.70
12.95
16.46
0.45
4.72
14.09
15.01
7.85
10.37
5.44
8.02
0.26
0.60
0.16
0.60
2.07
ND
ND
0.10
1.25
0.05
1.63
1.14
ND
15.08
15.47
15.06
14.58
5.90
24.27
22.11
12.83
9.85
19.26
9.38
14.65
20.49
0.11
0.10
0.06
0.18
0.35
0.01
0.03
0.08
0.27
0.06
0.23
0.12
0.04
1.93
1.64
1.31
3.19
4.23
0.20
0.67
1.48
3.35
1.18
2.97
2.07
0.75
Note: Concentrations are expressed as mass percentage. ND = not detected.
3.2.3. Multielement analysis
Results for pED-XRF analysis can be observed in the Table 5, while
results from ICP-MS in the Annex 5a (trace elements) and Annex 5b
(REE).
From the point of view of major elements, some peculiarities can be
observed: Al and K could not be detected by the spectrometer in the
sample M06, which show the lowest levels of Si, Ti and Fe, while it has
the highest level of Ca. As previously stated, this sample is characterised
by a different aggregate also from the macroscopic point of view and has
high amounts of carbonate minerals and low ones of quartz and aluminosilicates compared to the other mortars, as indicated by ATR-IR and
7
�M. Ramacciotti et al.
Journal of Archaeological Science: Reports 43 (2022) 103433
XRD analyses. Therefore, it could be the main cause of this difference.
Among the other samples, M05, M09 and M11B have the lowest levels of
Ca and the highest of Al. In the case of M05, the high amount of Al is
combined with the highest level of Si, which can be explained by the
presence of earth.
In order to explore the dataset reducing the variable number, PCA
was employed. A first PCA (Annex 6) was carried out with all the analysed elements as variables and CA with PC1 and PC2 was also carried
out to guide scores plot interpretation. The first two PC explain 80.6% of
the overall variance. The first PC loadings (Annex 6b) is influenced in
the positive direction by elements probably linked to aluminosilicates
(Al, Si, K, Ti, Fe, REE and most trace elements), while Ca and few trace
elements (Mo, Sr and U) are correlated in the negative direction with
this PC. As regards PC2 (Annex 6c), loadings show intense negative
correlations with Si, Fe, Cd, Cr, Co, Ni and Sr, and positive ones with K,
Pb, Mo, Tl, V y U. Scores diagram (Annex 6a) and CA dendrogram show
that the most important separation is the one between earth (M05) and
lime mortars. The lime mortars can be divided in other sub-groups. M09
and M11B, rich in aluminosilicates elements, cluster together and are
half-way between earth and lime mortars. M04 (19th c.) is closer to
them but shows completely different PC2 scores. M07 (12th c.) and M12,
and further, M06 (18th c.) and M03 pertain to another sub-cluster; while
in the other there are M01, M08 (16th c.), M02, and M10 and M11W. It
is worth noticing that ATR-IR PCA evidenced a compatibility between
M07 and M12 as well, due to their high content of carbonates. A second
PCA with CA was made employing only REE as variables (Fig. 5).
The first two PC explain more than 99% of the overall variance. The
first PC is linked to the total amount of REE and all the variables show
negative coefficients (Fig. 5b). The second PC (Fig. 5c) shows two kinds
of REE fractionation. Indeed, loadings seem to be positively correlated to
elemental mass, and Eu has opposite coefficient compared to its neighbouring elements (Sm and Gd). Scores diagram (Fig. 5a), corroborated
by PC1-2 dendrogram, evidences the distance between earth mortar
(M05), rich in REE, and lime mortars. M09, M11B and M04 are also in
this case midway between the two groups on PC1, although closer to
lime mortars. M06 (18th c.) has very low levels of REE and the highest
PC1 score. The other samples group in two subclusters (1st: M01, M12,
M03, M07 (12th c.); 2nd: M02, M08 (16th c.), M10, M11W).
3.2.4. Preliminary considerations
Due to the reduced sample size, the obtained results permitted only
preliminary considerations. The analytical results and data processing
evidenced the presence of three types of mortars, according to their
chemical features: sample M05, an earth mortar, sample M06 (18th c.),
characterised by a different aggregate and a relevant amount of dolomite, and M04 (19th c.), which showed characteristic elemental levels
evidenced by the PCA employing all the elements (Annex 6). Features of
M09 and M11B are probably related to the presence of earth, although
the cause is not clear (contamination or voluntary addition?). The difference among the other samples is less evident but data analysis suggests a possible similarity of M07 (12th c.) and M12.
3.3. Colour characterisation
As previously stated, colour characterisation was carried out
employing imaging of smartphone pictures and Vis-SP analysis as
reference method (results are shown in the Annex 7). Powdered samples
were analysed from both the architectural complexes, while only in
Fig. 5. Samples/scores plot and CA dendrogram (a), and loadings for PC1 (b) and PC2 (c) for the PCA employing REE as variables.
8
�M. Ramacciotti et al.
Journal of Archaeological Science: Reports 43 (2022) 103433
Fuengirola Castle samples the two techniques were employed on intact
fragments.
Concerning powdered samples, it can be observed that imaging results are a good predictor of colour properties analysed by the reference
method (Annex 8), although L* values are higher for imaging than for
Vis-SP, while chromatic parameters (a* and b*) are instead lower.
Indeed, the coefficient of determination (R2) ranges between 0.88 (a*)
and 0.96 (L*). Pearson correlation coefficient (r) were calculated to
investigate the possible relationship between imaging detected colour of
powdered samples and elemental properties in lime mortars (Table 6).
Earth mortars (P0M3-4 from Silla and M05 from Fuengirola) were
excluded to avoid misleading results. In general, it is possible to observe
that L* is negatively correlated with Al, Si, K, Ti and Fe, and positively
with Ca. On the other hand, a* and b* are positively correlated with Al,
Si, K, Ti and Fe and negatively with Ca. It suggests that mortars L* is
mainly driven by the amount of carbonate minerals, while coordinates
on chromatic axes (a* and b*) by the other mineralogical phases such as
aluminosilicates.
Fig. 6 shows the scatter plots for L* vs a* (top) and L* vs b* (bottom)
imaging data for Silla Islamic Tower powdered samples. Roman earth
mortar samples (P0M3-4) were excluded to improve image clarity,
anyway, they are visibly different from lime mortars due to higher a*
and b* values, and for lower L*, due to the very different composition
(Annex 7a). From the point of view of L* axis, Islamic samples have
lower L* than the others from the following construction phases,
although the distributions overlap. However, they can be differentiated
from the one of the 18th century on the a* axis and from those of 14th
and 20th centuries on b* axis. It is also worth noticing that samples from
the ground and the first floors (P0M1-2, P1M1-2) show slightly higher a*
values than the others. At this point, the analytical results do not give
any hint on the possible causes of this difference. As regards the unclassified mortars, most of them are plotted within the Islamic samples
suggesting this possible classification, which is consistent with multielement analysis data. P1EN1 shows instead colour properties different
from the other samples which is consistent with elemental and mineralogical data pointing out higher amounts of carbonates.
Concerning Fuengirola Castle powdered samples (Fig. 7), the earth
mortar (M05) and the brownish stratum of M11 (M11B) are plotted
isolated in the diagram due to the low L* and the high chromaticity
compared to the other samples. M06, M07 and M12 have the highest L*.
These samples are characterised by low levels of Al and Si, and high ones
of Ca, while XRD and ATR-IR pointed out high amounts of carbonate
minerals. It is worth noticing that mineralogical analyses pointed out a
very high amount of dolomite for M06, which have higher L*/a* ratio
than the other samples.
A small test was also carried out employing the photos from the
intact samples of Fuengirola Castle. However, we can observe that VisSP and imaging data show strong linear relationship only for L* (R2 =
0.87; Annex 9a). CIELAB diagrams (Annex 9b) evidence separation between M05 and M11B and the other mortars, although, on the contrary
Fig. 6. Biplots for L* vs a* (top) and L vs b* (bottom) employing imaging data
of Silla Islamic Tower powdered samples.
Fig. 7. Biplots for L* vs a* (top) and L* vs b* (bottom) employing imaging data
of Fuengirola Castle powdered samples.
of powdered samples, in this case M11W is plotted closer to these and
not to the other lime mortars. Intact M07 has the highest L* and the
lowest b*, as for powdered sample, while M06 is plotted within the other
lime mortars. The issues in obtaining colour values consistent with those
of the reference technique in intact mortars is probably related to the
difficulty in characterising samples with irregular and heterogeneous
surface. Further studies are needed with a large sample size to improve
the smartphone method as a viable non-invasive method to characterise
ancient mortars colour features.
Table 6
Pearson correlations (r) between colour parameters (imaging) and major elements in lime mortars from the two architectural complexes.
Mortars
Silla (n = 19)
Fuengirola (n =
12)
All (n = 31)
L*
a*
b*
L*
a*
b*
L*
a*
b*
Al
Si
K
Ca
Ti
Fe
−0.54
0.78
0.68
−0.79
0.58
0.68
−0.68
0.61
0.64
−0.69
0.53
0.75
−0.32
0.08
0.10
−0.47
0.21
0.20
−0.74
0.71
0.68
−0.93
0.81
0.90
−0.87
0.77
0.69
0.57
−0.40
−0.58
0.80
−0.59
−0.65
0.65
−0.32
−0.10
−0.73
0.86
0.92
−0.87
0.67
0.76
−0.87
0.67
0.57
−0.81
0.89
0.91
−0.82
0.58
0.70
−0.81
0.47
0.27
4. Conclusion
Different analytical techniques were employed to characterise the
samples from Silla Islamic Tower and Fuengirola Castle.
The results of multielement analysis suggested that most of the
Note: ND for Al and K were changed with half of the lowest detected concentration. Barred coefficients are statistically not significant (p >.05).
9
�M. Ramacciotti et al.
Journal of Archaeological Science: Reports 43 (2022) 103433
unclassified samples from Silla Tower date back to the Islamic construction phase, while some characteristic mortars could be observed
among Fuengirola Castle from the phases of 12th century and from the
restorations of the past two centuries. However, to confirm the construction period of undated structures, a wider number of samples
should be studied and additional standardised techniques should be
used.
As regards the use of imaging on smartphone photos as an innovative
archaeometric screening method for ancient mortars, it is possible to
observe that data obtained from powdered samples showed strong linear
relationship with those of the employed reference technique (Vis-SP). In
lime mortars, L* has positive correlation with Ca, and negative with the
other major elements, while both a* and b* have correlations opposite to
L*. This suggests that lightness increases together with the amount of
carbonate minerals, and a* and b* together with other minerals. This
fact is also corroborated by XRD and ATR-IR analyses which pointed out
higher levels of carbonates in the samples characterised by the higher
L*. The variance of these parameters in the samples could be linked to
differences in mortar recipes or raw materials, as well as to different
degradation levels. Furthermore, it is worth noticing that the classification of Silla undated mortars obtained by colour parameters is
consistent with that of multielement analysis. On the other hand, about
the Fuengirola Castle sample set, the most relevant difference is among
earthy samples and lime mortars, although also dolomite-rich sample
(M06) seems to have slightly different colour features which were not
evident by naked-eye examination of powdered samples.
This preliminary smartphone test shows the potential that colour
characterisation by imaging have, being a cheap and fast method to
carry out chronological classification of ancient mortars, at least for
powdered samples, which could be a first screening step in order to carry
out more invasive approaches. However, more studies should be carried
out in order to optimise the methodological approach and corroborate
the results of this first study. Concerning intact samples, the test on the
mortars of Fuengirola Castle gave more challenging methodological issues. However, L* shows good agreement with Vis-SP values, suggesting
that further studies are needed in order to improve non-invasive image
analysis of mortars.
To go deeper and understand if issues such as mortar recipes, raw
materials (binder/aggregate ratios, higher amounts of aluminosilicates
and oxides in the aggregate fraction, limestone impurities or pozzolanic
materials addition), or contamination and weathering are highlighting
smartphone colour differences, further studies, employing standard
methods such as petrographic analysis, should be carried out investigating the relationship between the colour features and the properties of
mortar binder and aggregate fractions.
This archaeometric study further improves the archaeological
knowledge on the studied monuments, highlighting the diachronic
features of the construction phases related to different mortar
manufacturing aspects, pointing out the possibilities of a multianalytical approach based on portable and innovative methodologies
together with widely used analytical techniques.
the project “Smartphone and Green Analytical Chemistry” (PROMETEO
2019-056) funding and the related predoctoral scholarship.
Appendix A. Supplementary data
Supplementary data to this article can be found online at https://doi.
org/10.1016/j.jasrep.2022.103433.
References
Alapont, L.l., Pitarch, A., Orengo, H.A., 2016. Arqueologia de l’Horta Sud: L’origen d’una
comarca histórica. Perifèric Edicions, Catarroja.
Aguilar Cuesta, Á.I., Vallina Rodríguez, A., García Juan, L., 2019. Fuengirola a través del
Catastro de Ensenada. In: Martín Ruiz, J.A. (Ed.), De Suel a Fuengirola: Actas I
Jornadas de Arqueología y Patrimonio. La Serranía, Fuengirola, pp. 151–187.
Azkarate, A., 2020. Archaeology of architecture: buildings archaeology. In: Orser, C.E.,
Zarankin, A., Funari, P.P.A., Lawrence, S., Symonds, J. (Eds.), The Routledge
Handbook of Global Historical Archaeology. Routledge, New York, pp. 517–536.
Brogiolo, G.P., 2007. Dall’Archeologia dell’architettura all’Archeologia della
complessità. Pyrenae 38, 7–38.
Bruckman, V.J., Wriessnig, K., 2013. Improved soil carbonate determination by FT-IR
and X-ray analysis. Environ. Chem. Lett. 11, 65–70. https://doi.org/10.1007/
s10311-012-0380-4.
Cantisani, E., Calandra, S., Barone, S., Caciagli, S., Fedi, M., Garzonio, C.A., Liccioli, L.,
Salvadori, B., Salvatici, T., Vettori, S., 2021. The mortars of Giotto’s Bell Tower
(Florence, Italy): raw materials and technologies. Constr. Build. Mater. 267, 120801
https://doi.org/10.1016/j.conbuildmat.2020.120801.
Centauro, I., Cantisani, E., Grandin, C., Salvini, A., Vettori, S., 2017. The influence of
natural organic materials on the properties of traditional lime-based mortars. Intern.
J. Archit. Herit. 11, 670–684. https://doi.org/10.1080/15583058.2017.1287978.
Chiarelli, N., Miriello, D., Bianchi, G., Fichera, G., Giamello, M., Turbanti Memmi, I.,
2015. Characterisation of ancient mortars from the S. Niccolò archaeological
complex in Montieri (Tuscany – Italy). Constr. Build. Mater. 96, 442–460. https://
doi.org/10.1016/j.conbuildmat.2015.08.023.
Clark, R.N., King, T.V., Klejwa, M., Swayze, G.A., Vergo, N., 1990. High spectral
resolution reflectance spectroscopy of minerals. J. Geophys. Res.: Solid. Earth 95,
12653–12680. https://doi.org/10.1029/JB095iB08p12653.
Columbu, S., Antonelli, F., Sitzia, F., 2018. Origin of Roman worked stones from St.
Saturno Christian Basilica (South Sardinia, Italy). Mediterr. Archaeol. Ar. 18, 17–36.
https://doi.org/10.5281/zenodo.1256047.
Crisci, G.M., Franzini, M., Lezzerini, M., Mannoni, T., Riccardi, M.P., 2004. Ancient
mortars and their binder. Period. Miner. 73, 259–268.
Cruz-Fernández, M., Luque-Cobija, M.J., Cervera, M.L., Morales-Rubio, A., de la
Guardia, M., 2017. Smartphone determination of fat in cured meat products.
Microchem. J. 132, 8–14. https://doi.org/10.1016/j.microc.2016.12.020.
De Luca, R., Barca, D., Bloise, A., Cappa, M., De Angelis, D., Fedele, G., Mariottini, S.,
Micieli, D., Muto, F., Piluso, E., Pucino, F., Taranto, M., Tropea, M., Miriello, D.,
2021. RecoStones: a New Tool to Identify Calabrian Stone Materials Through Image
Processing. Geoheritage 13, 41. https://doi.org/10.1007/s12371-021-00564-w.
Dessales, H., 2017. The archaeology of construction: a new approach to Roman
architecture. Ann. Hist., Sci. Soc. – English Edition 72 (1), 69–86. https://doi.org/
10.1017/ahsse.2019.6.
Donais, M.K., Duncan, B., George, D., Bizzarri, C., 2009. Comparisons of ancient mortars
and hydraulic cements through in situ analyses by portable X-ray fluorescence
spectrometry. X-Ray Spectrom. 39, 146–153. https://doi.org/10.1002/xrs.123.
Fairchild, M.D., 2005. Color appearance models, second ed. John Wiley & Sons Ltd.,
Chirchester.
Ferris, I.M., 1989. The Archaeological Investigation of Standing Buildings. Vernac.
Archit. 20, 12–17. https://doi.org/10.1179/vea.1989.20.1.12.
Francovich, R., Bianchi, G., 2002. L’archeologia dell’elevato come archeologia. Arqueol.
Arquit. 1, 101–111.
Freire, T., Santos Silva, A., Veiga, M.R., Brito, J.D. (2008). Characterization of
Portuguese historical gypsum mortars, in: Laboratório Nacional de Engenharia Civil
(Portugal) (Ed.), Characterization, diagnosis, conservation, repair, compatibility:
HMC08, 1st Historical Mortars Conference. LNEC, Lisbon, pp. 1–16.
Fuentes, A.F., Rodríguez-Reyna, E., Martínez-González, L.G., Maczka, M., Hanuza, J.,
Amador, U., 2006. Room-temperature synthesis of apatite-type lanthanum silicates
by mechanically milling constituent oxides. Solid State Ion. 177, 1869–1873.
https://doi.org/10.1016/j.ssi.2006.02.032.
Gallello, G., Ramacciotti, M., Lezzerini, M., Hernandez, E., Calvo, M., Morales, A.,
Pastor, A., de la Guardia, M., 2017. Indirect chronology method employing rare
earth elements to identify Sagunto Castle mortar construction periods. Microchem. J.
132, 251–261. https://doi.org/10.1016/j.microc.2017.02.009.
Genestar, C., Pons, C., 2003. Ancient covering plaster mortars from several convents and
Islamic and Gothic palaces in Palma de Mallorca (Spain). Analytical
characterisation. J. Cult. Herit. 4 (4), 291–298. https://doi.org/10.1016/j.
culher.2003.02.001.
Gómez Morgade, T., Rivas Brea, T., Carrera-Ramírez, F., Barbi Alonso, V., 2021. Earth
mortars in the “Castro de Santa Trega” (A Guarda, Pontevedra, Spain). J. Arch. Sci.
Rep. 37, 102931 https://doi.org/10.1016/j.jasrep.2021.102931.
Herreros-Chavez, L., 2021. Estrategias verdes para el análisis de muestras alimentarias y
medioambientales. University of Valencia. PhD thesis.
Declaration of Competing Interest
The authors declare that they have no known competing financial
interests or personal relationships that could have appeared to influence
the work reported in this paper.
Acknowledgements
Gianni Gallello acknowledges the financial support of the Beatriz
Galindo Fellowship (2018) funded by the Spanish Ministry of Science
and Innovation and Ministry of Universities (Project BEAGAL18/00110
“Development of analytical methods applied to archaeology”). M. Luisa
Cervera, Agustín Pastor and Mirco Ramacciotti acknowledge the Ministry of Education, Culture and Sport of the Valencian Government for
10
�M. Ramacciotti et al.
Journal of Archaeological Science: Reports 43 (2022) 103433
Kassambara, A., 2020. ggpubr: ’ggplot2’ Based Publication Ready Plots. R Package
Version 0.4.0. https://CRAN.R-project.org/package=ggpubr.
Kassambara, A., Mundt, F., 2020. factoextra: Extract and Visualize the Results of
Multivariate Data Analyses. R package version 1.0.7. https://CRAN.R-project.org
/package=factoextra.
Klowikowski, K., 2021. ggrepel: Automatically Position Non-Overlapping Text Labels
with ’ggplot2’. R package version 0.9.1. https://CRAN.R-project.org/package=ggre
pel.
Lanas, J., Sirera, R., Alvarez, J.I., 2005. Compositional changes in lime-based mortars
exposed to different environments. Thermochim. Acta 429(2), 219–226. DOI:
10.1016/j.tca.2005.03.015Legan, L., Leskovar, T., Črešnar, M., Cavalli, F., Innocenti,
D., Ropret, P., 2020. Non-invasive reflection FTIR characterization of archaeological
burnt bones: reference database and case studies. J. Cult. Herit. 41, 13–26. https://
doi.org/10.1016/j.culher.2019.07.006.
Lezzerini, M., Legnaioli, S., Lorenzetti, G., Palleschi, V., Tamponi, M., 2014.
Characterization of historical mortars from the bell tower of St. Nicholas church
(Pisa, Italy). Constr. Build. Mater. 69, 203–212. https://doi.org/10.1016/j.
conbuildmat.2014.07.051.
Lezzerini, M., Ramacciotti, M., Cantini, F., Fatighenti, B., Antonelli, F., Pecchioni, E.,
Fratini, F., Cantisani, E., Giamello, M., 2016. Archaeometric study of natural
hydraulic mortars: the case of the Late Roman Villa dell’Oratorio (Florence, Italy).
Archaeol. Anthr. Sci. 9, 603–615. https://doi.org/10.1007/s12520-016-0404-2.
Lezzerini, M., Raneri, S., Pagnotta, S., Columbu, S., Gallello, G., 2018. Archaeometric
study of mortars from the Pisa’s Cathedral Square (Italy). Meas. 126, 322–331.
https://doi.org/10.1016/j.measurement.2018.05.057.
Malo, J., Luque, M.J. (2002). COLORLAB: a color processing toolbox for Matlab. https
://www.uv.es/vista/vistavalencia/software/colorlab.html.
Miriello, D., Barca, D., Bloise, A., Ciarallo, A., Crisci, G.M., De Rose, T., Gattuso, C.,
Gazineo, F., La Russa, M.F., 2010a. Characterisation of archaeological mortars from
Pompeii (Campania, Italy) and identification of construction phases by
compositional data analysis. J. Archaeol. Sci. 37 (9), 2207–2223. https://doi.org/
10.1016/j.jas.2010.03.019.
Miriello, D., Bloise, A., Crisci, G.M., Barrese, E., Apollaro, C., 2010b. Effects of milling: a
possible factor influencing the durability of historical mortars. Archaeom. 52,
668–679. https://doi.org/10.1111/j.1475-4754.2009.00494.x.
Miriello, D., Barca, D., Pecci, A., De Luca, R., Crisci, G.M., López Luján, L., Barba, L.,
2015. Plasters from Different Buildings of the Sacred Precinct of Tenochtitlan
(Mexico City): Characterization And Provenance. Archaeom. 57, 100–127. https://
doi.org/10.1111/arcm.12074.
Olivares, M., Tarriño, A., Murelaga, X., Baceta, J.I., Castro, K., Etxebarria, N., 2009. Nondestructive spectrometry methods to study the distribution of archaeological and
geological chert samples. Spectrochim. Acta Part A: Mol. Biomol. Spectrosc. 73,
492–497. https://doi.org/10.1016/j.saa.2008.12.036.
Pronti, L., Romani, M., Viviani, G., Stani, C., Gioia, P., Cestelli-Guidi, M., 2020. Advanced
methods for the analysis of Roman wall paintings: elemental and molecular
detection by means of synchrotron FT-IR and SEM micro-imaging spectroscopy.
Rend. Lincei. Sci. Fis. Nat. 31, 485–493. https://doi.org/10.1007/s12210-02000888-9.
R Core Team, 2020. R: A language and environment for statistical computing. R
Foundation for Statistical Computing, Vienna, Austria https://www.R-project.org/.
Ramacciotti, M., Rubio, S., Gallello, G., Lezzerini, M., Columbu, S., Hernandez, E.,
Morales-Rubio, A., Pastor, A., de la Guardia, M., 2018. Chronological Classification
of Ancient Mortars Employing Spectroscopy and Spectrometry Techniques: Sagunto
(Valencia, Spain). J. Spectrosc. 2018, 9736547. https://doi.org/10.1155/2018/
9736547.
Rezazadeh, M., Seidi, S., Lid, M., Pedersen-Bjegaard, S., Yamini, Y., 2019. The modern
role of smartphones in analytical chemistry. TrAC-Trend. Anal. Chem. 118, 548–555.
https://doi.org/10.1016/j.trac.2019.06.019.
Shillito, L.M., Almond, M.J., Wicks, K., Marshall, L.J.R., Matthews, W., 2009. The use of
FT-IR as a screening technique for organic residue analysis of archaeological
samples. Spectrochim. Acta Part A: Mol. Biomol. Spectrosc. 72, 120–125. https://
doi.org/10.1016/j.saa.2008.08.016.
Signal developers (2013). signal: Signal processing. http://r-forge.r-project.org/projects/
signal/.
Silva, D.A., Wenk, H.R., Monteiro, P.J.M., 2005. Comparative investigation of mortars
from Roman Colosseum and cistern. Thermochim. Acta 438, 35–40. https://doi.org/
10.1016/j.tca.2005.03.003.
Sitzia, F., Beltrame, M., Columbu, S., Lisci, C., Miguel, C., Mirão, J., 2020. Ancient
restoration and production technologies of Roman mortars from monuments placed
in hydrogeological risk areas: A case study. Archaeol. Anthrop. Sci. 12, 147. https://
doi.org/10.1007/s12520-020-01080-8.
Tenconi, M., Karatasios, I., Balaawi, F., Kilikoglou, V., 2018. J. Cult. Herit. 33, 100–116.
https://doi.org/10.1016/j.culher.2018.03.005.
Vitti, P., 2021. Mortars and masonry—structural lime and gypsum mortars in antiquity
and Middle Ages. Archaeol. Anthr. Sci. 13, 1–19. https://doi.org/10.1007/s12520021-01408-y.
Wickham, H., 2016. ggplot2: Elegant Graphics for Data Analysis. Springer-Verlag, New
York. https://doi.org/10.1007/978-3-319-24277-4.
11
�
 Alejandro Pérez-Malumbres Landa
 Juan Antonio Martín Ruiz
 Stefano Pagnotta