MethodsX 3 (2016) 102–109
Contents lists available at ScienceDirect
MethodsX
jou rnal homep age : www.elsevier.com/locate/me x
Determination of Sb(III) and Sb(V) by
HPLC—Online isotopic dilution—ICP MS
Maria Chiara Fontanella *, Gian Maria Beone, Ilenia Cattani
Università Cattolica del Sacro Cuore, Istituto di Chimica Agraria e Ambientale, Via E. Parmense 84, 29100
Piacenza, Italy
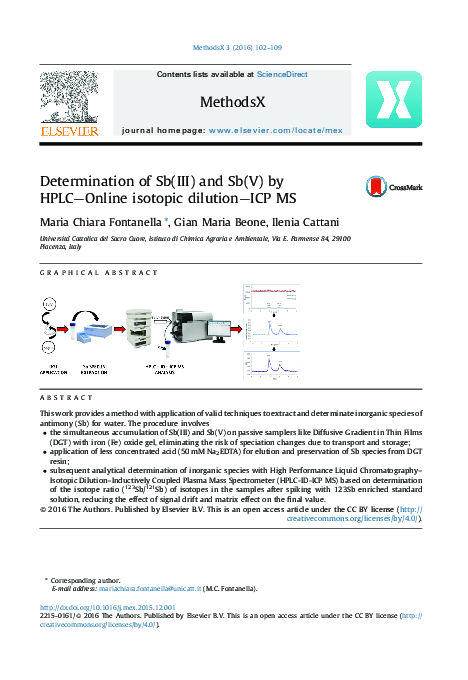
G R A P H I C A L A B S T R A C T
A B S T R A C T
This work provides a method with application of valid techniques to extract and determinate inorganic species of
antimony (Sb) for water. The procedure involves
� the simultaneous accumulation of Sb(III) and Sb(V) on passive samplers like Diffusive Gradient in Thin Films
(DGT) with iron (Fe) oxide gel, eliminating the risk of speciation changes due to transport and storage;
� application of less concentrated acid (50 mM Na2EDTA) for elution and preservation of Sb species from DGT
resin;
� subsequent analytical determination of inorganic species with High Performance Liquid Chromatography–
Isotopic Dilution–Inductively Coupled Plasma Mass Spectrometer (HPLC-ID-ICP MS) based on determination
of the isotope ratio (123Sb/121Sb) of isotopes in the samples after spiking with 123Sb enriched standard
solution, reducing the effect of signal drift and matrix effect on the final value.
ß 2016 The Authors. Published by Elsevier B.V. This is an open access article under the CC BY license (http://
creativecommons.org/licenses/by/4.0/).
* Corresponding author.
E-mail address: mariachiara.fontanella@unicatt.it (M.C. Fontanella).
http://dx.doi.org/10.1016/j.mex.2015.12.001
2215-0161/ß 2016 The Authors. Published by Elsevier B.V. This is an open access article under the CC BY license (http://
creativecommons.org/licenses/by/4.0/).
�M.C. Fontanella et al. / MethodsX 3 (2016) 102–109
103
A R T I C L E I N F O
Method name: DGT, HPLC, ICP MS, isotopic dilution
Keywords: Trivalent antimony, Pentavalent antimony, Diffusive gradient in thin film, High Performance Liquid
Chromatography–Inductively Coupled Plasma Mass Spectrometer, Water, Isotopic dilution
Article history: Received 27 October 2015; Accepted 4 December 2015
Method details
Most of the analytical methods for antimony assessment are based on the determination of total
antimony concentrations. However, it is widely accepted that the impact of a toxic element on the
environment is linked to the presence of its chemical forms [1].
Coupled techniques, based on the combination of a separation method with a suitable element
adsorption system, have become reliable in speciation analysis to discriminate specific forms of an
element.
We report the first investigation of use of Fe-oxide gels in Diffusive Gradient in Thin Films (DGT) for
incorporation of inorganic chemical forms of antimony, especially Sb(III), coupled with High
Performance Liquid Chromatography–Isotopic Dilution–Inductively Coupled Plasma mass spectrometer (HPLC-ID-ICP MS).
Development of method
To develop the method, test of kinetics of binding and elution efficiency of less concentrated acid
(50 mM Na2EDTA) were applied to ensure an appropriate quantitative recovery of the element from
the resin gel of DGT (see SUPPLEMENTARY INFORMATION, Table 1S and Fig. 1S).
The diffusion coefficients of each inorganic species, measured in laboratory using DGT devices in
aqueous solution with know concentration of Sb species at pH 5 and 0.01 M, were 7.60 � 0.05
10�6 cm2 s�1 for Sb(III) and 5.23 � 0.02 7.60 � 0.05 10�6 cm2 s�1 for Sb(V) (see SUPPLEMENTARY
INFORMATION, Table 2S and Fig. 2S). These values reflect the ionic characteristics of antimony species
[2] and they were applied in DGT equation (Eq. (2)) for Sb species determination aqueous solutions.
The effects of pH and ionic strength were observed. At higher pH, measurements of Sb species in Fe
oxide gel agreed with the solution concentrations (see SUPPLEMENTARY INFORMATION, Fig. 4S).
Strong negative effects on Sb species accumulation, especially for Sb(III), by resin gel of DGT were
observed when electrolyte concentration was particularly low or absent (see SUPPLEMENTARY
INFORMATION, Fig. 3S).
For one day deployment the Method Detection Limit (MDL) for a typical DGT device (0.78 mm thick
diffusive gel, 0.13 mm filter) were 0.2 ng mL�1 for Sb(V) and 0.4 ng mL�1 for Sb(III).
DGT devices application
Materials
- Stock solutions of antimony species (1000 mg l�1 for Sb) prepared by antimony (III) potassium
tartrate hemihydrate (C4H4KO7Sb � ½H2O), potassium hexahydroxoantimonate (KSb(OH)6) (Carlo
Erba Reagents).
- Ultra-pure water prepared by a Milli-Q system (18 MV-cm resistance, Millipore1 system, Millipore,
Bedford, MA).
- Boxes for sampling waters with holders for DGTs devices.
- Iron (Fe) oxide DGTs (0.60 mm Fe-oxide gel, 0.78 mm open pore diffusive gel) (DGT Research Ltd.,
Lancaster, UK).
- Stirrer.
- Thermostatic chamber.
- Timer.
�[(Fig._1)TD$IG]
104
M.C. Fontanella et al. / MethodsX 3 (2016) 102–109
Fig. 1. Aqueous solution with Sb(III) and Sb(V) well stirred at constant temperature.
Solutions were prepared before DGT applications in the following way: 2.5 l of aqueous solution
were mixed with know solutions of each species of inorganic antimony and they were well-stirred at
constant temperatures in a cleaned box (Fig. 1).
The temperature of water should be measured at the beginning and the end of the application of
DGTs.
At least three DGTs should be included in the box and they should be left about 24 h (the time
should be exactly measured with timer). Time of contact and temperature were fundamental values to
calculate the concentration of Sb(III) and Sb(V) in water after antimony extraction from resin gel of
DGT through the equation based on Fick’s first law of diffusion (Eq. (2))
After 24 h on the stirrer, DGT units were taken out of the solution and the surfaces were rinsed with
ultra-pure water. After that, the resin gel could be retrieved and the Fe-oxide gel placed in a clean
sample tube.
Antimony species extraction
Materials
- Plastic flasks (digiTUBES 50 ml).
- 10 mL of 50 mM of Ethylenediaminetetraacetic acid disodium salt dehydrate (C10H14N2Na2O8 �
2H2O) (Sigma Aldrich Co).
- Heating block system (DIGIPREP, Scp Science, Quebec, Canada).
- Ultra-pure water prepared by a Milli-Q system (18 MV-cm resistance, Millipore1 system, Millipore,
Bedford, MA).
- 0.45 mm filter (digiFILTER).
The Fe-oxide resin gels were placed in a plastic flask with 10 ml of 50 mM of Ethylenediaminetetraacetic acid disodium salt dihydrate. After that, they were mineralized at 95 8C for 90 min in a
heating block system. The digested DGT gel solutions were filtered by using 0.45 mm filter (digiFILTER)
after appropriate dilution with ultra-pure Water.
HPLC-ID-ICP MS analysis
Instrumentation and material
- ICP-MS (Agilent 7900, Agilent Technologies, USA) with Octopole Reaction System (ORS system)
(Table 1).
- HPLC (Agilent 1100, Agilent Technologies, USA) (Table 1).
- HAMILTON PRP-X100 Anion exchange column (250 mm � 4.6 mm, 5 mm particle size).
- The standard solutions of antimony species were used by diluting the corresponding stock solutions.
- 123Sb-enriched standard solution (ISC Science, Oviedo, Spain) (Table 2).
�105
M.C. Fontanella et al. / MethodsX 3 (2016) 102–109
Table 1
Instrumental operating conditions of HPLC–ICP-MS.
Chromatographic conditions
Column:
Eluent:
Flow rate:
Spike
Flow rate spike
Injection volume:
Column temperature
Acquisition time
HAMILTON PRP-X100 Anion exchange column (250 � 4.6 mm, 5 mm particle size).
10 mM Na2EDTA; 1 mM of KHP
1 ml min�1
Sb standard solution enriched in 123Sb (ISC Science, Oviedo Spain)
0.04 ml min�1
10 mL
room temperature
300 s
ICP-MS conditions
Rf power:
RF Matching:
Carrier gas flow rate:
Dilution Mode:
Dilution Gas:
Sampling depth:
S/C Temp:
Reaction mode:
Measured m/z:
1550 W
1.8 V
Ar 1.05 l min�1
ON
Ar 0.2 l min�1
9 mm
2 8C
ON (He: 3 ml min�1)
Sb 121; Sb 123
Table 2
Characteristics of 123Sb-enriched standard solution (ISC Science, Oviedo, Spain).
123
Sb-enriched standard solution product details:
Chemical species:
Isotope:
Form:
Isotope abundance (%) of
Isotope abundance (%) of
Concentration:
121
123
Sb
Sb
Antimony nitrate
123
Sb (98.66%)
2 ml in HNO3 (2%)
1.343%
98.657%
8.831 � 0.196 (mg g�1 as Sb)
Calibration points were prepared with the same percentage of EDTA in samples. In order to obtain
the concentration of different species, we performed isotopic dilution analysis of calibration points
under species-unspecific spiking. Continuous addition of spike solution of 123Sb, like enriched isotope,
was carried out by peristaltic pump in such a way that was completely and continuously mixed –
through a T piece – with eluent from the column with the separated species (Fig. 2). The number of
mols of the Sb species was providing by integration of each chromatographic peaks in the molar flow
chromatogram. The process to obtain the mass flow chromatogram (Fig. 3C) required the use of
spreadsheet software. The row chromatograms should be available in table form with three columns:
time, intensity of 121Sb and intensity of 123Sb, the graphic representation of each isotopes is shown in
Fig. 3A. Then the isotope ratio, Rm, was calculated like a time-depending function (Fig. 3B). The molar
concentrations were transformed to mass concentrations using atomic weights with application of
Eq. (1) [3].
MF S ¼ cSp dSp f Sp
�
�
AW s Absp Rm �Rsp
a
AW sp As 1�Rm Rs
MFS = mass flow of the sample eluting from the column
cSp = concentrations of the element in the spike (ex. 49.4546 ng/g)
a is the most abundant isotope in the sample
b is the most abundant isotope in the spike
dSp = density of spike solution (ex. 1 g ml�1)
(1)
�[(Fig._2)TD$IG]
106
M.C. Fontanella et al. / MethodsX 3 (2016) 102–109
Fig. 2. Representation of mix of spike solution and effluent from the column.
fSp = flow rate of spike solution (ex. 0.04 ml min�1)
AWS and AWSp = atomic weight of the element in the sample and in the spike
Aas = Isotope abundances for isotopes a (121) in the sample (ex. 57.21)
Aasp = Isotope abundances for isotopes b (123) in the spike (ex. 98.66)
Rm = the isotope ratio (a/b) (121/123) in the mixture
RSp = is the isotope ratio (a/b) (121/123, 1.343%/98.6575%) in the spike
RS = the isotope ratio (b/a) (123/121, 42.79%/57.21%) in the sample
After that, the concentration of compounds at the corresponding retention time in samples was
calculated by dividing the mass concentrations by sample volume injected. For a proper validation of
the results, total analysis on samples should be realized to compare the values with calculated area
from the whole chromatogram.
After that the concentration of the chemical forms of antimony absorbed by the resin of DGTs was
quantified through the mass flow chromatogram, the time–averaged concentration (c) of each species
in a solution was then calculated using DGT equation (Eq. (2)) [4].
C DGT ¼
ðM�DgÞ
ðt�A�DÞ
(2)
Dg = the thickness of the diffusive gel (cm),
t = the deployment time (s)
A = the surface area of the diffusive gel exposed to the bulk solution (cm2)
D = the diffusion coefficient of analyte in the diffusive gel (cm2 s�1),
CDGT was compared with the immersion solution concentration analyzed in the samples taken
during the experiment.
Additional information
Antimony (Sb) is considered to be a nonessential element in plants, animals or humans [2,5]. The
US Environmental Protection Agency of the United States and the European Union evaluated Sb and its
compounds as priority pollutants [6,7].
�[(Fig._3)TD$IG]
107
M.C. Fontanella et al. / MethodsX 3 (2016) 102–109
16000
A
Counts
12000
Sb121
8000
Sb123
4000
Sb (V)
1.88
Sb (III)
3.06
0
0
1
2
3
RT (min)
4
5
Ratio ( 121 Sb/ 123 Sb)
0.08
B
Sb (V)
0.07
0.06
Sb (III)
0.05
0.04
0.03
0.02
0.01
0
0
1
2
RT (min)
3
4
0.25
5
C
Sb (V)
MFS
0.20
Sb (III)
0.15
0.10
0.05
0.00
0
1
2
3
4
5
Time
Fig. 3. Chromatograms procedure to obtain mass flow with isotope dilution equation: 10 ng ml�1 of Sb(III) and Sb(V) in water
(pH = 5 and 0.01 M NaNO3). A = isotope intensities chromatogram; B = chromatogram of ratio between isotope intensities;
C = mass flow chromatogram.
In antimony compounds, the most common oxidation states are 5, 3, and -3. It exists mainly as
Sb(III) and Sb(V) in environmental, biological, and geochemical samples.
Generally trivalent Sb compounds exert a 10 times higher acute toxicity than pentavalent Sb
species. Its concentrations are much higher in natural geothermal systems, where they can range from
500 mg L�1 up to 10 wt.% [8–11].
In this work we developed an analytical chemical procedure based on the above capability of using
HPLC-ID-ICP-MS to separate and determine Sb(III) and Sb(V) in aqueous samples and Fe-oxide resins
from DGT devices application.
The DGT technique is based on a simple device, which accumulates solutes on a binding agent after
passage through a hydrogel, which acts as a well-defined diffusion layer [4]. Concentration of total
�108
M.C. Fontanella et al. / MethodsX 3 (2016) 102–109
dissolved metals in solution is calculated using Fick’s first law of diffusion and the measured mass of
solutes, accumulated on the binding agent after a known deployment time (Eq. (2)). In this way, we
should measure those metal species that are available to organisms. These applications are a
promising preservation procedure and they have the benefit of eliminating the risk of speciation
changes due to transportation and storage of water samples prior to preparation and analysis.
Moreover, this method of passive sampling can be used both in surface water that groundwater
because the analyte uptake efficiency by resin is independent from pH and ionic strength – only low
concentration of electrolyte can influence the behaviour of Sb species, especially Sb(III) –
demonstrating that the charge of analyte or building agent does not significantly affect the uptake
efficiency across environmental variables studied. Further studies on the interaction between Sb
species and organic matter will be needed to observe the creation of complexes with function groups
of humic compounds and their influence on the absorption efficiency of the antimony.
Isotope dilution analysis (IDA) is a well-known analytical technique based on the measurement of
isotope ratios in samples, where its isotopic composition has been altered by the addition of a known
amount of an isotopically enriched element (spike). HPLC-ICP-MS system allows to realize IDA thanks
to its capability to perform isotope ratio measurements and consequently isotope dilution mass
spectrometry due to the mass-specific detection system [12].
In our case, we applied on-line species-unspecific spiking mode. The addition of the isotope tracer
or spike is carried out after the complete separation of the naturally occurring species in the sample
has taken place (post-column spiking). This mode is especially useful either when the structure and
composition of the species is not exactly known or when the corresponding isotopically labelled
compounds are not commercially available or cannot be synthesis [3].
IDA reduces errors derived from instrumental instabilities and matrix effects providing accurate
and precise determinations of elements. It is important that measured isotope ratios are corrected for
mass bias and spectral interferences [13]. Instead use of ORC (octapole reaction system), in ICP MS
analysis, overcome polyatomic interferences thanks to collisions produced by gas (He) between
plasma and the quadrupole mass analyser [13].
Acknowledgement
MethodsX thanks the reviewers of this article for taking the time to provide valuable feedback.
Appendix A. Supplementary data
Supplementary data associated with this article can be found, in the online version, at doi:10.1016/
j.mex.2015.12.001.
References
[1] K.K. Bertine, D.S. Lee, Antimony content and speciation in the water column and interstitial waters of Saanich inlet, in:
Trace Metals in Sea Water, 1983 http://link.springer.com/chapter/10.1007/978-1-4757-6864-0_2 (accessed 13.11.15).
[2] M. Filella, N. Belzile, Y. Chen, Antimony in the environment: a review focused on natural waters: I. Occurrence, Earth Sci.
Rev. 57 (2002) 125–176, http://dx.doi.org/10.1016/S0012-8252(01)00070-8.
[3] P. Rodrı́guez-González, J.M. Marchante Gayón, I.J. Garcı́a-Alonso, A. Sanz-Medel, Isotope dilution analysis for elemental
speciation: a tutorial review, Spectrochim. Acta. B 60 (2005) 151, http://dx.doi.org/10.1016/j.sab.2005.01.005.
[4] W. Davison, H. Zhang, In situ speciation measurements of trace components in natural waters using thin-film gels, Nature
367 (1994) 546–548, http://dx.doi.org/10.1038/367546a0.
[5] R. Iffland, Antimony, in: Handbooks on Toxicity of Inorganic Compounds, Marcel Dekker, New York, 1988p. 67 (Chapter 7).
[6] United States Environmental Protection Agency, Water Related Fate of the 129 Priority Pollutants, Vol. 1, USEPA,
Washington, DC, 1979.
[7] Council of European Union, Council Directive 98/83/EC of 3 November 1998, Quality of Water Intended for Human
Consumption. Off. J. L 330, 32–54.
[8] J.A. Ritchie, Arsenic and antimony in some New Zealand thermal waters, N. Z. J. Sci. 4 (1961) 218–229.
[9] B.G. Weissberg, P.R.L. Browne, T.M. Seward, Ore metals in active geothermal systems, in: H.L. Barnes (Ed.), Geochemistry
of Hydrothermal Ore Deposits, Wiley, New York, 1979, pp. 738–780.
[10] N.N. Kolpakova, Laboratory and field studies of ionic equilibria in the Sb2S3-H2O-H2S system, Geochem. Int. 19 (1982)
46–54.
�M.C. Fontanella et al. / MethodsX 3 (2016) 102–109
109
[11] R.E. Stauffer, J.M. Thompson, Arsenic and antimony in geothermal waters of Yellowstone National Park, Wyoming, USA,
Geochim. Cosmochim. Acta. 48 (1984) 2547–2561, http://dx.doi.org/10.1016/0016-7037(84)90305-3.
[12] S. Hill, M. Bloxham, P. Worsfold, Chromatography coupled with inductively coupled plasma atomic emission spectrometry
and inductively coupled plasma mass spectrometry. A review, J. Anal. At. Spectrom. 8 (1993) 499–515, http://dx.doi.org/
10.1039/JA9930800499.
[13] J.I. Garcia-Alonso, P. Rodrı́guez-González, Isotope Dilution Mass Spectrometry, Royal Society of Chemistry, 2013p. 453 ISBN
978-1-84973-333-5.
�
 Gian Maria Beone