JOURNAL OF CHEMICAL PHYSICS
VOLUME 118, NUMBER 18
8 MAY 2003
Density functional approach on wetting behavior
of binary associating mixtures
Ming-Chih Yeh and Li-Jen Chena)
Department of Chemical Engineering, National Taiwan University, Taipei, Taiwan 106, Republic of China
~Received 24 December 2002; accepted 11 February 2003!
A density functional theory is applied to study wetting behaviors of binary associating mixtures,
which are described by the statistical associating fluid theory of Wertheim. When the associating
interaction is strong, the phase behavior of the binary associating mixture falls into the type-VI
mixtures of the classification scheme of van Konynenburg and Scott. There are two types of
closed-loop phase behaviors for the type-VI mixture. That is, a closed-loop phase diagram for
vapor–liquid–liquid coexistence ~along its triple line! at low pressures and the other one for liquid–
liquid coexistence at a relatively high pressure. In this study, the wetting behavior of the lower liquid
phase at the surface of the upper liquid phase is carefully examined for both vapor–liquid–liquid
coexistence and liquid–liquid coexistence regimes. In the latter regime, a third inert air phase is
introduced since wetting behavior always involves three phases. For both regimes the binary
associating mixture exhibits a sequence of wetting transitions, complete wetting→partial wetting
→complete wetting, along with increasing temperature. The order of wetting transitions is carefully
examined. It is found that the order of wetting transitions is the consequence of the competition
between the attractive interaction range and the associating strength of unlike pair molecules. The
most intriguing behavior is that it is possible to observe the sequence of wetting transitions along
with increasing temperature at two different orders for air–liquid–liquid coexistence at a high
pressure. That is, the upper wetting transition is first order and the lower wetting transition is second
order. The pressure effect on the order of wetting transitions for liquid–liquid coexistence is also
discussed. © 2003 American Institute of Physics. @DOI: 10.1063/1.1565327#
ture ranges: ~1! vapor–liquid–substrate systems such as
liquid helium on cesium substrates at extremely low
temperatures11,12 and ~2! more conventional binary ~or ternary! liquid mixtures at or near room temperature.2–10 We
would like to refer an excellent review article covering all
details of the experimental works on wetting transitions.14
In fact, there are a tremendous number of binary mixtures accessible to experiments. However, only a small subset of possible binary mixtures has been experimentally observed to study their interfacial wetting behavior. More
precisely, most of the experimental studies of binary mixtures in the literature2– 6 belong to the type-II or type-III mixtures of van Konynenburg and Scott.15 Similarly, the theoretical studies16,17 have explored the interfacial wetting
behaviors for only a limited number of binary mixtures, also
restricted to type-II and type-III mixtures only. Recently, the
interfacial behavior for associating binary mixtures against a
hard wall has been carefully examined by a density functional theory.18,19 In addition, reentrant wetting and dewetting behaviors have been found in a binary mixture with one
self-associating component at vapor–liquid interfaces.20
However, there is no study, to the best of our knowledge, of
the wetting behavior for binary associating mixtures ~type
VI! at vapor–liquid interfaces in the literature.
According to the classification scheme of van Konynenburg and Scott,15 a type-VI mixture exhibits two types of
closed-loop phase behavior: one at low pressures and the
other one at high pressures. At low pressures, a type-VI mix-
I. INTRODUCTION
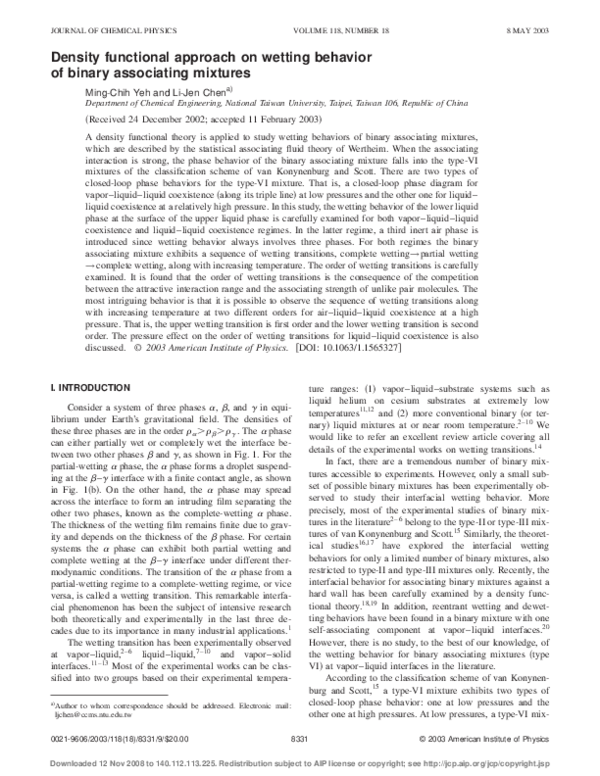
Consider a system of three phases a, b, and g in equilibrium under Earth’s gravitational field. The densities of
these three phases are in the order r a . r b . r g . The a phase
can either partially wet or completely wet the interface between two other phases b and g, as shown in Fig. 1. For the
partial-wetting a phase, the a phase forms a droplet suspending at the b – g interface with a finite contact angle, as shown
in Fig. 1~b!. On the other hand, the a phase may spread
across the interface to form an intruding film separating the
other two phases, known as the complete-wetting a phase.
The thickness of the wetting film remains finite due to gravity and depends on the thickness of the b phase. For certain
systems the a phase can exhibit both partial wetting and
complete wetting at the b – g interface under different thermodynamic conditions. The transition of the a phase from a
partial-wetting regime to a complete-wetting regime, or vice
versa, is called a wetting transition. This remarkable interfacial phenomenon has been the subject of intensive research
both theoretically and experimentally in the last three decades due to its importance in many industrial applications.1
The wetting transition has been experimentally observed
at vapor–liquid,2– 6 liquid–liquid,7–10 and vapor–solid
interfaces.11–13 Most of the experimental works can be classified into two groups based on their experimental temperaa!
Author to whom correspondence should be addressed. Electronic mail:
ljchen@ccms.ntu.edu.tw
0021-9606/2003/118(18)/8331/9/$20.00
8331
© 2003 American Institute of Physics
Downloaded 12 Nov 2008 to 140.112.113.225. Redistribution subject to AIP license or copyright; see http://jcp.aip.org/jcp/copyright.jsp
�8332
J. Chem. Phys., Vol. 118, No. 18, 8 May 2003
M.-C. Yeh and L.-J. Chen
f R 5kT
F
4 h 23 h 2
(i r i ln r i 211 ~ 12 h ! 2
G
~ i5A,B! ,
~2!
where k is Boltzmann’s constant, T is the temperature, r i is
the number density of compound i, and the packing fraction
h 5( p d 3 /6) ( i r i .
The contribution due to the long-range dispersion forces
is treated at the mean-field level21
f M 52
FIG. 1. Wetting behavior of the a phase at the b – g interface: ~a!
complete-wetting behavior and ~b! partial-wetting behavior.
II. MODEL AND METHODOLOGY
The associating system is modeled as a mixture of equalsized hard-sphere particles A and B. Each molecule is assumed to have an active site that allows association only
between unlike pair molecules to mimic hydrogen bonding.
A. Bulk Helmholtz free energy density
The bulk free energy of the statistical associating fluid
theory ~SAFT! of Wertheim is composed of the contributions
of repulsive, attractive and associating parts. The total Helmholtz free energy density of the mixture f can be written as22
f 5 f R1 f M 1 f A ,
~1!
where f R is the free energy density of the hard-sphere reference fluid, f M is the van der Waals mean-field term due to
the isotropic long-range attraction forces, and f A is the contribution of the association between unlike pair molecules.
For equal-sized hard-sphere mixtures with a diameter d,
the repulsive Helmholtz free energy density is described by
the Carnahan–Starling expression23~a!
(i a i j r i r j ,
~3!
where the total strength a i j is defined by
a i j 52
ture exhibits a three-phase vapor–liquid–liquid coexistence.
The three-phase line, known as the triple line, in the phase
diagram of pressure–temperature projection is bounded by
an upper and a lower critical end point ~UCEP and LCEP!,
where the two liquid phases merge into a single phase. At a
fixed high pressure, the type-VI mixtures exhibit two-phase
liquid–liquid coexistence.21 The liquid–liquid immiscibility
gap is bounded by an upper and a lower critical solution
temperature ~UCST and LCST!.
In this study, we would like to start with a type-II mixture and this mixture would have a transition to a type-VI
mixture by increasing the strength of the associating interaction between unlike pair molecules. Both the phase and wetting behaviors are explored in this associating binary ~typeVI! mixture.
This paper is organized as follows: The free energy functional and the details of the calculation procedure are given
in the next section. The results for the phase diagrams and
wetting behaviors of binary associating ~type-VI! mixtures
are presented in Sec. III. Finally, in Sec. IV, we conclude our
work along with a comparison of the theoretical prediction
with experiments.
1
2
E
dr f i j ~ r !
~ i, j5A,B! .
~4!
An isotropic interaction potential of inverse sixth power law
decay is applied,17~e!
f i j ~ r ! 524« i j
S
d
r1 n i j d
D
6
H ~ r2d ! ,
~5!
where « i j is the energy parameter and H is the Heaviside step
function. The parameter n i j is introduced to adjust the range
of attractive interaction between molecules i and j. In our
calculation, the total strength a i j is fixed, and thus the phase
diagram, coexisting densities, and the critical end points are
the same for various n i j . Figure 2 shows the variation of the
interaction potential at three different n i j ’s. Under the condition of constant total strength a i j , the energy parameter « i j
varies accordingly to the parameter n i j . It is interesting to
note that a positive n i j makes a weaker attractive interaction
at short distances and a stronger attractive interaction at long
distances, as illustrated in Fig. 2~b!. On the other hand, a
negative n i j makes a stronger attractive interaction at short
distances and a weaker attractive interaction at long distances.
The association contribution of the free energy is evaluated directly from Wertheim’s first-order thermodynamic perturbation theory. For each molecule with only one attractive
bonding site, the free energy contribution can be written as22
f A 5kT
F
x
1
(i r i ln x i 2 2i 1 2
G
~ i, j5A,B! ,
~6!
where x i is the fraction of non-bonded molecules of type i.
The latter quantities are obtained by solving the following
mass action equations simultaneously:
x A5
1
,
11 r BD ABx B
~7a!
x B5
1
.
11 r AD ABx A
~7b!
The quantity D AB is related to the strength of association
between molecules A and B and is approximated24 by D AB
54 p g HS(d)K AB@ exp(«W /kT)21#. The symbol K AB is the
volume available for association, and « W is the energy parameter of association. In addition, g HS(d) stands for the
contact value of the radial distribution function of the hardsphere fluid and is given by g HS(d)5(120.5h )/(12 h ) 3 . 23
Downloaded 12 Nov 2008 to 140.112.113.225. Redistribution subject to AIP license or copyright; see http://jcp.aip.org/jcp/copyright.jsp
�J. Chem. Phys., Vol. 118, No. 18, 8 May 2003
Wetting behavior of associating mixtures
8333
C. Interfacial properties and density functional theory
The properties of vapor–liquid and liquid–liquid interfaces between coexisting phases of binary associating mixtures can be calculated with the application of density functional theory.25 The Helmholtz free energy density of a
nonuniform binary mixture can be expressed as a functional
of the local densities r i (r):
F„r i ~ r! …5
E
V
1
dr f R „r i ~ r! …1
1
2
(i j
EE
V
E
V
dr f A „r i ~ r! …
dr dr8
3 f i j ~ u r2r8 u ! r i ~ r! r j ~ r8 ! ,
~12!
where f R „r i (r)… and f A „r i (r)… are considered to be functions
of local densities r i (r) and are given by Eqs. ~2! and ~6!.
Consider a planar interface between coexisting phases,
the grand potential functional V„r i (r)… for an inhomogeneous binary mixture can be written as follows:
V„r i ~ r! …5F„r i ~ r! …2
(i m i EV dr r i~ r! ,
~13!
where V is the volume of the system. The equilibrium density profiles across an interface are obtained through the
minimization of the V„r i (r)…. 25 Setting the derivative of
V„r i (r)… with respect to r i (r) equal to zero yields a set of
integral equations at equilibrium chemical potentials m i :
m R „r i ~ r! …1 m A „r i ~ r! …
5 m i2
FIG. 2. Variation of the interaction potential f i j at three different n i j ’s:
20.1 (« i*j 50.53, long-dashed line!, 0.0 (« i*j 50.85, solid line!, and
0.1 (« i*j 51.30, dashed line!. Plot ~b! is the enlargement of the square area in
plot ~a! over the regime that the three curves intersect.
B. Phase diagram calculation
At a fixed temperature, the criteria for a multiphase equilibrium require that the pressure and chemical potential of
each component should be the same in all phases. Hence the
equations used to determine the bulk densities of the N-phase
equilibrium system are given as follows:
m i ~ r AI , r BI ,T ! 5 m i ~ r AII , r BII ,T ! 5¯5 m i ~ r AN , r BN ,T !
~ i5A,B! ,
~8!
I
II
N
, r BI ,T ! 5 P ~ r A
, r BII ,T ! 5¯5 P ~ r A
, r BN ,T ! .
P~ rA
~9!
(i j
E
V
dr8 f i j ~ u r2r8 u ! r j ~ r8 !
~ i5A,B ! ,
~14!
where m R „r i (r)…5 ] f R „r i (r)…/ ]r i (r)
and m A „r i (r)…
5 ] f A „r i (r)…/ ]r i (r).
The last equation can be numerically solved by an iterative method.17~e! The equilibrium bulk densities, which are
evaluated via the standard method mentioned in the previous
section, provide the boundary conditions for the Euler–
Lagrange equations, Eq. ~14!. Once the equilibrium density
profiles across an interface are determined, the interfacial
tension s is easily evaluated from
s5
V„r i ~ r ! …1 PV
,
A
~15!
where A represents the planar interfacial area between coexisting phases. Once the interfacial tensions are obtained,
the wetting behavior can be determined by examining the
interfacial tensions obey Antonow’s rule26 or Neumann’s
inequality.27
The chemical potential of species i is given by
m i5
S D
]f
]r i
,
~10!
T,V, r jÞi
and the equilibrium pressure is thus obtained by
P5
(i m i r i 2 f .
~11!
D. Wetting transition temperature
and order of wetting transitions
Consider the system of three phases a, b, and g at equilibrium. There are three interfacial tensions s ab , s ag , and
s bg , which are the surface tensions of the a – b, a – g, and
b – g interfaces, respectively, in the three-phase coexisting
system. According to the wetting behavior of the a phase at
Downloaded 12 Nov 2008 to 140.112.113.225. Redistribution subject to AIP license or copyright; see http://jcp.aip.org/jcp/copyright.jsp
�8334
J. Chem. Phys., Vol. 118, No. 18, 8 May 2003
M.-C. Yeh and L.-J. Chen
the b – g interface, the relationship of three interfacial tensions can be classified into two cases: ~i! complete-wetting a
phase, the interfacial tensions satisfy Antonow’s rule,26 s bg
5 s ab 1 s ag , as shown in Fig. 1~a! and ~ii! partial-wetting a
phase, the interfacial tensions obey Neumann’s inequality,27
s bg , s ab 1 s ag , as shown in Fig. 1~b!. The wetting transition temperature T W is defined as the temperature at which
the relation of interfacial tensions alters from Neumann’s inequality to Antonow’s rule or vice versa. In this study, we
first determine three interfacial tensions as a function of temperature and then evaluate the temperature dependence of
interfacial tension difference D s (T)5 s ab (T)1 s ag (T)
2 s bg (T). When the interfacial tension difference Ds vanishes at T W , a wetting transition from partial wetting to complete wetting occurs.
In this study, we also determine the order of wetting
transitions by the method of Tarazona and Evans.17~d! A wetting transition is said to be first order if the temperature dependence of wetting film thickness shows a discontinuity at
T W . On the other hand, if the film thickness grows gradually
and diverges at T W , the wetting transition is identified as
second order.6
III. RESULTS AND DISCUSSION
In this section, the wetting behaviors of type-VI mixtures are examined both at low pressures, P * ,0.07, and at
high pressures, P * >1.0. All the calculations are performed in reduced units: T * 5kT/« AA , m i* 5 m i /« AA ,
* 5« W /« AA ,
a*
«W
«*
P * 5 Pd 3 /« AA ,
ij
i j 5« i j /« AA ,
3
3
3
*
*
53 a i j /16p d « AA , K AB5K AB /d , and r i 5 r i d . Note that
* 51025 and n AA5 n BB50 in all our calculations.
K AB
A. Low-pressure regime: Vapor–liquid–liquid
coexistence
For comparison, we first present the results of nonasso* 50, and equal-ranged, n AB50.0 (5 n AA5 n BB)
ciating, « W
* 51.0, a BB
* 51.2, and
mixtures. The energy parameters a AA
* 50.85 are chosen for the model binary mixture. This
a AB
mixture exhibits a liquid–liquid miscibility gap with an
UCEP where the two liquid phases a ~A rich! and b ~B rich!
merge into a single liquid phase coexisting with its vapor
phase g. The phase behavior of the three-phase coexisting
regime is shown in Fig. 3~a!. This mixture is classified as the
type-II mixture of van Konynenburg and Scott.15
Consider the wetting behavior of the a phase at the b – g
interface for the system under three-phase coexistence. A
wetting transition occurs at T W51.148, while the system is
approaching its UCEP (T UCEP51.280) from below. When
T * >T W , the a phase wets the b – g interface. In other
words, a small amount of the a phase forms an intruding
layer separating b and g phases, as illustrated in Fig. 1~a!.
Besides, this wetting transition is found to be second order.
These results are consistent with a previous study of type-II
mixtures by Tarazona et al.17~e!
Now, turn on the effect of associating interaction between unlike pair molecules by increasing the strength of
* ,5—the temperature–
* —say, « W
* . For small « W
«W
composition projection along its triple line is quite insensi* is gradually
tive to association at all temperatures. When « W
*
FIG. 3. Vapor–liquid–liquid equilibrium of the binary mixture with a AA
* 51.2, and a AB
* 50.85 and ~a! « W
* 50.0, ~b! « W
* 57.85, and ~c!
51.0, a BB
* 59.0. The symbol a stands for the A-rich liquid phase ~solid curves!, b
«W
for the B-rich liquid phase ~dotted curves!, and g for the vapor phase ~long
dashed curves!. d: UCEP. j: LCEP.
* >6—the association
increased to higher strengths—say, « W
effect is enhanced, especially at low temperatures. The association effect can be easily delineated by the number density
* , which is defined as r bond
*
of bonded molecules r bond
* (12 x A)5 r B* (12 x B). It is interesting to note that r bond
*
5rA
Downloaded 12 Nov 2008 to 140.112.113.225. Redistribution subject to AIP license or copyright; see http://jcp.aip.org/jcp/copyright.jsp
�J. Chem. Phys., Vol. 118, No. 18, 8 May 2003
* in the b phase,
in the a phase almost coincides with r bond
* in the g phase is too small (,1025 ) to be perwhile r bond
* ,5, over the entire three-phase coexisting
ceptible. When « W
* remains consistently small. Thereregime the quantity r bond
*
* for « W
fore, the phase behavior remains insensitive to « W
*
* >6— r bond
* —say, « W
,5. On the other hand, for large « W
monotonically increases as the temperature decreases. Espe* increases dramatically. This
cially at low temperatures, r bond
phenomenon is consistent with the temperature dependence
of hydrogen-bonding formation. It is easier to form a hydrogen bond at low temperatures. When the temperature is increased, many hydrogen bonds are broken due to larger thermal fluctuations that make the number of hydrogen bonds
decrease.
* , the miscibility of comWith further increase in « W
pounds A and B becomes better at low temperatures due to
* 57.85, a LCEP
the association effect. Eventually, when « W
emerges to form a closed loop, where the two liquid phases a
and b become identical and coexist with its vapor phase g, as
shown in Fig. 3~b!. This association effect induces a transition of phase behavior of the system from type-II to type-VI
* ,7.85, the
mixture, as shown in Fig. 3. That is, when « W
* >7.85 the syssystem belongs to type-II mixtures; when « W
tem falls into the category of type-VI mixtures, as shown in
Fig. 4. The closed loop would shrink with further enhancement of association interaction, as shown in Fig. 3~c!. Fi* .9.03.
nally, the closed loop would disappear for « W
In the meantime, as the phase behavior of the binary
mixture evolves from type II to type VI, another wetting
transition temperature emerges accompanying the occurrence
of the LCEP. Consider the system with relatively strong as* 58.0. While the system temperature approaches
sociation « W
either its UCEP from below or its LCEP from above, a wetting transition from a partial-wetting to a complete-wetting a
phase occurs. Correspondingly, an upper wetting transition
temperature T UW51.040 and a lower wetting transition temperature T LW50.985 are found. When T UW.T * .T LW , the
a phase exhibits partial wetting. Beyond these two wetting
transition temperatures, the a phase completely wets the b – g
interface. In other words, the wetting behavior of the a phase
at the b – g interface would go through a sequence of complete wetting→partial wetting→complete wetting along with
increasing temperature as schematically shown in Fig. 5.
This sequential wetting transition is the so-called reentrant
wetting.20
Figure 4 illustrates the variation of the critical end points
*.
and the wetting transition temperatures as a function of « W
For type-II mixtures, both T UW and T UCEP remain almost
* ,5, as one can see in Fig. 4~a!. For type-VI
constant for « W
* >7.85), both T UW and T LW are driven further
mixtures (« W
away from their corresponding critical end points with in* . Consequently, the regime of the partial-wetting
creasing « W
* increases. Eventually, T UW and
a phase shrinks when « W
T LW merge before the closed-loop phase behavior disappears.
* .8.05, the a phase wets
For very strong associating cases « W
the b – g interface over the entire three-phase coexistence regime, as shown in Fig. 4~b!.
The attractive range parameter n AB has a strong effect on
both T W and the order of a wetting transition. For a nonas-
Wetting behavior of associating mixtures
8335
* on critical end points and wetting transition temperaFIG. 4. Effect of « W
tures with a transition from type-II to type-VI mixtures. Plot ~b! is the
enlargement of plot ~a! over the regime of type-VI mixtures.
* 50) with n AB.0, the wetting transisociating mixture (« W
tion is first order as the range of the A–B attractive potential
is longer than that of the A–A and B–B potentials.17~e! Figure
6 illustrates the effect of n AB on T W and the order of wetting
FIG. 5. Temperature–composition projection and the wetting behavior of a
* 51.0, a BB
*
phase at the b – g interface for the binary mixture with a AA
* 50.85, and « W
* 58.0. d: UCEP. j: LCEP.
51.2, a AB
Downloaded 12 Nov 2008 to 140.112.113.225. Redistribution subject to AIP license or copyright; see http://jcp.aip.org/jcp/copyright.jsp
�8336
J. Chem. Phys., Vol. 118, No. 18, 8 May 2003
FIG. 6. Variation of wetting transition temperatures at different n AB’s:
20.03 ~m!, 0.00 ~d!, 0.01 ~j!, and 0.03 ~L, l!. Plot ~b! is the enlargement of plot ~a! over the regime of type-VI mixtures. The solid symbol
represents a second-order wetting transition, and and the open symbol for a
first-order wetting transition.
* . For n AB50.01, the retransitions along with increasing « W
gime of the partial-wetting a phase slightly shrinks and the
order of wetting transitions is found to be on the borderline
between the first and second orders. For a larger n AB—say,
n AB50.03—T W decreases dramatically and the wetting tran* , but tends to be
sition switches to first order for small « W
*
* is further increased, « W
* .7.5. If « W
second order for « W
.7.7, the system exhibits the complete-wetting a phase over
the entire triple line. For a negative n AB—say,
n AB520.03—the regime of the partial-wetting a phase is
broadened while the order of wetting transitions always remains second order. It could be reminisced that a positive
value of n AB extends the range of attractive interaction between molecules A and B and switches the order of wetting
transitions from second to first order while a negative n AB
prefers the transitions to be second order. On the other hand,
* , which introduces a strong short-ranged
a sufficient large « W
interaction between A and B, would demolish the effect of
n AB and change the order of wetting transitions from first to
second order. Conclusively, a positive n AB favors a first* favors a secondorder wetting transition while a large « W
M.-C. Yeh and L.-J. Chen
FIG. 7. ~a! Phase diagram and ~b! interfacial tensions. Liquid–liquid coexistence at a fixed pressure P * 51.0. The solid curves represent the results
calculated from the binary A1B mixture. The results for pseudobinary
* ’s: 0.15 ~s!, 0.25 ~h!,
A1B1C mixtures are given at three different a CC
and 0.35 ~n!.
order wetting transition. The order of a wetting transition can
be considered as the outcome of the competition between
*.
n AB and « W
Figure 6~b! shows the variation of wetting transition
* . It
temperatures at three different n AB’s as a function of « W
should be noted that all the wetting transitions along the
triple line in Fig. 6~b! are second order.
B. High-pressure regime: Liquid–liquid coexistence
Following the previous section, the parameters of a bi*
* 51.0, a BB
* 51.2, a AB
* 50.85, and « W
nary mixture, a AA
58.1, are applied to mimic a type-VI mixture at high pressures. Figure 7~a! shows the result of phase behavior at P *
51.0. That is a typical immiscibility gap of type-VI mixtures, a closed-loop behavior. The mole fraction of molecules
* 1 r B* ). It should
B, x B , in Fig. 7~a! is defined as x B5 r B* /( r A
be noted that the temperature range of immiscibility (DT
5UCST–LCST) increases with increasing pressure. On the
other hand, the interfacial tension between A-rich ~a! and
B-rich ~b! phases can be evaluated by following the method
described in Sec. II, and the results are given in Fig. 7~b!.
Downloaded 12 Nov 2008 to 140.112.113.225. Redistribution subject to AIP license or copyright; see http://jcp.aip.org/jcp/copyright.jsp
�J. Chem. Phys., Vol. 118, No. 18, 8 May 2003
It should be noted that wetting behavior always involves
three phases. Now, we have the system of two immiscible
liquids. ‘‘Air’’ is chosen to be the third phase. That is, we
would like to examine the wetting behavior of the two immiscible liquids against air. However, there is no way for us
to use the density functional theory to calculate the surface
tension of any liquid ~a or b! phase against air. It is essential
to have equilibrium compositions of two coexisting phases to
calculate the interfacial tension of the interface between two
coexisting phases by the density functional theory. For the
time being, we only have two-liquid phase coexisting. There
is no coexisting ‘‘air’’ phase. Certainly, no equilibrium compositions of air phase can be applied to Eqs. ~13! and ~15! of
the density functional theory. Therefore, a third component C
is introduced to the system to mimic the ‘‘air’’ phase. The
component C should be inert and have negligible effects on
the phase and interfacial behavior of original A1B mixtures.
To ensure the component C mimicking inert air, both the
* and a BC
* are set to zero and a relatively small
parameters a AC
* , is adopted.
energy parameter between C molecules, a CC
Equations ~8! and ~9! are applied to determine the equilibrium compositions of three-phase coexisting ~two liquids and
air! for ternary (A1B1C) mixtures. Figure 7~a! shows the
effect of introducing the component C on the phase behavior
* ’s: 0.15 ~s!, 0.25
~immiscibility gap! at three different a CC
~h!, and 0.35 ~n!. It is obvious that the introduction of the
component C has ‘‘almost’’ no effect on the closed-loop behavior of binary (A1B) mixtures. In fact, the solubility of
the component C in each liquid phase ~a or b! is very small.
More precisely, the mole fraction of the component C in
the liquid ~a or b! phase is always less than 0.0001. Apply
the equilibrium compositions of three-phase coexisting for
ternary (A1B1C) mixtures to the density functional theory
to calculate the interfacial tension between a and b phase.
* ’s:
The results of the interfacial tensions at three different a CC
0.15 ~s!, 0.25 ~h!, and 0.35 ~n! are also given in Fig. 7~b!.
As expected, the introduction of the component C also has
no effect on the interfacial tension of binary (A1B) mixtures. In summary, both phase diagrams and interfacial tensions remain unchanged when the component C is introduced to the mixture A1B as an inert phase. With an
additional air phase, the surface tensions of both liquid
phases against air can be thus determined. Consequently,
wetting behavior of the three-phase coexisting ~two liquids
*
and air! system can be explored. In the following, a CC
50.15 is applied for further discussion on wetting behavior
of the a phase on the surface of the b phase against air
~defined as the g phase hereafter!.
It is found that the wetting behavior of the a phase of the
pseudobinary mixtures at a fixed high pressure is strikingly
similar to that along the triple line at low pressures, described in the previous section. There are two critical temperatures, UCST and LCST, for the closed-loop phase behavior at P * 51.0. When the temperature T is in the middle of
two critical temperatures, the a phase exhibits a partialwetting behavior. While the temperature is driven close to
either its UCST ~51.370! or its LCST ~50.894!, a wetting
transition from partial wetting to complete wetting occurs.
The corresponding upper and lower wetting transition tem-
Wetting behavior of associating mixtures
8337
* on the critical solution and wetting transition temperaFIG. 8. Effect of « W
tures at P * 51.0.
peratures are T UW51.255 and T LW50.934. That is, the a
phase wets the b – g interface when the system temperature T
falls into following two regimes: T UW,T * ,UCST and
LCST,T * ,T LW , as schematically shown in Fig. 1~a!.
Again, the complete-wetting phase is mainly composed of
the liquid with a smaller energy parameter: namely, the
A-rich ~a! phase.
* on the critical solution
Figure 8 shows the effect of « W
temperatures and the wetting transition temperatures. For
* .8.7, the a phase wets
very strong associating mixtures « W
the b – g interface over the entire liquid–liquid coexisting
* ,8.7.
region. The wetting transition occurs only when « W
Along a constant temperature—say, T * 51.0 in Fig. 8—the
* would drive wetting behavior of the a phase
increase in « W
from partial wetting to complete wetting.
All the wetting transitions in Fig. 8 are always second
order, since n AB50. As mentioned above, the order of the
wetting transition can be considered as the outcome of the
* . Therefore, we would like
competition between n AB and « W
to further explore the effect of n AB on the wetting transition
temperature and the order of wetting transitions for strong
* 58.1. Figure 9~a! shows the variaassociation mixtures « W
tions of T W and the order of wetting transitions as a function
of n AB at P * 51.0. In analog to the phenomena observed
along the triple line, the increase in n AB would narrow down
the temperature window of the partial-wetting a phase and
switch the wetting transition from second to first order. When
n AB is further increased beyond 0.052, the a phase wets the
b – g interface over the entire liquid–liquid coexisting region.
Both the upper and lower wetting transitions for small n AB
~,0.01! are second order, as shown in Fig. 9~a!. When n AB is
further increased up to 0.03, both the upper and lower wetting transitions become first order, as expected.
The most intriguing phenomenon is that when n AB
50.02, the upper wetting transition already becomes first
order and the lower wetting transition still remains second
order, as shown in Fig. 9~a!. That is, for the mixture of n AB
50.02, a first-order wetting transition is observed when the
system temperature is approaching its UCST. It is well understood that the association interaction has a stronger contribution at low temperatures, which would favor a second
Downloaded 12 Nov 2008 to 140.112.113.225. Redistribution subject to AIP license or copyright; see http://jcp.aip.org/jcp/copyright.jsp
�8338
J. Chem. Phys., Vol. 118, No. 18, 8 May 2003
M.-C. Yeh and L.-J. Chen
IV. CONCLUSION
FIG. 9. ~a! Variation of wetting transition temperatures as a function of n AB
at P * 51.0. ~b! The pressure effect on the wetting transition temperatures:
P * 51.0 ~d, s!, P * 52.0 ~h, j!, and P * 53.0 ~n, m!. The open symbols
representing the wetting transitions are second order and the filled symbols
for first order.
order. Thus, when the system temperature is approaching its
LCST, one would observe a second-order wetting transition.
This prediction provides the possibility of the existence of
having both first- and second-order wetting transitions in a
type-VI mixture of a closed-loop phase behavior.
Figure 9~b! shows the pressure effect upon the wetting
behavior as well as the order of wetting transitions. As mentioned above, the temperature range of immiscibility increases with increasing pressure. It is interesting to note that
the temperature range of the partial-wetting a phase (DT
5T UW2T LW) also increases with increasing pressure. The
borderlines separating first- and second-order wetting transitions are sketched in Fig. 9~b!. When the system pressure is
raised, the borderlines shift to a higher value of n AB . It is
well understood that the increase in pressure would shorten
the distance between molecules to enhance the short-ranged
contribution. The associating effect is thus strengthened
along with increasing pressure. As a consequence, a secondorder wetting transition is favored even at a higher pressure
under the condition of a fixed n AB .
In this study, the SAFT of Wertheim is applied to successfully describe the type-VI mixture of the classification
scheme of van Konynenburg and Scott. For type-VI mixtures
closed-loop phase diagrams are obtained both at low pressures ~along its triple line, P * ,0.07) and at a fixed high
pressure ( P * >1.0). For the regime of low pressures,
type-VI mixtures exhibit three-phase vapor–liquid–liquid
coexistence and have two critical end points UCEP and
LCEP, where two liquid phases merge into a single liquid
phase coexisting with its vapor phase. With increasing the
temperature a sequence of wetting transitions, complete
wetting→partial wetting→complete wetting, of the denser
liquid a phase at the surface of the other liquid b phase
against its vapor g phase is observed.
For the regime of high pressures, type-VI mixtures exhibit two-phase liquid–liquid coexistence at a fixed pressure
and also have two critical points UCST and LCST, where
two liquid phases merge into a single liquid phase. Since
wetting behavior always involves three phases, a third inert
air phase is introduced. Under the condition of a fixed pressure, when the temperature is increased again a sequence
of wetting transitions, complete wetting→partial wetting
→complete wetting, of the denser liquid a phase at the surface of the other liquid b phase against air is observed.
It is also demonstrated that the order of wetting transitions can be resolved by the competition between the attractive interaction range and the associating effect between unlike molecule pairs. A stronger attractive interaction at long
distances facilitates a first-order wetting transition while a
strong associating interaction in favor of a second-order transition. The most intriguing phenomenon is that it is possible
to observe for certain systems of air–liquid–liquid coexistence at a fixed high pressure the upper and lower wetting
transitions are at two different orders. That is, the upper wetting transition is first order and the lower one is second order.
The only experimental exploration of wetting behavior
of type-VI mixtures, to the best of our knowledge, at liquid–
liquid coexistence was done by Kahlweit and Busse28 for the
binary water1nonionic amphiphile (Ci E j ) mixtures, where
Ci E j is the abbreviation of a nonionic surfactant polyoxyethylene alcohol Ci H2i11 (OCH2 CH2 ) j OH. The wetting behaviors of the aqueous C8 E j homologues ( j50 – 3) mixtures at
a constant temperature were investigated. With a stepwise
increase of the number of oxyethylene groups j from 0 to 3 at
25 °C, the contact angle of a droplet of the C8 E j -rich phase at
the surface of the aqueous phase evolves from about less
than p/2 to close to 2p, indicating a tendency of the existence of the wetting transition from partial wetting to dewetting. That is equivalent to the wetting transition of the aqueous phase at the surface of the C8 E j -rich phase from partial
wetting to complete wetting. It is well understood that the
system with a larger j at a fixed i possesses a higher LCST.29
Hence the increase in j at a constant temperature could be
considered as driving the system closer to its LCST. Consequently, if the number of oxyethylene groups j is further
increased, a wetting transition for the aqueous phase at the
surface of the C8 E j -rich phase from partial wetting to complete wetting is expected. That is, a wetting transition from
Downloaded 12 Nov 2008 to 140.112.113.225. Redistribution subject to AIP license or copyright; see http://jcp.aip.org/jcp/copyright.jsp
�J. Chem. Phys., Vol. 118, No. 18, 8 May 2003
partial wetting to complete wetting should be observed as the
system is brought close to its LCST.
It is found that wetting behavior predicted in this study is
comparable to the binary water1Ci E j mixtures by assigning
molecules A and B as water and Ci E j , respectively. For instance, to start with a partial-wetting a phase at a low tem* is increased isother* 58.1. If « W
perature, T * 51.0 and « W
mally, a transition from a partial-wetting to a complete* 58.4, as illustrated in Fig. 8.
wetting a phase occurs near « W
* is equivalent to the increase in the numThe increase in « W
ber of oxyethylene groups j. This prediction is consistent
with Kahlweit and Busse’s observation on the binary water
1C8 E j mixture with varying j at 25 °C. In addition, our
model also predicts that there exists a wetting transition of
water-rich ~a! phase at the surface of the amphiphile-rich ~b!
phase while the system temperature is driven to approach its
LCST from above, also in accordance with Kahlweit and
Busse’s conjecture28 based on their experimental evidence.
1
M. Schick, in Liquids at Interfaces (Les Houches Session XLVIII, 1988)
edited by J. Charvolin, J. F. Joanny, and J. Zinn-Justin ~Elsevier, Amsterdam, 1990!, p. 415.
2
M. R. Moldover and J. W. Cahn, Science 207, 1073 ~1980!.
3
J. W. Schmidt and M. R. Moldover, J. Chem. Phys. 79, 379 ~1983!.
4
M. Kahlweit, G. Busse, D. Haase, and J. Jen, Phys. Rev. A 38, 1395
~1988!.
5
E. Carrillo, V. Talanquer, and M. Costas, J. Phys. Chem. 100, 5888 ~1996!.
6
~a! D. Bonn, H. Hellay, and G. H. Wegdam, Phys. Rev. Lett. 69, 1975
~1992!; ~b! K. Ragil, J. Meunier, D. Broseta, J. O. Indekeu, and D. Bonn,
ibid. 77, 1532 ~1996!; ~c! D. Ross, D. Bonn, and J. Meunier, Nature
~London! 400, 737 ~1999!; ~d! E. Bertrand, H. Dobbs, D. Broseta, J. O.
Indekeu, D. Bonn, and J. Meunier, Phys. Rev. Lett. 85, 1282 ~2000!.
7
~a! M. Kahlweit, R. Strey, P. Firman, D. Haase, J. Jen, and R. Schomacker,
Langmuir 4, 499 ~1988!; ~b! M. Aratono and M. Kahlweit, J. Chem. Phys.
95, 8578 ~1991!.
Wetting behavior of associating mixtures
8339
8
Y. Seeto, J. E. Puig, L. E. Scriven, and H. T. Davis, J. Colloid Interface
Sci. 96, 360 ~1983!.
9
D. H. Smith and G. L. Covatch, J. Chem. Phys. 93, 6870 ~1990!.
10
~a! L.-J. Chen, J.-F. Jeng, M. Robert, and K. P. Shukla, Phys. Rev. A 42,
4716 ~1990!; ~b! L.-J. Chen and M.-C. Hsu, J. Chem. Phys. 97, 690
~1992!; ~c! L.-J. Chen and W.-J. Yan, ibid. 98, 4830 ~1993!; ~d! L.-J. Chen,
W.-J. Yan, M.-C. Hsu, and D.-L. Tyan, J. Phys. Chem. 98, 1910 ~1994!;
~e! L.-J. Chen, M.-C. Hsu, S.-T. Lin, and S.-Y. Yang, ibid. 99, 4687
~1995!; ~f! L.-J. Chen, S.-Y. Lin, and J.-W. Xyu, J. Chem. Phys. 104, 225
~1996!; ~g! M.-C. Yeh and L.-J. Chen, ibid. 115, 8575 ~2001!.
11
J. Klier, P. Stefanyi, and A. F. G. Wyatt, Phys. Rev. Lett. 75, 3709 ~1995!.
12
E. Rolley and C. Guthman, J. Low Temp. Phys. 106, 81 ~1997!.
13
J. Y. Wang, S. Betelu, and B. M. Law, Phys. Rev. Lett. 83, 3677 ~1999!.
14
D. Bonn and D. Ross, Rep. Prog. Phys. 64, 1085 ~2001!.
15
P. H. van Konynenburg and R. L. Scott, Philos. Trans. R. Soc. London,
Ser. A 298, 495 ~1980!.
16
~a! S. Dietrich and A. Latz, Phys. Rev. B 40, 9204 ~1989!; ~b! T. Getta and
S. Dietrich, Phys. Rev. E 47, 1856 ~1993!.
17
~a! M. M. Telo da Gama and R. Evans, Mol. Phys. 48, 229 ~1983!; ~b! 48,
251 ~1983!; ~c! 48, 687 ~1983!; ~d! P. Tarazona and R. Evans, ibid. 48, 799
~1983!; ~e! P. Tarazona, M. M. Telo da Gama, and R. Evans, ibid. 49, 283
~1983!.
18
~a! C. J. Segura, W. G. Chapman, and K. P. Shukla, Mol. Phys. 90, 759
~1997!; ~b! C. J. Segura, J. Zhang, and W. G. Chapman, ibid. 99, 1 ~2001!.
19
A. Patrykiejew and S. Sokolowski, J. Phys. Chem. B 103, 4466 ~1999!.
20
C. Pérez, P. Roquero, and V. Talanquer, J. Chem. Phys. 100, 5913 ~1994!.
21
J. S. Rowlinson and F. L. Swinton, Liquid and Liquids Mixtures, 3rd ed.
~Butterworth, London, 1982!.
22
G. Jackson, Mol. Phys. 72, 1365 ~1991!.
23
~a! N. F. Carnahan and K. E. Starling, J. Chem. Phys. 51, 635 ~1969!; ~b!
T. Boublı́k, ibid. 53, 471 ~1970!.
24
G. Jackson, W. G. Chapman, and K. E. Gubbins, Mol. Phys. 65, 1 ~1988!.
25
R. Evans, Adv. Phys. 28, 143 ~1979!.
26
F. P. Buff, in Encyclopedia of Physics, edited by S. Flugge ~Springer,
Berlin, 1960!, Vol. 10, Sec. 7, pp. 298 and 299.
27
G. N. Antonow, J. Chem. Phys. 5, 372 ~1907!.
28
M. Kahlweit and G. Busse, J. Chem. Phys. 91, 1339 ~1989!.
29
K. V. Schubert, R. Strey, and M. Kahlweit, J. Colloid Interface Sci. 141,
21 ~1991!.
Downloaded 12 Nov 2008 to 140.112.113.225. Redistribution subject to AIP license or copyright; see http://jcp.aip.org/jcp/copyright.jsp
�
 Li-Jen Chen