BIOINFORMATICS
ORIGINAL PAPER
Vol. 21 no. 15 2005, pages 3234–3240
doi:10.1093/bioinformatics/bti512
Structural bioinformatics
Comparative interactomics analysis of protein family interaction
networks using PSIMAP (protein structural interactome map)
Daeui Park1,† , Semin Lee2,† , Dan Bolser3 , Michael Schroeder4 , Michael Lappe5 ,
Donghoon Oh1 and Jong Bhak2,6,∗
1 Object
Received on February 28, 2005; Revised on April 22, 2005; Accepted on May 19, 2005
Advance Access publication May 24, 2005
ABSTRACT
Motivation: Many genomes have been completely sequenced.
However, detecting and analyzing their protein–protein interactions
by experimental methods such as co-immunoprecipitation, tandem
affinity purification and Y2H is not as fast as genome sequencing.
Therefore, a computational prediction method based on the known
protein structural interactions will be useful to analyze large-scale
protein–protein interaction rules within and among complete genomes.
Results: We confirmed that all the predicted protein family interactomes (the full set of protein family interactions within a proteome) of
146 species are scale-free networks, and they share a small core network comprising 36 protein families related to indispensable cellular
functions. We found two fundamental differences among prokaryotic
and eukaryotic interactomes: (1) eukarya had significantly more hub
families than archaea and bacteria and (2) certain special hub families
determined the topology of the eukaryotic interactomes. Our comparative analysis suggests that a very small number of expansive
protein families led to the evolution of interactomes and seemed to
have played a key role in species diversification.
Contact: jong@kribb.re.kr
Supplementary information: http://interactomics.org
INTRODUCTION
Since 1995, over 250 genomes have been completely sequenced
(Bernal et al., 2001; Shendure et al., 2004). The availability of
such genomic sequence data allows us to conduct a comparative
genomics study, yielding important information on developmental
processes and disease defense mechanisms (Eichler and Sankoff,
2003; O’Brien et al., 1999; Rubin et al., 2000). Protein comparison
using proteomes alone is, however, not sufficient to fully understand
how the cellular machinery evolved over a long period of time. The
fundamental differences among organisms cannot be explained fully
by simply looking at the genes and proteins. A step forward would
be to look at all the interactions among them (Ng et al., 2003; von
Mering et al., 2002).
∗ To
whom correspondence should be addressed.
† The
authors wish it to be known that, in their opinion, the first two authors
should be regarded as joint First Authors.
3234
The full range of functional complexity and diversity in biological systems is probably the result of interactions among biological
entities. The architectures and organization of such interactions are
best represented as networks, for example, networks of interacting
proteins that reflect biochemical pathways and genetic regulations.
It has been reported that, owing to functional constraints, biological
interaction networks are tightly conserved (Bolser and Park, 2003).
The question is about the basic similarity and difference that
underlies the networks of interacting proteins in the completely
sequenced genomes. To answer this question, the examination of
many complete proteomes and their interactomes would be necessary. However, present experimental technology is not fast enough
to map the molecular interactions of proteins for all the completely sequenced genomes. Consequently, computational methods
for assigning and predicting protein interactions have been developed
using the genomic sequence data (Dandekar et al., 1998; Enright
et al., 1999; Huynen and Bork, 1998; Marcotte et al., 1999; Overbeek
et al., 1999; Pellegrini et al., 1999; Tan et al., 2004). The aim of these
methods, however, has been more focused on discovering functional
interactions rather than physical interactions.
Therefore, we introduced a structure-oriented protein interaction
protocol: PSIMAP (protein structural interactome map) (Gong et al.,
2005; Park et al., 2001). The interactions among structural protein
families are fundamental to the workings of cells: in multi-domain
polypeptide chains, in multi-subunit proteins and in transient complexes among proteins that also exist independently. One critical
aspect of PSIMAP is that it allows us to view interactions among
protein domains in terms of their structural families to analyze the
large-scale patterns and evolution of interactomes among species.
(Fig. 1). PSIMAP extracts the exact molecular interaction information of proteins from the Protein Data Bank (PDB) (Berman et al.,
2000) and their domains from the Structural Classification of Proteins
(SCOP) (Murzin et al., 1995). It has a predictive capacity that can be
extended to a genomic scale with the assistance of bioinformatics.
We have built a high-throughput, homology-based interaction
prediction method utilizing PSIMAP. The key advantages of the
PDB-derived predictive method are (1) it covers a many times larger
dataset for probable protein interactions, (2) it can reveal the history
of interaction in genomes with the limited amount of experimental
Published by Oxford University Press 2005
Downloaded from https://academic.oup.com/bioinformatics/article/21/15/3234/195577 by guest on 18 May 2023
Interaction Technologies Inc., CMS Building 705, 373-1, Guseong-dong, Yuseong-gu, Daejeon 305-701,
Korea, 2 Department of BioSystems, KAIST, 373-1, Yuseong-gu, Daejeon 305-701, Korea, 3 Medical Research
Council, Dunn Human Nutrition Unit, Cambridge CB2 2QH, UK, 4 Biotec and Department of Computing, TU
Dresden, 108 01307 Dresden, Germany, 5 Max-Planck-Institute for Molecular Genetics, Ihnestrasse 63-73,
14195 Berlin, Germany and 6 NGIC, KRIBB, Daejeon 305-333, Korea
Comparative analysis of protein family networks
METHODS
Protein structure assignment
To construct the protein family interaction network in a particular proteome,
we first assigned the known three-dimensional structural families (on which
PSIMAP is based) to the protein sequences. For this, 146 completely
sequenced species from the European Bioinformatics Institute (EBI) and
their 578 625 protein sequences were used (Pruess et al., 2003). The 146
genomes represented species of archaea (15), bacteria (122) and eukarya (9).
Among the 578 625 proteins, 296 630 (52%) had at least one SCOP family
assignment. The SCOP database (version 1.65) is a manually curated protein structural domain classification system. The actual structure assignment
of proteins was conducted by the PSI-BLAST algorithm (Altschul et al.,
1997) using the default BLOSUM62 amino acid substitution matrix as a
threshold with 0.01 E-value (expectation value scoring). Several thresholds
ranging from 0.0001 to 0.01 E-values were tested and 0.01 was chosen after a
manual inspection of results, as there was no explosion of erroneous matches
in the iterative searching process of PSI-BLAST. Our experiments showed
that 0.01 E-value provided 2–3% higher coverage than E-value of 0.0001,
without sacrificing the assignment quality.
Our homology assignments were made at the SCOP family level of wellclassified and clearly distinguishable SCOP classes: a (all alpha proteins), b
(all beta proteins), c [alpha and beta proteins (a/b)], d [alpha and beta proteins
(a + b)], e (multi-domain proteins), f (membrane and cell surface proteins and
peptides) and g (small proteins). Out of the 2327 SCOP families 2091 (90%)
were assigned to at least one protein sequence. Then, 371 SCOP families that
did not have interaction information in PSIMAP were filtered out.
Multi-domain proteins contain more than one SCOP domain. A problem in structural assignment is that erroneous alignment overlap can occur
between two domain sequences on the same region of a multi-domain protein.
To overcome this, we regarded domain sequences with an overlap of ≤15
amino acid residues in the alignments as two separate domains in the protein
sequence.
Mapping the protein family interaction
To construct species-specific protein family interactomes, we used PSIMAP
(see http://psimap.org and http://psibase.kaist.ac.kr). PSIMAP is a global
interaction map that describes domain–domain and protein–protein interaction information for known PDB structures. It considers every possible pair
of structural domains within a protein or complex to see if there are at least
five residue contacts within a 5 Ådistance (Bolser et al., 2003). Although the
number of PDB structures is relatively small in comparison with the sequence
data, PSIMAP can cover the majority of known protein structural information
(Fig. 1a) (Aloy and Russell, 2002).
All the predicted protein family interactomes are species specific, and our
aim was to find any evolutionary trend among all the interactomes. Hence, the
interactomes are based at the protein family interaction level, instead of the
individual protein level. Figure 1b shows how interaction intensity is unevenly
distributed in a spherical interaction network layout of three model species
interactomes. The unique topologies of protein family interaction networks
enabled us to compare and analyze them, in order to hypothesize on how the
interactomes have expanded.
In terms of the coverage of the interactomes, we assumed that the present
PDB (the source of interaction information for our analysis) represented the
majority of protein folds in nature. This is because the number of PDB entries
is growing exponentially while the number of new folds is increasing very
slowly. It has been reported that there may be fewer than 2000 distinct protein
architectures in nature (Alexandrov and Go, 1994; Chothia, 1992; Orengo
et al., 1994; Wang, 1996; Zhang, 1997). Therefore, the present structural
interactome data represent a relatively complete set of distinct protein families, although this does not imply that all the possible family interactions
have been observed in the PDB. Also, as a significant portion of the unassigned genes represents transmembrane proteins that are yet to be determined
experimentally, we suggest that PDB and PSIMAP cover the majority of
the existing soluble families in nature. Table 1 shows the subdivision of
the 1720 observed protein families and the 2404 observed protein family
interactions.
RESULTS AND DISCUSSION
The core protein family network of life
We found 36 commonly present protein families in the 146 species. They produced 47 protein family interaction pairs (1.3 links per
family) that are predicted to be conserved across all species (Fig. 2c),
while one-third of the protein family interaction pairs (31%, 734 out
of 2404 total pairs) were counted in over 80 species (Fig. 2a and Supplementary Table 2). The statistical likelihood of forming the core
network (36 families) in the 1720 protein families is 5 × 10⁻⁹ under
a Poisson distribution (i.e. not random).
A notable aspect of the core network is that there are only 17
hetero-interaction pairs, which reflected that many protein families are self- or homo-interacting (e.g. homodimer proteins). There
were 1358 homo- and 1251 hetero-interaction pairs in the PDB. Of
the archaeal interactomes 60% had homo-interaction pairs. Bacteria
had 59%. Eukarya had the lowest rate at 53%. Eukaryotic homointeraction is statistically significantly lower (Kruskal–Wallis test)
than the rest. This indicates that eukaryotic interactomes may have
expanded their interaction partner repertoires more diversely than
archaea and bacteria.
Out of the 36 core protein families 16 (44%) were related to protein translation. Notably, c.37.1.8, the most highly interactive protein
3235
Downloaded from https://academic.oup.com/bioinformatics/article/21/15/3234/195577 by guest on 18 May 2023
interaction information available at present and (3) it provides explicit models of structural interactions that can be used in the validation
of the predicted interactions. A disadvantage is that the individual
protein interaction information cannot be readily verified. However,
we found that 340 out of the 591 (57.5%) human protein interactions in the Database of Interacting Proteins could be explained by
structural interactions (Moon et al., 2005).
To investigate the broad evolutionary trend in protein interaction
networks, the use of conserved protein family interactions is more
appropriate than individual protein interactions. For this reason, in
our comparative analysis using PSIMAP the precise verification of
individual molecular interactions is not necessary, and the reliability of the family interaction predictions is mostly dependent on
accurate family detection in the genomes. Although particular organisms may inevitably have false or missing predictions, in general
this should not greatly affect the overall comparative family level
analysis.
Based on the comparative analysis results of protein family
interaction networks reconstructed by PSIMAP (see Supplementary Table 1), we were able to get insight into species diversification
in terms of computationally predicted protein family interactomes
and their common features. First, we found that all 146 species’ protein family interactomes share a small core network comprising 47
protein family interaction pairs (including self- or homo-interacting
pairs). Although small and probably incomplete in number, we can
infer that the core is well-conserved in diverse life forms. A notable
outcome was that a very small number of expansive protein families
played a key role in the interactome growth and determined the characteristics of the interactomes of prokarya (archaea and bacteria) and
eukarya. Eukaryotic interactomes have a distinctly different topology
from prokaryotic interactomes regardless of the proteome size.
D.Park et al.
(a)
(b)
Table 1. Summary of structure assignment and comparative analysis of protein family interaction networks at the superkingdom level
Description
Archaea
Bacteria
Eukarya
All
No. of species
No. of proteins
No. of structure assigned proteins
No. of families assigned to proteins
No. of families assigned to proteins that can be covered by PSIMAP
No. of protein family interaction pairs
15
35 197
16 085
986
830
1086
122
362 484
186 539
1526
1281
1691
9
180 944
94 006
1616
1340
1916
146
578 625
296 630
2091a
1720a
2404a
a
Non-redundant count.
family (Bolser et al., 2003; Bolser and Park, 2003) contained domain
variations that were directly related to protein translation such as
elongation factors Tu/1-alpha/2 and initiation factors IF2/eIF2/eIF5b.
Seven protein families (19%) were related to DNA-binding proteins. The last five protein families (14%) were related to ATP
metabolism (see Supplementary Table 3). Our results corroborate
previous studies on well-conserved and minimal gene sets. The
functions of protein families constituting a core network are mostly
related to protein translation, ribosomal structure and biogenesis
(Aravind et al., 2000; Koonin, 2000; Mushegian, 1999; Tatusov et al.,
1997).
3236
At the other end of the scale, many protein family interactions
appear species or lineage specific (Fig. 2a, right-hand side and
Fig. 2b, left-hand side). This U-shape trend is, however, not common throughout the superkingdoms. Archaea and bacteria show more
unique protein family interactions, while eukarya have fewer unique
family interactions. Eukarya have a higher ratio of common protein families without many unique interaction pairs (Fig. 2b). To
check if this trend is found in the occurrences of protein families,
we also plotted protein family numbers without considering their
interactions (data not shown). We found the same U-shape distribution for prokarya. This suggests faster evolution rates of prokarya
Downloaded from https://academic.oup.com/bioinformatics/article/21/15/3234/195577 by guest on 18 May 2023
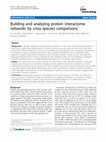
Fig. 1. Global view of protein family interaction networks. (a) An overview of PSIMAP for all the protein family interactions (1895 protein family nodes,
2655 protein family interaction pairs). Each family is color-coded by its connectivity. More than one-fifth of the families are part of the large connected cluster
centering c.37.1.8 (G-proteins). Other highly connected nodes are b.47.1.2 (eukaryotic proteases) and d.58.1.5 (ferredoxin domain). Most of the protein families
have only 1–3 interaction partners. (b) Spherical layout of protein family interactomes for three species from three different superkingdoms: Protein family
interaction networks for Thermoplasma acidophilum (archaea, 432 protein families, 552 protein family interaction pairs), E.coli (bacteria, 856 protein families,
1100 protein family interaction pairs) and Homo sapiens (eukarya, 1126 protein families, 1624 protein family interaction pairs). The protein families were
taken from SCOP. The protein family interactions were assigned by PSIMAP. Depending on the number of protein families and their interactions, the density
of the network varies, representing the complexity of the interactomes.
Comparative analysis of protein family networks
(a)
(b)
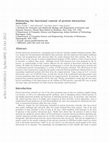
Fig. 2. The frequency of protein family interaction pairs and a core protein family network. (a) The frequency of protein family interaction pairs in 146 species.
X represents the number of species, and Y the number of family interaction pairs. Out of the 2404 (2%) 47 protein family interaction pairs are observed in all
the 146 species. (b) The frequency of protein family interaction pairs for three superkingdoms. The numbers of species and protein family interactions were
normalized to plot in the same scale. (c) A core protein family network, conserved protein family interaction pairs in all the 146 species (36 protein families,
47 protein family interaction pairs); hetero-interaction pairs, interaction pairs among different protein families were 17 and homo-interaction pairs were 30.
The loop indicates homo-interaction. The boxes represent functional clustering. The largest box on the right is for protein translation. The left boxes are for
DNA binding and ATP metabolism. Other functions found are mostly enzymatic activities such as exonuclease, dehydrogenase, nitrogenase, aldolase and DNA
gyrase.
(Nancy et al., 1995) with more room for new interaction links.
This would result in a high ratio of species-specific protein families and their interactions. Also, the eukaryotic era is shorter than
that of prokarya, and it is bound to have fewer unique protein family interactions. We suspect that some portion of the unique protein
families and their interactions is due to an artifact from incomplete
protein structure assignment. When the protein structural assignment ratio for proteomes increases, their portion decreases gradually to give an accurate number of highly species-specific protein
interactions.
Functional coverage of structure assigned proteins
We carried out a test to quantify the coverage of biological functions with the structurally assigned proteins. Using EBI’s GOA-slim
(Camon et al., 2004), a selected set of Gene Ontology (GO) (Harris
et al., 2004), we found that most GO annotations (97% on average)
for a complete proteome can be covered by structurally assigned
proteins. Although the coverage of our structural assignment is
∼50% of whole proteomes, its functional coverage was high enough
to deal with overall biological functions. The functional assignment
comparison is given in Supplementary Figure 1.
We also carried out a functional analysis of the core protein
families. Out of the 296 630 proteins, 45 164 belonged to the core
protein families, and they covered 83% of GO annotations at the
level of EBI’s GOA-slim. In a GO ‘biological process’ mapping,
>91% of the core protein family assigned proteins were associated
with central biochemical processes categories such as physiological
process (GO:0007582), cellular process (GO:0009987), cellular
physiological process (GO:0050875), metabolism (GO:0008152),
nucleobase, nucleoside, nucleotide and nucleic acid metabolism (GO:0006139), biosynthesis (GO:0009058), macromolecule metabolism (GO:0043170), and transport (GO:0006810). In
the ‘molecular function’ category of GO, >90% of the proteins were associated with binding (GO:0005488), catalytic activity (GO:0003824), hydrolase activity (GO:0016787), nucleic
acid binding (GO:0003676), ligase activity (GO:0016874), transporter activity (GO:0005215), transferase activity (GO:0016740),
helicase activity (GO:0004386) and structural molecule activity
(GO:0005198).
Given the functional coverage, it seems likely that the core protein family network spanning all types of life forms was formed in
the very early stage of evolution, occupying the core biochemical
processes for life. After the initial formation, a gradual attachment
of the interactome seems to have occurred for a long period of time
as peripheral functions, such as cell motility (GO:0006928), membrane fusion (GO:0006944), extracellular structure organization and
biogenesis (GO:0043062), and pathogenesis (GO:0009405), were
needed.
3237
Downloaded from https://academic.oup.com/bioinformatics/article/21/15/3234/195577 by guest on 18 May 2023
(c)
D.Park et al.
Connectivity of protein family interaction networks
Network topology and interactome complexity of
prokarya and eukarya
The function of a protein is often affected by its interacting partners.
The topology of interaction networks among protein families is
determined by (1) the number of protein families, (2) the number of
their interactions and (3) the topology of the interaction link patterns.
Having calculated the number of all the interaction pairs for the 146
species, we found that the number of interaction pairs increases linearly along with the number of protein families without any particular
deviation from species to species (Fig. 3a). This indicates that the size
of a protein interaction network itself does not determine the topology
3238
of the evolving network. Rather, it is closely related to the presence
and number of extreme hub families that are capable of continuous
growth.
As shown in Figure 3a, increasing one interaction node resulted in one additional interaction edge on average, regardless of the
superkingdoms. Figure 3b shows that eukaryotic proteomes have
distinctively higher γ values upon increasing the number of interaction pairs. This is due to the different complexity levels they have
with a small number of large hub families. Figure 3c shows the
degree of interaction for the most highly interacting protein family
(G-proteins, c.37.1.8 SCOP family). The number of interacting partners of G-proteins is very high in eukarya. This is a major distinction
between eukarya and prokarya, where certain families exploded in
the number of interaction partners as the overall interactome size
increased. In contrast to the G-proteins, 2Fe-2S ferredoxin domains
(d.15.4.2 SCOP family) did not show many extra interaction partners in eukarya, although the interactome size increased (Fig 3d).
This is because, while the G-proteins grew rapidly in eukarya, the
2Fe-2S ferredoxin domains remained conservative in incorporating
new interacting partners. In other words, these two families could be
important components distinguishing eukarya from other superkingdoms. From a functional view, it is plausible that G-proteins have
evolved to transduce signals and mediate multicellularity, resulting
in a homogeneous environment in eukarya, while 2Fe-2S ferredoxin
domains have evolved under the pressure of necessity for diverse
metabolism in prokarya.
Specifically, in the comparison of E.coli and S.cerevisiae, the number of interaction pairs is similar in size (1120 and 1097, respectively)
even though they belong to different superkingdoms (see Supplementary Table 1). However, the value of γ representing connectivity
distribution of the network was 2.58 in E.coli and only 2.03 in
S.cerevisiae. This is because yeast has more hub families, and the hub
families are larger despite the similar number of nodes and edges.
We suggest that the difference between their interaction network
topologies is responsible for their organismal complexity. One mechanism for the higher number of interactions with the same number
of interacting families could be compartmentalization within cells.
The same kind of structures can have different interacting partners if
they are located in different compartments without interfering with
other similar molecular interactions. If we regard all the cellular functions as a part of information processing, this could be viewed as an
optimization strategy of information processing in S.cerevisiae.
Expansion of protein family networks
As discussed above, interactomes can reveal the differences among
species in terms of their network topologies. To analyze the evolution
of protein family networks, we measured the correlation between the
interaction degree of each protein family in each of the 146 predicted
interaction networks. The correlation was calculated by Pearson’s
correlation coefficient method, which set the score 0.5–1 on positive
correlations, −0.49 to 0.49 on non-correlations and −1 to −0.5 on
negative correlations (see Supplementary Table 4).
We found that only a limited number of protein families have
positive correlations (199 out of 1720). Therefore, most of the protein families in a species do not have a positive correlation with the
number of total interaction pairs in interactomes. An example for
the positive correlations is the c.37.1.8 (Fig. 3c). Another example
is the d.15.4.2, which contains increased interaction partners in all
Downloaded from https://academic.oup.com/bioinformatics/article/21/15/3234/195577 by guest on 18 May 2023
A simple method of characterizing an interactome is to calculate the
degree (the total number of connections) of an interacting protein
family. In the protein family interactomes, degree (k) is the total
number of connecting partners at the protein family level (in physics,
this quantity is often called ‘connectivity’ and has a different meaning
in the graph theory) (Dorogovtsev and Mendes, 2002; Fraser et al.,
2002). The degree is the actual number of nearest neighbors of a
node (protein family). The degree distribution, the total distribution
of degrees of a network, P (k), has been reported to be of a power-law
form: P (k) ∼ k −γ in most biological networks (Fraser et al., 2002;
Wagner, 2001).
We found that the γ is 2.57 ± 0.11 for the 15 archaeal species
and 2.55 ± 0.11 for the 122 bacterial species, on average. We found
the average γ of nine eukaryotic species had a much lower value of
2.08 ± 0.09. This means that protein family interactomes are scalefree (Jeong et al., 2001; Steffen et al., 2002) in all superkingdoms
with a distinction between eukarya and the rest (see Supplementary
Table 1). Eukarya have a higher number of hub families (Barabasi and
Oltvai, 2004) than those of archaea and bacteria. Also, in eukarya, the
hub families have higher numbers of interaction partners, although
the criterion for the selection of the constituents in a hub family is
arguable. The highest degree ranges from 24 to 38 for eukarya, from
11 to 17 for bacteria and from 9 to 11 for archaea.
Eukarya have more multi-domain proteins than prokarya in general
(Apic et al., 2001). We can explain the eukaryotic protein family interaction networks with many factors including the presence
of multi-domained proteins. However, being multi-domained alone
cannot fully account for this. For example, Pseudomonas syringae
(bacteria) and Saccharomyces cerevisiae (eukarya) have similar
assignable proteome sizes of 2812 (52% of total) and 2784 (45% of
total), and have multi-domain proteins of 752 and 720, respectively;
however, they have different γ of 2.67 and 2.03. That is, S.cerevisiae
has more hub protein families than P.syringae. Although being multidomained influences the difference, it does not account for the total
architectural difference between the two types.
This high number of interaction partners is not a simple function
of proteome size. In the case of Encephalitozoon cuniculi (a eukaryotic parasite protozoan; proteome size: 839 proteins; genome size:
2.9 Mb), the largest hub family has 24 interaction partners, while
80% of other protein families have one or two interaction partners.
Although its proteome is smaller than that of Escherichia coli (2338
proteins, 5.2 Mb), the connectivity of the main hub family is much
larger than that of E.coli (15 interaction partners). This implies that
there is a fundamental difference between prokaryotic and eukaryotic
interactomes.
Comparative analysis of protein family networks
(b)
(c)
(d)
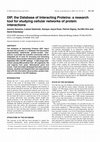
Fig. 3. Correlation analysis among the characteristics of a protein family network. (a) Correlation between the number of protein families and the number of
their interaction pairs in a species. The number of protein family interaction pairs has linearly (slope: 1.35) increased with the number of protein families in
each species across all three superkingdoms. There was no relation to the kind of species observed. (b) The number of protein family interaction pairs in a
species with a γ value of its protein family interaction network was plotted for all the 146 species. γ Values of eukarya (2.24–1.96) are distinctively higher
than those of archaea (2.75–2.37) and bacteria (2.74–2.16). (c and d) Two examples of protein families that show positive correlation between the number
of interaction partners for the family and the total number of protein families for the species. c.37.1.8 (G-proteins) showed positive correlation especially in
eukarya. d.15.4.2 (2Fe-2S ferredoxin domains) showed positive correlation in all three superkingdoms.
species along with the number of protein family interaction pairs
(Fig. 3d). d.15.4.2 is the ferredoxin family, made up of iron–sulfur
proteins mediating electron transfer in a range of metabolic reactions
(Mason and Cammack, 1992; Otaka and Ooi, 1989). In chloroplasts,
2Fe-2S ferredoxin functions as electron carriers in the photosynthetic
electron transport chain and electron donors to various cellular proteins (Gibney et al., 1996). From the correlation pattern analysis of
other ferredoxin families, it is probable that protein family interactions related to ATP synthesis were central to life from the very
early days, and they increased in number in a manner shared by all
species.
CONCLUSION
We introduced an analysis protocol that was based on protein family
interactions, PSIMAP. Using this protocol, we identified the core
network of 47 protein family interaction pairs in all the 146 species.
The functions of families constituting the core network are protein
translation, ribosomal structure, DNA binding and ATP metabolism.
The results confirmed previous studies that all species share the
same basic protein families and family interactions critical to cellular
functions.
We noted topological characteristics in the interactomes across
species: the protein family networks of eukarya had more hub
families than archaea and bacteria. This implies an architectural
difference between prokaryotic and eukaryotic interactomes.
The number of protein family interaction pairs increased linearly
with the number of protein families, regardless of the species. In
this respect, we suggest that the increase of network size itself does
not determine the characteristics of an evolving network. Only a
small number of protein families have a very large number of protein family interaction partners, especially in eukarya. We suggest
that big hub families continuously increase their number of interaction partners. Therefore, the addition of new protein families to
the evolving network is driven not by a random process to all the
protein families but by a selective process to special hub families. The recent empirical data (Eriksen and Hornquist, 2002; Jeong
et al., 2003; Newman, 2001) on the dynamics of the attachment of
new edges in various growing networks support this mechanism.
Interestingly, this indicates that a very small number of special protein families (G-proteins, c.37.1.8 SCOP family for example) play a
key role in driving all species diversifications, especially in higher
organisms.
We suggest a unique approach to detect an ‘interaction’ core
for many species without expensive experiments. As the structural
assignment rate using the PDB rises, we expect to expand and eventually complete the core. At this stage, our finding confirms the known
small core network.
3239
Downloaded from https://academic.oup.com/bioinformatics/article/21/15/3234/195577 by guest on 18 May 2023
(a)
D.Park et al.
ACKNOWLEDGEMENTS
The authors would like to thank their colleagues at the Biomatics laboratory, especially, HwanHo Choi. Maryana Bhak corrected
and edited this manuscript. S.L would like to thank Juok Cho for
helping with the statistical analysis. This project was supported by
Biogreen21 program of RDA KRIBB Research Initiative Program
and R01-2004-000-10172-0 grant from KOSEF. We thank the constructively helpful reviewers.
Conflict of Interest: none declared.
Alexandrov,N.N. and Go,N. (1994) Biological meaning, statistical significance and classification of local spatial similarities in nonhomologous proteins. Protein Sci., 3,
866–875.
Aloy,P. and Russell,R.B. (2002) Interrogating protein interaction networks through
structural biology. Proc. Natl Acad. Sci. USA, 99, 5896–5901.
Altschul,S.F. et al. (1997) Gapped BLAST and PSI-BLAST: a new generation of protein
database search programs. Nucleic Acids Res., 25, 3389–3402.
Apic,G. et al. (2001) An insight into domain combinations. Bioinformatics,
17 (Suppl. 1), S83–S89.
Aravind,L. et al. (2000) Lineage-specific loss and divergence of functionally linked
genes in eukaryotes. Proc. Natl Acad. Sci. USA, 97, 11319–11324.
Barabasi,A.L. and Oltvai,Z.N. (2004) Network biology: understanding the cell’s
functional organization. Nat. Rev. Genet., 5, 101–113.
Berman,H.M. et al. (2000) The Protein Data Bank. Nucleic Acids Res., 28, 235–242.
Bernal,A. et al. (2001) Genomes OnLine Database (GOLD): a monitor of genome
projects world-wide. Nucleic Acids Res., 29, 126–127.
Bolser,D.M. and Park,J.H. (2003) Biological network evolution hypothesis applied to
protein structural interactome. Genomics Inform., 1, 7–19.
Bolser,D. et al. (2003) Visualisation and graph-theoretic analysis of a large-scale protein
structural interactome. BMC Bioinformatics, 4, 45.
Camon,E. et al. (2004) The Gene Ontology Annotation (GOA) Database: sharing
knowledge in Uniprot with Gene Ontology. Nucleic Acids Res., 32, D262–D266.
Chothia,C. (1992) Proteins. One thousand families for the molecular biologist. Nature,
357, 543–544.
Dandekar,T. et al. (1998) Conservation of gene order: a fingerprint of proteins that
physically interact. Trends Biochem. Sci., 23, 324–328.
Dorogovtsev,S.N. and Mendes,J.F. (2002) Evolution of networks. Adv. Phys., 51,
1079–1187.
Eichler,E.E. and Sankoff,D. (2003) Structural dynamics of eukaryotic chromosome
evolution. Science, 301, 793–797.
Enright,A.J. et al. (1999) Protein interaction maps for complete genomes based on gene
fusion events. Nature, 402, 86–90.
Eriksen,K.A. and Hornquist,M. (2002) Scale-free growing networks imply linear
preferential attachment. Phys. Rev. E Stat. Nonlin. Soft Matter Phys., 65, 017102.
Fraser,H.B. et al. (2002) Evolutionary rate in the protein interaction network. Science,
296, 750–752.
Gibney,B.R. et al. (1996) Ferredoxin and ferredoxin-heme maquettes. Proc. Natl Acad.
Sci. USA, 93, 15041–15046.
Gong,S. et al. (2005) PSIbase: a database of Protein Structural Interactome map
(PSIMAP). Bioinformatics, 21, 2541–2543.
Harris,M.A. et al. (2004) The Gene Ontology (GO) database and informatics resource.
Nucleic Acids Res., 32, D258–D261.
3240
Downloaded from https://academic.oup.com/bioinformatics/article/21/15/3234/195577 by guest on 18 May 2023
REFERENCES
Huynen,M.A. and Bork,P. (1998) Measuring genome evolution. Proc. Natl Acad. Sci.
USA, 95, 5849–5856.
Jeong,H. et al. (2001) Lethality and centrality in protein networks. Nature, 411, 41–42.
Jeong,H. et al. (2003) Measuring preferential attachment for evolving networks.
Europhys. Lett., 61, 567–572.
Koonin,E.V. (2000) How many genes can make a cell: the minimal-gene-set concept.
Annu. Rev. Genomics Hum. Genet., 1, 99–116.
Marcotte,E.M. et al. (1999) Detecting protein function and protein–protein interactions
from genome sequences. Science, 285, 751–753.
Mason,J.R. and Cammack,R. (1992) The electron-transport proteins of hydroxylating
bacterial dioxygenases. Annu. Rev. Microbiol., 46, 277–305.
Moon,H.S. et al. (2005) Architecture of basic building blocks in protein and domain
structural interaction networks. Bioinformatics, 21, 1479–1486.
Murzin,A.G. et al. (1995) SCOP: a structural classification of proteins database for the
investigation of sequences and structures. J. Mol. Biol., 247, 536–540.
Mushegian,A. (1999) The minimal genome concept. Curr. Opin. Genet. Dev., 9,
709–714.
Nancy,A.M. et al. (1995) Faster evolutionary rates in endosymbiotic bacteria than in
cospeciating insect hosts. J. Mol. Evol., 41, 727–731.
Newman,M.E. (2001) Clustering and preferential attachment in growing networks.
Phys. Rev. E Stat. Nonlin. Soft Matter Phys., 64, 025102.
Ng,S.K. et al. (2003) Integrative approach for computationally inferring protein domain
interactions. Bioinformatics, 19, 923–929.
O’Brien,S.J. et al. (1999) The promise of comparative genomics in mammals. Science,
286, 458–462, 479–481.
Orengo,C.A. et al. (1994) Protein superfamilies and domain superfolds. Nature, 372,
631–634.
Otaka,E. and Ooi,T. (1989) Examination of protein sequence homologies: V. New
perspectives on evolution between bacterial and chloroplast-type ferredoxins inferred
from sequence evidence. J. Mol. Evol., 29, 246–254.
Overbeek,R. et al. (1999) The use of gene clusters to infer functional coupling. Proc.
Natl Acad. Sci. USA, 96, 2896–2901.
Park,J. et al. (2001) Mapping protein family interactions: intramolecular and intermolecular protein family interaction repertoires in the PDB and yeast. J. Mol. Biol.,
307, 929–938.
Pellegrini,M. et al. (1999) Assigning protein functions by comparative genome analysis:
protein phylogenetic profiles. Proc. Natl Acad. Sci. USA, 96, 4285–4288.
Pruess,M. et al. (2003) The Proteome Analysis database: a tool for the in silico analysis
of whole proteomes. Nucleic Acids Res., 31, 414–417.
Rubin,G.M. et al. (2000) Comparative genomics of the eukaryotes. Science, 287,
2204–2215.
Shendure,J. et al. (2004) Advanced sequencing technologies: methods and goals. Nat.
Rev. Genet., 5, 335–344.
Steffen,M. et al. (2002) Automated modelling of signal transduction networks. BMC
Bioinformatics, 3, 34.
Tan,S.H. et al. (2004) ADVICE: Automated Detection and Validation of Interaction by
Co-Evolution. Nucleic Acids Res., 32, W69–W72.
Tatusov,R.L. et al. (1997) A genomic perspective on protein families. Science, 278,
631–637.
von Mering,C. et al. (2002) Comparative assessment of large-scale data sets of protein–
protein interactions. Nature, 417, 399–403.
Wagner,A. (2001) The yeast protein interaction network evolves rapidly and contains
few redundant duplicate genes. Mol. Biol. Evol., 18, 1283–1292.
Wang,Z.X. (1996) How many fold types of protein are there in nature? Proteins, 26,
186–191.
Zhang,C.T. (1997) Relations of the numbers of protein sequences, families and folds.
Protein Eng., 10, 757–761.
Comparative interactomics analysis of protein family interaction networks using PSIMAP (protein structural interactome map)
Bioinformatics, 2005
Motivation: Many genomes have been completely sequenced. However, detecting and analyzing their protein–protein interactions by experimental methods such as co-immunoprecipitation, tandem affinity purification and Y2H is not as fast as genome sequencing. Therefore, a computational prediction method based on the known protein structural interactions will be useful to analyze large-scale protein–protein interaction rules within and among complete genomes. Results: We confirmed that all the predicted protein family interactomes (the full set of protein family interactions within a proteome) of 146 species are scale-free networks, and they share a small core network comprising 36 protein families related to indispensable cellular functions. We found two fundamental differences among prokaryotic and eukaryotic interactomes: (1) eukarya had significantly more hub families than archaea and bacteria and (2) certain special hub families determined the topology of the eukaryotic interactomes.......Read more