Research Article
Trends in mortality after diagnosis of hepatitis B or C infection:
1992–2006
Scott R. Walter1,2, Hla-Hla Thein1, Janaki Amin1, Heather F. Gidding1, Kate Ward2, Matthew G. Law1,
Jacob George3, Gregory J. Dore1,⇑
1
National Centre in HIV Epidemiology and Clinical Research, The University of New South Wales, Sydney, Australia; 2New South
Wales Department of Health, Sydney, Australia; 3Storr Liver Unit, Westmead Hospital and Westmead Millennium Institute, University of
Sydney, Sydney, Australia
Background & Aims: Chronic hepatitis B (HBV) or C (HCV) virus
infection has been associated with increased risk of death, particularly from liver- and drug-related causes. We examined specific
causes of death among a population-based cohort of people
infected with HBV or HCV to identify areas of excess risk and
examine trends in mortality.
Methods: HBV and HCV cases notified to the New South Wales
(NSW) Health Department between 1992 and 2006 were linked to
cause of death data and HIV/AIDS notifications. Mortality rates and
standardised mortality ratios (SMRs) were calculated using person
time methodology, with NSW population rates used as a comparison.
Results: The study cohort comprised 42,480 individuals with
HBV mono-infection and 82,034 with HCV mono-infection. HIV
co-infection increased the overall mortality rate three to 10-fold
compared to mono-infected groups. Liver-related deaths were
associated with high excess risk of mortality in both HBV and
HCV groups (SMR 10.0, 95% CI 9.0–11.1; 15.8, 95% CI 14.8–
16.8). Drug-related deaths among the HCV group also represented an elevated excess risk (SMR 15.4, 95% CI 14.5–16.3).
Rates of hepatocellular carcinoma (HCC)-related death remained
steady in both groups. A decrease in non-HCC liver-related deaths
was seen in the HBV group between 1997 and 2006, but not in
the HCV group. After a sharp decrease between 1999 and 2002,
drug-related mortality rates in the HCV group have been stable.
Conclusions: Improvements in HBV treatment and uptake have
most likely reduced non-HCC liver-related mortality. Encouragingly, HCV drug-related mortality remained low compared to
pre-2002 levels, likely due to changes in opiate supply, and maintenance or improvement in harm reduction strategies.
Keywords: Hepatitis B; Hepatitis C; Linkage; Mortality; Australia.
Received 1 June 2010; received in revised form 30 July 2010; accepted 19 August
2010; available 23 October 2010
⇑Corresponding author. Address: National Centre in HIV Epidemiology and
Clinical Research, The University of New South Wales, Ground floor, CFI building,
Cnr. Boundary and West Streets, Darlinghurst, NSW 2010, Sydney, Australia. Tel.:
+61 2 9385 0900; fax: +61 2 9385 0920.
E-mail address: gdore@nchecr.unsw.edu.au (G.J. Dore).
Abbreviations: HBV, hepatitis B virus; HCV, hepatitis C virus; HCC, hepatocellular
carcinoma; NSW, New South Wales; NDD, Notifiable Diseases Database; RBDM,
Registry of Births, Deaths, and Marriages; ABS, Australian Bureau of Statistics;
ICD, International Classification of Diseases; NHD, National HIV Database; NAR,
National AIDS Registry; NCHECR, National Centre in HIV Epidemiology and Clinical Research; SMR, standardised mortality ratio; NSPs, Needle and Syringe
Programs.
Ó 2010 European Association for the Study of the Liver. Published
by Elsevier B.V. All rights reserved.
Introduction
An estimated 500 million people worldwide have chronic infection with hepatitis B virus (HBV) or hepatitis C virus (HCV) [1].
Both infections are associated with progressive hepatic fibrosis,
cirrhosis, and subsequent complications including hepatocellular
carcinoma (HCC) [2–3]. The extent of liver disease and the risk of
liver disease-related complications in chronic HBV and HCV have
been outlined in many clinic-based cross-sectional and prospective cohort studies [4–8]. Few, however, have examined the
excess morbidity and mortality attributed to chronic HBV [9–
10] or chronic HCV [9–11] at a population-level compared to
background uninfected populations.
New South Wales (NSW), the most populous state in Australia, is currently estimated to have 7.1 million residents, making
up about 32% of the country’s population [12]. In a previous population-based study we found a 40% increased mortality risk for
chronic HBV and 3-fold increased mortality risk for chronic
HCV [9]. The excess HCV-related mortality was largely explained
by the high rate of drug-related deaths, which outnumbered
those related to liver disease.
Since 2002, there have been major advances in antiviral therapy for chronic HBV and chronic HCV supported by strategies to
enhance treatment uptake in Australia [13]. Other temporal
trends over the last decade in Australia have included a decline
in the number of injecting drug users resulting in declining
HCV incidence [14–15], which may have produced an ageing
cohort of people with chronic HCV [16]. People with chronic
HBV or HCV have increased liver disease progression if they are
co-infected with both viruses, or co-infected with HIV [2,17];
however, there is limited information at the population-level
on the impact of co-infection on overall and disease specific
mortality.
In this study we extended our previous population-level data
linkage study to examine ongoing trends in HBV- and HCV-related
mortality including the impact of co-infection. The mandatory
notification of HBV, HCV, and HIV in Australia, together with estimated high proportions of infected populations being diagnosed
Journal of Hepatology 2011 vol. 54 j 879–886
Research Article
makes Australia an ideal setting to conduct population-level studies of mortality risk [18–20].
Methods
Data sources
The study group of interest consisted of all people recorded in the NSW Notifiable
Diseases Database (NDD) with either HBV or HCV between 1 January 1992 and 31
December 2006. Since 1991, state government legislation has mandated that all
incident cases of HBV and HCV be reported to the NSW Department of Health
(NSW Public Health Act 1991). A notifiable HBV case requires detection of HBV
surface antigen or HBV DNA, while a notifiable HCV case requires detection of
anti-HCV antibody or HCV RNA. Personal identifiers were first recorded in the
NDD in 1992.
The NSW Registry of Births, Deaths, and Marriages (RBDM) records the date of
death for all deaths occurring in NSW. The RBDM supplies the Australian Bureau
of Statistics (ABS) with the Medical Certificate of Cause of Death for coding of the
underlying cause of death according to the International Classification of Diseases
(ICD) [21].
In Australia, HIV is notifiable by the diagnosing laboratory and AIDS is notifiable by physicians. Information about HIV and AIDS is recorded in the National
HIV Database (NHD) and National AIDS Registry (NAR) respectively, both of which
are maintained by the National Centre in HIV Epidemiology and Clinical Research
(NCHECR). Reporting of HIV has been mandatory in NSW since 1985 and has been
nationally administered since 1989 [22]. HIV and AIDS data sources use a four letter name code made up of the first two letters of the first and last name. Both data
sources also record sex and date of birth information.
Linkage
Data linkage occurred in two stages. In the first stage, HBV and HCV notifications
in the NDD were matched internally to allow identification of cases co-infected
with HBV and HCV. All notifications were then matched to RBDM death records.
In these steps, linkage was done probabilistically using full name, sex, date of
birth and address by means of ChoiceMaker software [23]. ABS cause of death
records were linked deterministically to RBDM death records. In the second stage,
data were matched deterministically to notifications from the NHD and the NAR
using name code, sex, and date of birth. All linkage was performed by the NSW
Centre for Health Record Linkage [24].
Table 1. Characteristics of people diagnosed with viral hepatitis in New South Wales: 1992–2006.
Viral hepatitis notification
Hepatitis B virus
n = 42,480
Hepatitis C virus
n = 82,034
Hepatitis B and HIV
Hepatitis B and C
co-infection n = 3,285 co-infection n = 269
Hepatitis C and HIV
co-infection n = 620
Year of viral hepatitis diagnosis, median (IQR)
1999 (1995-2002) 1999 (1995-2001)
2000 (1996-2002)
1997 (1994-2002)
1999 (1995-2002)
Age at viral hepatitis diagnosis (years), median (IQR)
35.1 (26.9-44.5)
34.5 (27.6-41.6)
35.6 (28.8-42.7)
36.2 (30.0-44.2)
35.8 (30.0-41.5)
Males [n], (%)
22,766 (54%)
51,458 (63%)
2,365 (72%)
254 (94%)
558 (90%)
Data missing [n], (%)
441 (1%)
390 (<1%)
19 (1%)
0
1 (<1%)
Linked deaths [n], (%)
1181 (3%)
4626 (6%)
236 (7%)
63 (23%)
95 (15%)
Follow-up time (years), median (IQR)
7.8 (4.6-11.5)
7.6 (4.7-10.9)
6.6 (4.4-9.7)
6.3 (2.7-10.5)
6.1 (3.2-9.5)
Table 2. Causes of death by ICD-10 chapter heading among people diagnosed with HBV or HCV mono-infection in New South Wales: 1992–2006.
Viral hepatitis notification
Description
Hepatitis B virus
1
Hepatitis C virus
SMR
95% CI
Observed deaths
Rate1
SMR
95% CI
All cause
1181
37.6
1.1
1.0-1.2
4626
78.4
2.6
2.6-2.7
A00-B99
Infections
126
4.0
6.2
5.2-7.4
416
7.0
10.8
9.8-11.8
C00-D48
Neoplasms
521
16.6
1.4
1.3-1.6
866
14.7
1.7
1.6-1.8
D50-D89
Blood/Immune
6
0.2
1.6
0.7-3.6
24
0.4
3.8
2.5-5.7
E00-E90
Endocrine
43
1.4
1.4
1.1-1.9
108
1.8
2.2
1.9-2.7
F00-F99
Mental and behavioural
19
0.6
0.7
0.5-1.2
581
9.8
11.2
10.3-12.2
G00-G99
Nervous system
17
0.5
0.5
0.3-0.9
58
1.0
1.1
0.9-1.4
I00-I99
Circulatory system
225
7.2
0.7
0.6-0.8
710
12.0
1.3
1.2-1.4
J00-J99
Respiratory system
33
1.1
0.5
0.3-0.6
138
2.3
1.2
1.0-1.4
K00-K93
Digestive system
58
1.8
1.5
1.1-1.9
379
6.4
5.7
5.1-6.3
L00-L99
Skin
0
10
0.2
2.7
1.4-5.2
M00-M99
Musculoskeletal
5
0.2
0.9
0.4-2.2
19
0.3
2.1
1.4-3.4
N00-N99
Genitourinary
25
0.8
1.6
1.0-2.3
80
1.4
3.0
2.4-3.7
O00-Q99
Pregnancy/perinatal/congenital
6
0.2
1.3
0.6-3.0
15
0.3
1.7
1.0-2.9
R00-R99
Other
6
0.2
0.9
0.4-2.0
41
0.7
3.0
2.2-4.0
V00-Y98
External
91
2.9
0.7
0.6-0.9
1181
20.0
4.5
4.2-4.8
Observed deaths Rate
1
Rate per 10,000 person-years. SMR standardised mortality ratio.
880
Journal of Hepatology 2011 vol. 54 j 879–886
JOURNAL OF HEPATOLOGY
Table 3. Causes of death related to viral hepatitis, HIV infection and drug use among people diagnosed with HBV or HCV mono-infection in New South Wales: 1992–
2006.
Description
Sex
Viral hepatitis notification
Hepatitis B virus
Observed deaths Rate1
B94.2
C22.0
K70
K71-K77
B20-B24
SMR
95% CI
10.0
9.0-11.1
943
16.0
15.8
14.8-16.8
Men
294
17.9
10.6
9.5-11.9
665
18.2
13.7
12.7-14.8
Women
59
4.0
7.8
6.0-10.1
274
12.4
24.6
21.8-27.6
50
1.6
32.2
24.3-42.6
153
2.6
49.1
41.9-57.5
Men
41
2.5
33.3
24.5-45.2
100
2.7
37.4
30.7-45.5
Women
8
0.6
27.7
13.9-55.4
53
2.4
119.6
91.4-156.6
43
1.4
21.4
15.8-28.9
204
3.5
47.2
41.2-45.2
Men
36
2.2
22.4
16.2-31.1
137
3.8
36.9
31.2-43.6
Women
6
0.4
16.6
7.5-36.9
66
3.0
113.4
89.1-144.4
199
6.3
34.9
30.4-40.2
238
4.0
26.3
23.1-29.8
Men
164
10.0
34.0
29.2-39.6
170
4.7
21.7
18.6-25.2
Women
32
2.2
40.6
28.7-57.5
67
3.0
57.3
45.1-72.8
19
0.6
1.4
0.9-2.3
169
2.9
7.5
6.4-8.7
Men
-
1.0
1.5
0.9-2.5
128
3.5
6.7
5.7-8.0
Women
-
0.2
1.2
0.4-3.8
41
1.8
11.1
8.1-15.0
19
0.6
2.2
1.4-3.5
154
2.6
10.8
9.2-12.6
Men
12
0.7
1.8
1.0-3.2
109
3.0
9.9
8.2-12.0
Women
7
0.5
3.4
1.6-7.1
43
1.9
13.8
10.2-18.5
5
0.2
0.9
0.4-2.2
17
0.3
1.3
0.8-2.1
Men
-
0.2
0.8
0.3-2.1
17
0.5
1.3
0.8-2.1
Women
-
0.1
4.3
0.6-30.4
0
Viral hepatitis
Sequelae of viral hepatitis3
4
HCC
Alcoholic liver disease
Non-alcoholic liver disease
HIV5
Observed deaths
Rate1
11.4
49
1.6
1.4
1.1-1.9
90
1.5
1.7
1.4-2.1
Men
32
2.0
1.4
1.0-2.0
61
1.7
1.7
1.4-2.2
Women
17
1.2
1.5
1.0-2.5
29
1.3
1.7
1.2-2.5
24
0.8
0.7
0.5-1.1
1150
19.5
15.4
14.5-16.3
Men
-
1.2
0.8
0.5-1.3
870
23.8
14.2
13.3-15.2
Women
-
0.3
0.5
0.2-1.3
270
12.2
20.9
18.6-23.6
C81-C96 Lymphoid
ABS
95% CI
358
All liver-related2
B15-B19
Hepatitis C virus
SMR
6
Drug-related
1
Rate per 10,000 person-years. 2Consists of viral hepatitis, sequelae of viral hepatitis, HCC, alcoholic and non-alcoholic liver disease, and non-HCC liver cancer. 3Not coded
prior to 1st Jan 1997 in this cohort. 4Code included all primary liver cancer. prior to 1st Jan 1997. 5Refers to those who do not appear on the NAR or NHD. 6As defined by the
Australian Bureau of Statistics [21]. Counts less than five have been suppressed. SMR standardised mortality ratio.
Statistical methods
Where a person had multiple records for the same infection the earliest diagnosis
date was used. Among co-infected people, the date of diagnosis was defined by
the later infection. Due to the potential for higher rates of diagnosis among those
with significant morbidity, people who died within six months of the date of hepatitis diagnosis were excluded. Consistent with this exclusion, all other people
remaining in the study group had their time at risk shortened by six months.
Causes of death in the ABS mortality data were defined using ICD-9 codes for
deaths occurring prior to 1 January 1997, and thereafter ICD-10 codes were used.
Drug-related deaths were defined according to methods set out by the ABS [21].
This refers to deaths involving dependence disorders due to psychoactive substances, as well as abuse of non-dependence producing substances, the ICD-10
codes for which belong to the mental and behavioural disorders chapter. Drugrelated deaths also include poisoning or overdose by exposure to legal or illegal
drugs, the codes for which belong to the external-causes chapter. Death rates
after hepatitis diagnosis were estimated using person time methodology. Person
time at risk was defined as the time from six months after the date of diagnosis
until either the date of death or until December 31st, 2006, if there was no death
record. Death rates in the study population were compared to rates in the NSW
population for each cause of death using standardised mortality ratios (SMRs).
SMRs were adjusted for sex, 5-year-age-group, and calendar year, with the latter
two treated as time dependent covariates. Confidence intervals (CIs) for SMRs
were calculated assuming a Poisson distribution. Tests for differences between
rates and SMRs were performed using Poisson regression.
Trends in rates were examined between 1997 and 2006 as small counts
prior to 1997 meant rates were unstable. While the change in the cause of
death coding systems from ICD-9 to ICD-10 on January 1, 1997 had minimal
impact on classifying conditions of interest in this study, it provided a further reason for looking at trends from 1997 onwards. Poisson regression was
used to test for trends in rates, with a p-value less than 0.05 considered
significant.
Ethics approval for the study was granted by the University of NSW Human
Research Ethics Committee and the NSW Population & Health Services Research
Ethics Committee.
Results
The final study cohort consisted of 128,726 people who had a
HBV or HCV notification between 1992 and 2006. Within the
cohort, 42,480 (33.0%) people had HBV mono-infection, 82,034
(63.7%) had HCV mono-infection and 3285 (2.6%) were coinfected with both HBV and HCV (Table 1). Two hundred and
sixty-nine (0.2%) and 620 (0.5%) people were co-infected with
HBV/HIV and HCV/HIV, respectively. There were 38 (<0.1%) people co-infected with HBV, HCV, and HIV. Approximately 90% of
those with HIV co-infection and 72% of HBV/HCV co-infected
Journal of Hepatology 2011 vol. 54 j 879–886
881
Research Article
Table 4. Causes of death among people with HBV/HCV, HBV/HIV or HCV/HIV co-infection in New South Wales: 1992–2006.
Description
Sex
Viral hepatitis notification
Hepatitis B and HIV2 co-infection
Hepatitis B and C co-infection
Observed Rate1
deaths
95% CI
Observed
deaths
Rate1
SMR
95% CI
Observed Rate1
deaths
SMR
95% CI
All cause
236
111.1
4.0
3.5-4.6
63
378.6
14.5
11.3-18.5
95
255.0
13.1
10.7-16.0
All liver-related
69
32.5
28.8
6.4-15.2
5
30.1
21.4
8.9-51.4
7
18.8
16.2
7.7-34.0
Men
58
37.6
27.2
21.0-35.2
5
31.5
21.7
9.0-52.1
-
18.0
14.3
6.4-31.9
Women
11
19.5
41.6
23.1-75.2
0
-
26.1
77.8
11.0-552.4
8
3.8
14.5
7.2-29.0
0
0
Men
-
4.5
14.6
6.9-30.6
Women
-
1.8
13.9
2.0-98.6
-
1.4
5.7
1.8-17.7
44
264.4
690.1
513.6-927.4
58
155.7
449.8 347.7-581.8
Men
-
1.3
3.9
1.0-15.4
-
258.1
664.5
474.5-875.2
52
155.6
405.3 308.9-531.9
Women
-
1.8
115.2 16.2-817.9
-
398.5
22,292 7,189.8-69,119.0
6
156.4
9,231 4,146.9-20,545.9
66
31.1
23.2
18.2-29.5
-
12.0
7.2
1.8-28.9
10
26.8
17.0
9.1-21.5
Men
58
37.6
23.0
17.8-29.7
-
12.6
7.3
1.8-29.3
-
26.9
15.9
8.3-30.6
Women
8
14.2
24.9
12.5-48.8
0
-
26.1
42.9
6.0-304.3
K71-K77 N-a* liver-disease
B20-B24 HIV
ABS
SMR
Hepatitis C and HIV2 co-infection
Drug-related3
1
Rate per 10,000 person-years. 2Refers to those who appear on the NAR or NHD. 3As defined by the Australian Bureau of Statistics [21]. Counts less than five have been
suppressed. SMR standardised mortality ratio.
⁄
N-a Non -alcoholic
Table 5. Age-specific liver- and drug-related mortality rates among people with HBV and HCV mono-infection in New South Wales: 1992–2006.
Age
Hepatitis B virus
1
Hepatitis C virus
Drug-related
Liver-related
1
Drug-related
Liver-related
1
Rate1
N
Rate
95% CI
N
Rate
95% CI
N
Rate
95% CI
N
≤14
-
2.7
0.4-19.0
-
2.7
0.4-19.0
-
4.5
1.1-18.2
0
0
-
95% CI
15-19
0
-
-
-
3.7
1.2-11.5
0
-
-
8
17.3
8.6-34.5
20-24
0
-
-
-
1.4
0.5-4.4
-
0.3
-
77
25.5
20.4-31.9
25-29
5
1.5
0.6-3.6
-
0.3
0.0-2.1
-
0.6
0.2-1.7
153
23.9
20.4-28.0
30-34
6
1.4
0.6-3.1
5
1.1
0.5-2.8
16
1.7
1.0-2.8
253
27.1
23.9-30.6
35-39
14
2.9
1.7-4.8
-
0.6
0.2-1.9
59
5.2
4.0-6.7
258
22.5
20.0-25.5
40-44
32
6.8
4.8-9.6
-
0.8
0.3-2.3
127
11.2
9.4-13.4
240
21.2
18.7-24.1
45-49
35
9.3
6.7-13.0
-
0.8
0.3-2.5
178
21.9
18.9-25.3
111
13.6
11.3-16.4
50-54
32
12.3
8.7-17.4
-
0.4
0.1-2.7
130
34.1
28.7-40.5
38
10.0
7.3-13.7
55-59
49
29.8
22.5-39.5
0
-
-
56
37.6
29.0-48.9
7
4.7
2.2-9.9
60-64
45
43.9
32.8-58.8
0
-
-
66
78.3
61.5-99.6
-
4.7
1.8-12.6
65-69
50
68.7
52.0-90.6
0
-
-
62
86.1
67.1-110.4
-
1.4
0.2-9.9
70-74
28
55.2
38.1-79.9
0
-
-
101
154.8
127.4-188.1
0
-
-
75-79
29
95.8
66.6-137.8
0
-
-
86
171.6
138.9-211.9
0
-
-
80-84
26
188.9
128.6-277.5
0
-
-
34
124.2
88.8-173.8
0
-
-
85+
6
70.5
31.7-156.8
0
-
-
21
125.5
81.8-192.5
0
-
-
1
Rate per 10,000 person-years. Counts less than five have been suppressed.
people were males. A total of 6201 people died, with the proportion of deaths ranging from 3% among the HBV mono-infected
group to 23% among HBV/HIV co-infected group (Table 1). A total
of 1367 people died within six months of diagnosis and were
excluded from the analysis.
Among those with HBV mono-infection, the leading cause of
death was neoplasms (Table 2), the most frequent of which was
HCC (38%) followed by lung cancer (12%) and lymphoid cancer
(9%). The greatest excess mortality risk was for infections (SMR
882
6.2, 95% CI 5.2–7.4), with the underlying cause for most of these
being coded as viral hepatitis (61%). For HCV mono-infected people, however, the leading cause of death was external causes; 72%
of which were due to either drug overdose or suicide. Mental and
behavioural disorders had the greatest excess rate of death
among those with HCV (SMR 11.2, 95% CI 10.3–12.2). In 87% of
these cases, drug dependence disorders were recorded as the
underlying cause of death although many had overdose recorded
as an additional cause. Both the rates and SMRs of all causes of
Journal of Hepatology 2011 vol. 54 j 879–886
JOURNAL OF HEPATOLOGY
12
A
Hepatitis B virus
HCC-related
Non-HCC-related
9
6
3
Rate per 10,000 person/years
Rate per 10,000 person/years
A
250
Hepatitis B virus
<1920
200
1920-29
1930-39
150
1940-49
1950-59
100
1960-69
50
0
0
0-29
1997 1998 1999 2000 2001 2002 2003 2004 2005 2006
30-39
40-49
B
Hepatitis C virus
10
HCC-related
Non-HCC-related
5
Rate per 10,000 person/years
Rate per 10,000 person/years
B 15
50-59
60-69
70-79
80+
70-79
80+
Age Group
Year
250
Hepatitis C virus
<1920
200
1920-29
1930-39
150
1940-49
1950-59
100
1960-69
50
0
0
0-29
1997 1998 1999 2000 2001 2002 2003 2004 2005 2006
30-39
40-49
50-59
60-69
Age Group
Year
mortality were significantly higher among the HCV group compared to the HBV group (78.4 vs. 37.6/10,000 person-years,
p <0.001; SMR 2.6 vs. 1.1, p <0.001). Across all ICD chapters, both
rates and SMRs were higher among the HCV group compared to
the HBV group, with the exception of neoplasms where HBV
infected people had significantly higher rates (16.6 vs. 14.7/
10,000 person-years, p = 0.03).
In general, the highest SMRs were for hepatitis-related deaths
and liver cancer, in particular HCC (Table 3). HCC accounted for
88% and 91% of liver cancer deaths and 56% and 25% of all
liver-related deaths for HBV and HCV groups, respectively. Overall rates and SMRs for HCC were significantly higher among HBV
infected people than HCV infected people (6.3 vs. 4.0/per 10,000
person-years, p <0.001; SMR 34.9 vs. 26.3, p = 0.003). For nonalcoholic liver disease, the opposite relationship was observed
(0.6 vs. 2.9/10,000 person-years, p <0.001; SMR 2.2 vs. 10.8,
p <0.001).
For both HBV and HCV infected people, rates of mortality due
to liver, drug, and lymphoid-related causes were higher for men
than women (Table 3). For HCV infected people, SMRs were
higher among females for drug-related deaths and all sub-categories of liver-related deaths, significantly so for all liver-related
deaths combined (p <0.001).
Among people co-infected with HBV and HCV, both the rate
and SMR for all causes of mortality were considerably higher than
mono-infected groups (111.1/10,000 person-years, SMR 4.0)
(Table 4). Among those with HBV, co-infection with HIV
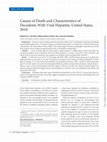
Fig. 2. Liver-related mortality rates by age group and birth cohort, (A)
hepatitis B virus and (B) hepatitis C virus.
50
Rate per 10,000 person/years
Fig. 1. Liver-related mortality rates by year of hepatitis diagnosis, (A)
hepatitis B virus and (B) hepatitis C virus.
Hepatitis C virus
All liver
40
Drug
30
20
10
0
1997 1998 1999 2000 2001 2002 2003 2004 2005 2006
Year
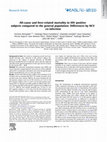
Fig. 3. All-liver- and drug-related mortality rates among HCV mono-infected
people by year of hepatitis diagnosis.
increased mortality rates by 10 times (378.6 vs. 37.6/10,000 person-years), while among those with HCV, HIV co-infected people
were at least three times more likely to die (255.0 vs. 78.4/10,000
person-years). By far the highest rates and SMRs for all causes of
mortality were among the HBV/HCV/HIV co-infected group
(586.2/10,000 person-years; SMR 24.2, 95%CI 14.3–40.9). The
majority of deaths among HBV/HIV and HCV/HIV co-infected
groups were HIV-related; 70% and 61%, respectively.
Journal of Hepatology 2011 vol. 54 j 879–886
883
Research Article
50
<1950
Hepatitis C virus
1950-59
1960-69
Rate per 100,000
40
1970-79
1980+
30
20
10
0
0-19
20-24 25-29 30-34 35-39 40-44 45-49 50-54
55+
Age Group
Fig. 4. Drug-related mortality rates by age group and birth cohort among HCV
mono-infected people.
Age-specific rates of liver-related deaths increased considerably with increasing age from 30 years onwards for both HBV
and HCV mono-infected groups (Table 5). The rates peaked in
the 80- to 84-year-old group among HBV mono-infected people
and in the 75- to 79-year-old group for HCV mono-infected people. However, due to relatively low numbers of notified prevalent
HBV and HCV cases in these older age groups, the crude number
of liver-related deaths was highest in the 65- to 69-year-old
group for HBV (n = 50) and in the 45- to 49-year-old group for
HCV (n = 178). Compared to liver-related deaths, rates of drugrelated deaths tended to be elevated among relatively younger
ages for both infection groups. The number of age-specific
drug-related deaths among HBV mono-infected people was
small, while in the HCV mono-infected group counts and rates
were elevated from the late teens into the early 40s, after which
time they decreased steadily.
Rates of HCC-related death showed no clear evidence of
change over time for either HBV or HCV mono-infected groups
(p = 0.23 for both; Fig. 1). Rates of non-HCC liver deaths in the
HBV group decreased by a mean of 5% per year (rate ratio [RR]
0.95, 95% CI 0.89–1.01, p = 0.09), compared to no change in the
HCV group (RR 1.00, 95%CI 0.97–1.03, p = 0.84). Overall rates of
liver-related deaths decreased by a mean of 4% per year in the
HBV group (RR 0.96, 95% CI 0.92–1.00, p = 0.04), while no change
was observed in the HCV group (RR 1.01, 95% CI 0.98–1.03,
p = 0.44). In Fig. 2A, for each age group, there is a clear decrease
in liver-related mortality rates with younger cohorts. A similar
effect can be seen in Fig. 2B for the HCV group for those aged
under 70; however, the differences between rates for successive
cohorts is smaller relative to the HBV group.
Among the HCV group, rates of drug-related mortality in 2002
were approximately half those seen prior to 2000 and rates have
remained low since 2002 (Fig. 3). In the 5-year period 2002–2006
rates of drug-related mortality in the HCV group were significantly lower than in 1997–2001 (p <0.001). Fig. 4 shows no consistent trend in drug-related mortality rates across age groups or
birth cohorts.
Discussion
Our study outlines the burden of mortality related to HBV and
HCV, including important trends in cause-specific mortality in
884
recent years, among notified cases in NSW. Age- and sex-standardised mortality was marginally elevated among those with
HBV mono-infection while around two and half times higher
for those with HCV mono-infection compared to the NSW population. Among those with a co-infection, the risk was between
four and 24 times higher, with those who were co-infected with
HIV having a markedly higher risk than other infection groups.
Liver conditions, in particular HCC, were a major cause of mortality among HBV infected people. For HCV infected people the leading cause of death was drug-related although liver-related deaths
were almost as many in number. High rates of liver-related death
were associated with older age, while among HCV infected people, rates of drug-related death were higher in the 15- to 50year-age-group. Mortality rates tended to be higher for males,
particularly among the HBV group. Drug-related mortality among
people with HCV mono-infection declined markedly between
1999 and 2002 and since then it has been lower than liver-related
mortality. Contrasting temporal trends in non-HCC liver-related
mortality were found with a stable rate among people with
HCV mono-infection and a lower and declining rate among those
with HBV mono-infection. Rates of HCC-related mortality have
remained approximately stable for both HBV and HCV, although
at higher levels for HBV. Age-specific rates of liver-related death
declined with younger HBV cohorts; however, for HCV cohorts
such a decline was less pronounced.
These findings build on those from a previous NSW linkage
study [9] in providing additional data on both the impact of
HIV co-infection and temporal mortality trends in an era of
improving HBV and HCV antiviral therapy, and changing opiate
markets. Rates of drug-related deaths decreased considerably
between 1999 and 2002, that was thought to be due largely to
the Australian heroin shortage in which both supply and purity
decreased while the price increased markedly in late 2000 and
early 2001 [25–26]. This decrease was of sufficient magnitude
to overshadow cohort effects. While a previous linkage study also
observed this decrease [9], our study found that rather than
return to pre-2001 levels, rates of drug-related deaths have
remained low in 2002 to 2006. Although the heroin market stabilised after the shortage, the supply, price and purity had not
returned to pre-2001 levels as of 2005 [25]. Wider reaching interventions such as the Needle and Syringe Programs (NSPs) and
harm reduction campaigns delivered through the NSPs may also
have contributed to the maintenance of improved drug-related
mortality since 2001 among those infected with HCV [27]. There
is also evidence that the shift in the illicit drug market caused
many injecting drug users to change to injecting non-opioid
drugs which are less likely to result in a fatal overdose [26,28–
30].
The moderate decline in non-HCC liver disease mortality
among people with HBV mono-infection and the decline in agespecific rates of liver-related death with younger cohorts suggest
that improved HBV antiviral therapy may have reduced the risk
of death from decompensated cirrhosis. HCC was a major contributor to liver-related deaths; however, there was no significant
evidence for declining rates of HCC-related deaths for either
mono-infected group. During the study period, antiviral therapy
licensed for treatment of chronic HBV infection in Australia has
been lamivudine (1998), adefovir (2004) and entacavir (2006)
[31]. Pegylated interferon alfa-2a was only licensed in 2006,
and has had limited uptake [31]. Although lamivudine has been
shown to reduce liver-related mortality in chronic HBV infection,
Journal of Hepatology 2011 vol. 54 j 879–886
JOURNAL OF HEPATOLOGY
subsequently available antiviral therapy has a higher genetic barrier to resistance and generally leads to maintenance of HBV DNA
suppression [32–34]. Despite a relatively low HBV antiviral therapy uptake in Australia (an estimated 5% of all chronic infection
cases are currently on therapy) [31], this level has increased in
more recent years, and the capacity of current therapy to prevent
disease progression from advanced liver disease or even reverse
decompensated cirrhosis [35–37] means that even low levels of
uptake may reduce liver-related deaths.
In contrast to HBV treatments, antiviral therapy for chronic
HCV infection has both low uptake in Australia (1–2% of chronic
infection cases treated per year) [15], and is unable to be utilised
in people with decompensated cirrhosis [38–39]. We believe that
these factors may explain the non-decrease in both HCC and nonHCC-related mortality rates among those infected with HCV.
The contrasting trends in non-HCC liver-related mortality in
our study are consistent with findings from a recent linkage study
examining hospitalisations in New South Wales [40], which
found a significant decrease in hospitalisation rates for non-alcoholic liver disease between 2000 and 2006 for both HBV and HCV
infected people. The more striking trends in hospitalisation data
are potentially explained by the relatively recent advances in
antiviral treatment and uptake having impacted hospitalisation
rates more immediately than mortality rates.
The stable individual risk of HCC in the setting of expanding
populations of both chronic HBV infection [41] and chronic
HCV infection [15] is the major factor contributing to the escalating incidence and mortality from HCC in NSW and Australia [42].
Similar trends in HCC mortality have been seen in several other
countries, including Taiwan, Canada and the USA [43–45]. The
relatively late introduction of universal infant HBV vaccination
programs in regional endemic HBV countries such as China and
Vietnam (two of the largest immigration sources for Australia),
and the long latency of HBV-related HCC means that the programs are thought to have little or no impact on immigrationrelated HCC in Australia [46]. Also, antiviral treatment does not
completely remove the risk of developing HCC especially in
patients with advanced fibrosis [47–48].
There are several limitations in our study that should be considered. Since no state or national registries exist that collect
treatment information, our hypotheses regarding the potentially
greater impact of HBV antiviral therapy on liver disease mortality
need to be confirmed in other population-based studies examining both mortality and treatment uptake over time. A further limitation is that our study is based on diagnosed and subsequently
notified cases. As all diagnosed cases of HBV, HCV, HIV, and AIDS
are required by law to be notified, the NDD, NHD, and NAR are
very close to complete in terms of diagnosed cases that are notified. It has also been estimated that about 70% of all prevalent
HCV infections [19] and 60% of all HBV infections [20] are diagnosed/notified and these estimated high levels of diagnosis
should have provided enhanced coverage.
While HBV notifications are largely based on evidence of
chronic infection, HCV notifications are largely based on the presence of anti-HCV antibodies. Thus, a considerable minority of
HCV notifications will not have chronic HCV infection, as an estimated 25% of infections spontaneously clear [49] and remain
HCV antibody positive. Less than 2% of NDD records explicitly
identified an acute case for either HBV or HCV, while more than
65% of records did not specify whether a case was acute or
chronic. For this reason it was not possible to reliably separate
acute or chronic cases, hence all the records were included. These
limitations are likely to have produced an underestimate of liver
disease mortality among people with chronic HCV infection,
although this should not have impacted on trends as the surveillance definition has not changed during the study period. This
underestimation may contribute to the difference in rates of
HCC-related deaths between HBV and HCV mono-infected groups
in this study.
Information on country of birth was not available for the vast
majority of notified HBV and HCV cases and therefore was not
included in the analyses. It is likely that there are higher proportions of immigrants from HBV endemic countries among the HBV
group in comparison to the NSW population [46], while the HCV
group is likely to have higher proportions of Australian born people [15]. Being unable to adjust for this, some bias may have been
introduced when calculating SMRs, due to differences in hepatitis-related mortality between various countries of origin.
There were 71 HIV notifications and 29 AIDS notifications that
matched to more than one NDD notification and so it was not
possible to identify which NDD individuals were true matches
with the NHD or NAR. Hence the number of people in the cohort
co-infected with HIV was underestimated. Approximately 16% of
all liver-related deaths were categorised as being due to viral
hepatitis; however, deaths related directly to HBV or HCV infection tend to occur from complications of cirrhosis, such as hepatic
failure or HCC. Among the cases where viral hepatitis was
recorded as the underlying cause of death, many had one of the
aforementioned complications listed as an additional cause.
However, due to the order in which causes were recorded as well
as the absence of additional causes for many cases, it was not
possible to further refine the viral hepatitis category.
This study identified a positive trend in non-HCC liver-related
deaths among those infected with HBV, consistent with improvements in HBV treatment and uptake. There is still a need, however, for increased treatment uptake to reduce cases of
advanced liver disease and hence reduce the burden of HCC
and other liver-related deaths. Our results also show that changes
to opiate supply coinciding with maintenance or improvement in
harm reduction strategies have resulted in HCV drug-related
mortality remaining stable at well below pre-2002 levels.
Financial support
This paper was funded from the following sources: the Australian
Government Department of Health and Ageing; NSW Cancer
Council STREP Grant (SRP08-03). The views expressed in this
publication do not necessarily represent the position of the Australian Government. NCHECR is affiliated with the Faculty of
Medicine, University of New South Wales.
Conflict of interest
The authors who have taken part in this study declared that they
do not have anything to disclose regarding funding or conflict of
interest with respect to this manuscript.
Supplementary data
Supplementary data associated with this article can be found, in
the online version, at doi:10.1016/j.jhep.2010.08.035.
Journal of Hepatology 2011 vol. 54 j 879–886
885
Research Article
References
[1] Marcellin P. Hepatitis B and hepatitis C in 2009. Liver Int 2009;29:1–8.
[2] Thomas DL, Seeff LB. Natural History of Hepatitis C. Clin Liver Dis 2005;9:
383–398.
[3] McMahon BJ. The Natural History of Chronic Hepatitis B Virus Infection.
Hepatology 2009;49:S45–S55.
[4] Yu MW, Hsu FC, Sheen IS, Chu CM, Lin DY, Chen CJ, et al.
Prospective study of hepatocellular carcinoma and liver cirrhosis in
asymptomatic chronic hepatitis B virus carriers. Am J Epidemiol
1997;145:1039–1047.
[5] Thein H-H, Qilong Y, Dore GJ, Krahn MD. Estimation of stage-specific fibrosis
progression rates in chronic hepatitis C virus infection: a meta-analysis and
meta-regression. Hepatology 2008;48:418–431.
[6] Dore GJ, Freeman AJ, Law M, Kaldor JM. Natural history models for hepatitis
C-related liver disease: different disease progression parameters for different
settings. Antivir Ther 2003;8:365–372.
[7] Freeman AJ, Dore GJ, Law MG, Thorpe M, Von Overbeck J, Lloyd AR, et al.
Estimating progression to cirrhosis in chronic hepatitis C virus infection.
Hepatology 2001;34:809–816.
[8] Liaw Y-F, Tai D-I, Chu C-M, Chen T-J. The development of cirrhosis in patients
with chronic type B hepatitis: a prospective study. Hepatology
1988;8:493–496.
[9] Amin J, Law MG, Bartlett M, Kaldor JM, Dore GJ. Causes of death after
diagnosis of hepatitis B or Hepatitis C infection: a large community-based
linkage study. Lancet. 2006;368:938–945.
[10] Duberg AS, Torner A, Davidsdottir L, Aleman S, Blaxhult A, Svensson A, et al.
Cause of death in individuals with chronic HBV and/or HCV infection, a
nationwide community-based register study. J Viral Hepatol 2008;15:
538–550.
[11] McDonald SA, Hutchinson SJ, Bird SM, Mills PR, Dillon J, Bloor M, et al. A
population-based record linkage study of mortality in hepatitis C-diagnosed
persons with or without HIV coinfection in Scotland. Stat Methods Med Res
2009;18:271–283.
[12] Australian Bureau of Statistics. Australian Demographic Statistics, September 2009. Cat. No. 3101.0. Canberra; 2009.
[13] Shamliyan TA, MacDonald R, Shaukat A, Taylor BC, Yuan JM, Johnson JR, et al.
Antiviral therapy for adults with chronic hepatitis B: a systematic review for
a National Institutes of Health Consensus Development Conference. Ann
Intern Med 2009;150:111–124.
[14] Razali K, Thein HH, Bell J, Cooper-Stanbury M, Dolan K, Dore G, et al.
Modelling the hepatitis C virus epidemic in Australia. Drug Alcohol Depend
2007;91:228–235.
[15] Gidding HF, Topp L, Middleton M, Robinson K, Hellard M, McCaughan G,
et al. The epidemiology of hepatitis C in Australia: notifications, treatment
uptake and liver transplantations, 1997–2006. Hepatology 2009;24:
1648–1654.
[16] National Centre in HIV Epidemiology and Clinical Research. Australian NSP
Survey National Data Report 2003–2007. Sydney: National Centre in HIV
Epidemiology and Clinical Research, The University of New South Wales;
2008.
[17] Lok AS, McMahon BJ. Chronic Hepatitis B. Hepatology 2007;45:507–539.
[18] O’Sullivan BG, Gidding HF, Law M, Kaldor JM, Gilbert GL, Dore GJ. Estimates
of chronic hepatitis B virus infection in Australia, 2000. Aust NZ J Public
Health 2004;28:212–216.
[19] Law MG, Dore GJ, Bath N, Thompson S, Crofts N, Dolan K, et al. Modelling
hepatitis C virus incidence, prevalence and long-term sequelae in Australia,
2001. Int J Epidemiol. 2003;32:717–724.
[20] Cowie B, Kelly H. Outcomes of a complex dynamic mathematical model of
hepatitis B virus in Australia (PP-027). In: 20th Conference of the Asian
Pacific Association for the Study of the Liver (APASL). Beijing: Hepatology
International; 2010.
[21] Australian Bureau of Statistics. Drug-induced Deaths – A Guide to ABS
Causes of Death Data. Cat. No. 4809.0.55.001. Australian Bureau of Statistics,
Canberra; 2002.
[22] McDonald AM, Crofts N, Blumer CE, Gertig DM, Patten JJ, Roberts M, et al.
The pattern of diagnosed HIV infection in Australia, 1984–1992. AIDS.
1994;8:513–519.
[23] ChoiceMaker Technologies, Inc. New York, NY 10010.
[24] The Centre for Health Record Linkage. Available from: www.cherel.org.au.
[25] Day C, Degenhardt L, Hall W. Documenting the heroin shortage in New
South Wales. Drug Alcohol Rev 2006;25:297–305.
886
[26] Degenhardt L, Day C, Dietze P, Pointer S, Conroy E, Collins L, et al. Effects of a
sustained heroin shortage in three Australian States. Addiction 2005;100:
908–920.
[27] Horyniak D, Higgs P, Lewis J, Winter R, Dietze P, Aitken C. An evaluation of a
heroin overdose prevention and education campaign. Drug Alcohol Rev
2010;29:5–11.
[28] Maher L, Li J, Jalaludin B, Wand H, Jayasuriya R, Dixon D, et al. Impact of a
reduction in heroin availability on patterns of drug use, risk behaviour and
incidence of hepatitis C virus infection in injecting drug users in New South
Wales, Australia. Drug Alcohol Depend 2007;89:244–250.
[29] Topp L, Day C, Degenhardt L. Changes in patterns of drug injection
concurrent with a sustained reduction in the availability of heroin in
Australia. Drug Alcohol Depend 2003;70:275–286.
[30] Gibson A, Day C, Degenhardt L. The impact of illicit drug market changes on
health agency operations in Sydney, Australia. J Subst Abuse Treat 2005;28:
35–40.
[31] National Centre in HIV Epidemiology and Clinical Research. HIV/AIDS, viral
hepatitis and sexually transmissible infections in Australia Annual Surveillance Report 2009. Sydney: National Centre in HIV Epidemiology and
Clinical Research, The University of New South Wales; 2009.
[32] Zhang FK. Lamivudine treatment of decompensated hepatitis B virus-related
cirrhosis. Hepatobiliary Pancreat Dis Int. 2006;5:10–15.
[33] Dienstag JL, Schiff ER, Wright TL, Perrillo RP, Hann HW, Goodman Z, et al.
Lamivudine as initial treatment for chronic hepatitis B in the United States.
N Engl J Med 1999;341:1256–1263.
[34] Liaw YF, Sung JJ, Chow WC, Farrell G, Lee CZ, Yuen H, et al. Lamivudine for
patients with chronic hepatitis B and advanced liver disease. N Engl J Med
2004;351:1521–1531.
[35] Lai CL. Therapeutic advances in chronic hepatitis B. J Gastroenterol Hepatol
2004;19:S5–S9.
[36] Leung N. Chronic hepatitis B – treatment with nucleoside analogues. Med J
Malaysia 2005;60:22–27.
[37] Takeda A, Jones J, Shepherd J, Davidson P, Price A. A systematic review and
economic evaluation of adefovir dipivoxil and pegylated interferon-alpha-2a
for the treatment of chronic hepatitis B. J Viral Hepatol 2007;14:75–88.
[38] Iacobellis A, Andriulli A. Antiviral therapy in compensated and decompensated cirrhotic patients with chronic HCV infection. Expert Opin Pharmacother 2009;10:1929–1938.
[39] Zavaglia C, Airoldi A, Pinzello G. Antiviral therapy of HBV- and HCV-induced
liver cirrhosis. J Clin Gastroenterol 2000;30:234–241.
[40] Gidding HF, Dore GJ, Amin J, Law MG. Trends in all cause and liver-related
hospitalizations in people with hepatitis B or C: a population-based linkage
study. BMC Public Health 2010; accepted for publication.
[41] Nguyen VT, Amin J, Law MG, Dore GJ. Predictors and survival in hepatitis Brelated hepatocellular carcinoma in New South Wales, Australia. J Gastroenterol Hepatol 2009;24:436–442.
[42] Amin J, O’Connell D, Bartlett M, Tracey E, Kaldor J, Law M, et al. Liver cancer
and hepatitis B and C in New South Wales, 1990–2002: a linkage study. Aust
N Z J Public Health 2007;31:475–482.
[43] ElSaadany S, Tepper M, Mao Y, Semenciw R, Giulivi A. An epidemiologic
study of hepatocellular carcinoma in Canada. Can J Public Health
2002;93:443–446.
[44] El-Serag HB. Hepatocellular carcinoma: recent trends in the United States.
Gastroenterology. 2004;127:S27–S34.
[45] Altekruse SF, McGlynn KA, Reichman ME. Hepatocellular carcinoma incidence, mortality, and survival trends in the United States from 1975 to 2005.
J Clin Oncol. 2009;27:1485–1491.
[46] Nguyen VT, Razali K, Amin J, Law MG, Dore GJ. Estimates and projections of
hepatitis B-related hepatocellular carcinoma in Australia among people born
in Asia-Pacific countries. J Gastroenterol Hepatol 2008;23:922–929.
[47] Sanefuji K, Kayashima H, Iguchi T, Sugimachi K, Yamashita Y, Yoshizumi T,
et al. Characterization of hepatocellular carcinoma developed after achieving
sustained virological response to interferon therapy for hepatitis C. J Surg
Oncol 2009;99:32–37.
[48] Kobayashi S, Takeda T, Enomoto M, Tamori A, Kawada N, Habu D, et al.
Development of hepatocellular carcinoma in patients with chronic hepatitis
C who had a sustained virological response to interferon therapy: a
multicenter, retrospective cohort study of 1124 patients. Liver Int
2007;27:186–191.
[49] Micallef JM, Kaldor JM, Dore GJ. Spontaneous viral clearance following acute
hepatitis C infection: a systematic review of longitudinal studies. J Viral
Hepatol 2006;13:34–41.
Journal of Hepatology 2011 vol. 54 j 879–886
Academia.edu no longer supports Internet Explorer.
To browse Academia.edu and the wider internet faster and more securely, please take a few seconds to upgrade your browser.
Trends in mortality after diagnosis of hepatitis B or C infection: 1992–2006
Journal of Hepatology, 2011
By Mel Krajden
...Read more
Related Papers
Journal of Viral Hepatitis, 2008
Download

BMC Public Health, 2011
Download
Epidemiology and Infection, 2001
Download
Clinical Infectious Diseases, 2014
Download
Annals of Internal Medicine, 2012
Download

Journal of Hepatology, 2012
Download


Download