(This is a sample cover image for this issue. The actual cover is not yet available at this time.)
This article appeared in a journal published by Elsevier. The attached
copy is furnished to the author for internal non-commercial research
and education use, including for instruction at the authors institution
and sharing with colleagues.
Other uses, including reproduction and distribution, or selling or
licensing copies, or posting to personal, institutional or third party
websites are prohibited.
In most cases authors are permitted to post their version of the
article (e.g. in Word or Tex form) to their personal website or
institutional repository. Authors requiring further information
regarding Elsevier’s archiving and manuscript policies are
encouraged to visit:
http://www.elsevier.com/copyright
Author's personal copy
Accident Analysis and Prevention 53 (2013) 127–132
Contents lists available at SciVerse ScienceDirect
Accident Analysis and Prevention
journal homepage: www.elsevier.com/locate/aap
The use of adaptation to reduce simulator sickness in driving assessment and
research
Joshua E. Domeyer a , Nicholas D. Cassavaugh a,b,∗ , Richard W. Backs a,b
a
b
Department of Psychology, Central Michigan University, Mt. Pleasant, MI 48859, United States
CMU Center for Driving Evaluation, Education and Research, Mt. Pleasant, MI 48859, United States
a r t i c l e
i n f o
Article history:
Received 4 March 2011
Received in revised form
27 November 2012
Accepted 31 December 2012
Keywords:
Simulator sickness
Motion sickness
Driving
Simulation
Older adults
a b s t r a c t
The technical advancement of driving simulators has decreased their cost and increased both their accuracy and fidelity. This makes them a useful tool for examining driving behavior in risky or unique
situations. With the approaching increase of older licensed drivers due to aging of the baby boomers,
driving simulators will be important for conducting driving research and evaluations for older adults.
With these simulator technologies, some people may experience significant effects of a unique form of
motion sickness, known as simulator sickness. These effects may be more pronounced in older adults. The
present study examined the feasibility of an intervention to attenuate symptoms of simulator sickness
in drivers participating in a study of a driving evaluation protocol. Prior to beginning the experiment, the
experimental groups did not differ in subjective simulator sickness scores as indicated by Revised Simulator Sickness Questionnaire scores (all p > 0.5). Participants who experienced a two-day delay between an
initial acclimation to the driving simulator and the driving session experienced fewer simulator sickness
symptoms as indicated by RSSQ total severity scores than participants who did not receive a two-day
delay (F(1,88) = 4.54, p = .036, partial 2 = .049). These findings have implications for improving client
well-being and potentially increasing acceptance of driving simulation for driving evaluations and for
driving safety research.
© 2013 Elsevier Ltd. All rights reserved.
1. Introduction
According to statistics from the Federal Highway Administration, from 1997 to 2010 there was a 28 percent increase in the
number of licensed drivers over the age of 65 years old. The increase
in older licensed drivers is of concern because these drivers may
eventually suffer from cognitive declines due to aging (Craik and
Salthouse, 2007) that may affect their driving performance. While
older drivers are not necessarily more likely than younger drivers
to be involved in a crash, they are more likely to be killed or injured
in such a crash. It is important to help older drivers avoid crashes
while helping them maintain the ability to drive safely.
This will necessitate research on and evaluation of older drivers
in a way that is safe and informative. One approach to this is to
use simulators because it is possible to standardize and quantify
evaluation procedures while in a safe environment. Unfortunately,
some people, notably older adults, experience simulator sickness
in simulators. In fact, the authors have noted considerable participant attrition rates in simulator-based experiments. Thus, making
∗ Corresponding author at: Department of Psychology, Central Michigan University, Mt. Pleasant, MI 48858, United States. Tel.: +1 989 774 2882.
E-mail addresses: Cassa1nd@cmich.edu, xunil2@gmail.com (N.D. Cassavaugh).
0001-4575/$ – see front matter © 2013 Elsevier Ltd. All rights reserved.
http://dx.doi.org/10.1016/j.aap.2012.12.039
driving simulators more accessible to older adults might be viewed
as advantageous for driving safety and accident prevention.
Simulator sickness has been described as a unique form of
motion sickness (Rizzo et al., 2003). Many studies and anecdotal
reports indicate that older adults suffer greater simulator sickness
symptoms than other groups (Stanney et al., 2002; Freund and
Green, 2006; Mullen et al., 2010). Indeed, in a study examining lefthand turning ability older adult attrition was 40 percent whereas
younger adult attrition was 14 percent (Edwards et al., 2004). These
data and the authors’ own observations suggest a need to attenuate
simulator sickness in order to make simulation available to more
drivers. It is therefore important to explore the phenomenon of
simulator sickness and attempt to understand interventions that
have utility for reducing it.
1.1. Simulator sickness
Simulator sickness is a phenomenon that is affected by simulator features and participant characteristics. It produces symptoms
that are similar to, but typically less severe than, those of motion
sickness such as nausea, ocular discomfort, and disorientation
(Kennedy et al., 1993).
In this regard, the sensory conflict theory of motion sickness
provides an important framework for understanding simulator
Author's personal copy
128
J.E. Domeyer et al. / Accident Analysis and Prevention 53 (2013) 127–132
sickness (Reason and Brand, 1975). The theory states that the
symptoms of motion sickness are a result of conflicting visual and
vestibular cues. In motion sickness, such as that experienced by
some while attempting to read in a moving vehicle, vestibular
motion cues are coupled with an absence of visual motion cues.
In contrast, in simulator sickness visual motion cues are coupled
with an absence of vestibular motion cues.
Not every individual experiences simulator sickness to the same
extent, even in identical situations. Reason’s (1978) neural mismatch model of sensory conflict theory states that susceptibility is a
product of an individual’s overall experience with motion sickness.
This would suggest that older adults would be less susceptible to
motion sickness than younger adults because they have more exposure to situations that would produce motion sickness.
In contrast, several studies have found that older participants
are more susceptible to simulator sickness than other age groups
(Edwards et al., 2004; Park et al., 2004; Brooks et al., 2010). This
may be due to a lack of experience with simulated environments
on the part of older adults. If this is indeed the case, then providing
some experience with the simulator prior to prolonged exposure in
research or clinical settings may improve tolerance. Providing longterm exposure to a clinical simulator is not a practical solution,
given the required costs and the need for the client to return for
many sessions.
One approach to reduce symptoms of simulator sickness is
the use of adaptation or time delay. Results from several studies
have shown decreased simulator sickness symptoms with repeated
exposure within and between days (Gower et al., 1987; Hu and
Stern, 1999; Hill and Howarth, 2000; Howarth and Hodder, 2008;
Teasdale et al., 2009). This reduction in simulator sickness symptoms due to time delay between simulator sessions has been
shown to persist up to a month or longer (Hu and Stern, 1999).
Howarth and Hodder (2008) found that simulator sickness symptoms decreased over 10 days of simulator exposure with a session
on each day. Teasdale et al. (2009) found that older adults’ (ages
65–84 years old) simulator sickness symptoms as measured by
a subjective questionnaire decreased over subsequent simulator
sessions. They found that older adults adapted to simulation over
several sessions. After the fifth session the older adults did not differ from the initial baseline condition on simulator sickness scores.
These results indicate that adaptation could be used to attenuate
simulator sickness symptoms. Therefore, the goal of the present
research was to determine whether a short-term exposure session
which preceded the clinical exposure session by two days would
improve tolerance.
1.2. Present study
For the present purposes, we will use the term acclimation for
the name of the first brief exposure to the simulator that was used
to allow the participants to adjust to the simulator. We will use
the term adaptation to mean an initial, brief simulator acclimation
session followed two days afterward by the full simulator test protocol. We should also note that Howarth and Hodder (2008) have
used the term habituation to indicate adaptation with a time delay.
To avoid confusion with the many definitions of that term, we will
be using “adaptation”.
The present study was conducted in the context of a larger
project to validate a clinical driving evaluation protocol. Investigation of the adaptation’s effectiveness was a secondary aim of that
larger project and placed several constraints upon the design. A
complete description of the validation study is beyond the scope
of this paper, but descriptions of the cognitive tasks and simulator
task sessions can be found in Tuttle et al. (2009) and Backs et al.
(2011).
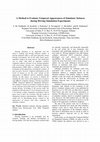
Fig. 1. Order of tasks and RSSQ administrations by session and group.
We examined the effects of an adaptation on self-reported
simulator sickness scores while in a high fidelity driving simulator. Participants were given a simulator sickness acclimation
before beginning a cognitive evaluation session and again before
beginning the driving session in the simulator. The sessions were
administered on separate days. The order of these sessions was
counterbalanced between participants. Thus, some participants
participated in an acclimation session two days before a driving
session (i.e., the adaptation; the Lag group) and others participated
in the driving session immediately after the acclimation (the immediate group). Fig. 1 shows the order of the two groups. Revised
Simulator Sickness Questionnaire (RSSQ) scores were obtained
before and after the acclimation during the cognitive session and
before and after the driving session which also contained an acclimation. Thus, we obtained four scores for each individual.
1.3. Hypotheses
As the main goal was to determine whether the adaptation
would reduce simulator sickness symptoms, the primary hypothesis relates to the effect of the adaptation. Prior work noted above
also suggested that there would be an age effect. We investigated
both hypotheses.
1.3.1. Adaptation
The main prediction involved post-driving session RSSQ scores.
We predicted that the Lag group would report lower post-driving
RSSQ total severity scores than the immediate group. Furthermore,
we predicted a similar significant effect of group on RSSQ nausea
scores. Based on unpublished data from our lab, we made no predictions of the effect of group (lag, immediate) on disorientation,
ocular discomfort or strain/confusion RSSQ scores.
1.3.2. Age
Because of prior experience with participants of varying ages
in simulated driving in our laboratory (Cassavaugh et al., 2009;
Domeyer, 2009), we predicted a significant effect of age on total
severity and nausea with older adults reporting higher scores (more
sickness). Again, based on findings from Domeyer (2009) we did not
predict a similar effect on the other subscale scores (disorientation,
ocular discomfort, and strain/confusion).
2. Materials and methods
2.1. Participants
Total participants were 120 (40 young; 40 middle; 40 old) individuals recruited for a driving assessment protocol validation. They
were either students from Central Michigan University recruited
through the psychology subject pool or members of the community recruited through flyers placed at surrounding organizations.
Students were given course credit for their participation. Members
of the community were paid $28 per hour for their participation.
Participants were assigned to groups by order of recruitment.
Author's personal copy
J.E. Domeyer et al. / Accident Analysis and Prevention 53 (2013) 127–132
The young group consisted of 24 females and 16 males ranging
from 18 to 28 years of age (M = 21, SD = 2 years). The middle-aged
group consisted of 25 females and 15 males ranging from 30 to 58
years of age (M = 46, SD = 9 years). The older group consisted of 24
females, 13 males, and 3 for whom sex was not recorded ranging
from 60 to 90 years of age (M = 70, SD = 8 years).
2.2. Research design
Participants performed a series of driving acclimation scenarios
in both the cognitive and driving evaluation sessions. Participants
reported levels of simulator sickness symptoms before and after
simulation on each day (Fig. 1).
2.3. Apparatus
Data were collected in the AAA Michigan Driving Simulator. The
simulator is a DriveSafety DS-600c driving simulator (DriveSafety
Corporation) which provides a 180-degree forward field of view.
Side-view and rear-view mirrors are implemented as LCD displays. The simulator is equipped with a 1.5 degree-of-freedom
motion base, which provides motion cues in pitch with minimal
forward/reverse translation and pitch washout after initial change
in velocity. The cab of the simulator is the forward passenger cabin
of a compact car.
2.4. Measures
2.4.1. Revised Simulator Sickness Questionnaire
Simulator sickness scores were recorded using the RSSQ (Kim
et al., 2004). The RSSQ is a modified version of Kennedy et al.’s
(1993) Simulator Sickness Questionnaire (SSQ) and extends the
scope of the SSQ by: (a) changing the scale from an interval
scale between 1 and 4 to an interval scale between 1 and 10, (b)
adding 8 additional items (drowsiness, visual flashbacks, stomach awareness, confusion, vomiting, pallor, difficulty equilibrating,
muscle stiffness for strain), and (c) adding an additional subscale
(strain/confusion). The resulting questionnaire provides a total
severity score as well as subscale scores measuring nausea, disorientation, ocular discomfort and strain/confusion.
Both the SSQ and RSSQ drew on the Motion Sickness Questionnaire (Kellog et al., 1965) for the initial list of symptoms. Kim et al.
(2004) found that the correlation between the RSSQ and SSQ scales
was high for total severity and the common subscales (r > .70 for
total severity and the common subscales). The nausea, ocular discomfort, disorientation, strain/confusion, and total severity scales
are weighted in the RSSQ. Conclusions by Kim et al. (2004) suggest
that the RSSQ should be treated as a partial replication and extension of the SSQ. Readers are referred to the Kim et al. (2004) paper
for more details pertaining to the RSSQ.
2.5. Procedure
Data collection took place at Central Michigan University’s Center for Driving Evaluation, Education and Research. The validation
consisted of two sessions conducted on different days. The sessions were separated by one day. That is, if a participant performed
the first session on Monday, then that participant performed the
second session on Wednesday of the same week. One session
consisted primarily of computer-based cognitive testing (the “cognitive session”). The other session consisted primarily of simulated
driving in a number of scenarios designed to test driving performance (the “driving session”). The order of the sessions was
counterbalanced. Testing on either day was immediately preceded
by an acclimation to the driving simulator. See Fig. 1 for clarification
on the order of blocks in the study.
129
Table 1
Description of the driving segments in the third acclimation scenario in which participants were in full control of the simulator.
Speed limit
Distance (km)
Intersection
56.3 km/h (35 mph)
72.4 km/h (45 mph)
88.5 km/h (55 mph)
72.4 km/h (45 mph)
0.6
1.0
1.0
1.2
Four-way with four-way stop signs
Four-way with two-way stop signs
Four-way with traffic light
T intersection with stop sign
The cognitive session required approximately 1.5 h. Participants
first completed a 10 min acclimation in the driving simulator. The
RSSQ was administered before and after the acclimation in the cognitive session. They then completed neuropsychological tasks and
the cognitive battery (Tuttle et al., 2009). When the tests were completed, participants drove an approximately 10-min acclimation in
the driving simulator. Then, participants completed 11 different
scenarios in the driving simulator to measure driving skills such
as situation awareness, divided attention, and planning. The RSSQ
was administered before the acclimation and after completing the
tasks in the driving simulator.
2.5.1. Acclimation procedure
The acclimation that was administered at the start of each
session consisted of four separate drives. In each drive, the roadway was a two-lane rural roadway with hard shoulder. Participants
were permitted to repeat each scenario until they were comfortable with it. This was a subjective evaluation on the part of the
participant. Most participants requested only a single run in each
acclimation scenario.
First, participants sat in the simulator while custom software
controlled speed and steering. We refer to this scenario as the “autodrive” scenario. Experience has shown the authors that most, if
not all, participants tend to over-control the simulator upon first
exposure, producing significant motion cues and the potential for
immediate, severe simulator sickness followed quickly by exiting
the experiment or clinical session. This allowed participants to
acclimate to the motion associated with starting and stopping in
the driving simulator. The target speed was 96.6 km/h (60 mph)
and the distance was 1.8 km.
In the second scenario, participants controlled the steering
while the software controlled speed. The environment, target
speed, and distance were the same as “autodrive”. We refer to this
scenario as the “cruise control” scenario.
In the third and fourth drives, participants were in full control
of the simulator. In the third, participants were asked to drive a
long section of straight road with intersections, stop signs, traffic
lights and speed limit changes. We asked them to obey traffic laws,
adjust their speed accordingly and stop at stop signs and traffic
lights. Details are provided in Table 1.
The fourth and final acclimation scenario consisted of a single four-way intersection. Participants started 22 meters from
the intersection, approached the intersection, stopped, and turned
either right or left as instructed. After the turn, the simulation
ended. Participants practiced turning multiple times to become
familiar with the simulator’s handling and turning characteristics.
In most cases two turns in each direction was sufficient for participants to learn how to execute the turns properly.
2.5.2. Analysis procedure
The total severity and subscale scores were computed with the
RSSQ using the method outlined by Kim et al. (2004). The individual symptoms were first weighted by values that were determined
by subject matter experts during the creation of the RSSQ. The
weightings represent the expert ratings of the importance of the
contributions of a particular symptom to simulator sickness. The
Author's personal copy
130
J.E. Domeyer et al. / Accident Analysis and Prevention 53 (2013) 127–132
scales were then adjusted to have equal variance in the method
outlined by Kennedy et al. (1993) for the SSQ. This results in separate total severity, nausea, disorientation, ocular discomfort and
strain/confusion scores.
For the primary hypotheses which related to the effects of age
and group we used an ANCOVA to account for any baseline differences. Post-driving RSSQ scores (D4 and D2) were analyzed with a 3
(age: young: 18–29 years, middle: 30–59 years, old: 60 + years) × 2
(group: lag vs. immediate) ANCOVA with baseline score (C1 and D1)
as a covariate. The respective covariates were significant for all of
the scales (p < .05). We report adjusted means and SEs for ANCOVA
analyses.
For analysis of baseline RSSQ scores (C1 and D1 from Fig. 1),
we used a 3 (age: young: 18–29 years, middle: 30–59 years, old:
60 + years) × 2 (group: lag vs. immediate) ANOVA. Analyses were
performed for each RSSQ scale (total severity, nausea, disorientation, ocular discomfort, and strain/confusion).
Twenty-five people exited the experiment due to discomfort
and were excluded from the analysis due to incomplete data sets.
These individuals were 5 young, 8 middle-aged, and 12 older adults.
Thus, the final sample included 35 young (males = 16, females = 19),
32 middle-aged (males = 13, females = 19) and 28 older adults
(males = 10, females = 18).
Table 3
Baseline RSSQ total severity score means (SDs) in each group by age.
Group
Age
Immediate
Lag
Overall
Young (N = 35)
Middle (N = 32)
Old (N = 28)
5.03 (7.63)
3.46 (5.25)
4.31 (6.60)
1.87 (2.40)
1.25 (1.97)
1.52 (2.15)
0.59 (.940)
1.28 (1.80)
0.93 (1.45)
3. Results
in total severity (F(2,89) = 5.40, p = .006, partial 2 = .108) showing that younger adults (M = 4.31, SD = 6.60) had higher baseline
RSSQ scores than older adults (M = 0.93, SD = 1.45)or middle-aged
adults (M = 1.52, SD = 2.15).Baseline analyses for total severity are
presented in Table 3. The effect of age was not significant for
the nausea subscale in the baseline RSSQ scores (F(2,89) = 2.58,
p = .081, partial 2 = .055). There was a significant effect of age on
baseline RSSQ scores for ocular discomfort (F(2,89) = 3.42, p = .037,
partial 2 = .072) and strain/confusion (F(2,89) = 3.44, p = .036, partial 2 = .072) scales. Younger adults indicated more symptoms
than older adults. This result is interesting because the effect of
age that existed prior to simulation was eliminated by taking into
account baseline scores. Further exploratory analysis revealed that
the effect might persist after exposure to the simulator but was
not significant due to large variance. More research is needed to
determine whether this apparent effect is genuine.
3.1. Age
3.2. Adaptation
We predicted that there would be a significant effect of age on
the total severity and nausea scales of the RSSQ with older adults
indicating more symptoms than younger adults. Participants’ baseline RSSQ scores (C1 and D1) were used as a covariate. Contrary to
our prediction, there was no effect of age on the total severity scale
after exposure to the simulator when taking into account the baseline scores (F(2,88) = 0.49, p = .659, partial 2 = .009). Additionally,
there was no effect of age on nausea when taking into account baseline scores (F(2,88) = 0.18, p = .834, partial 2 = .004). In other words,
the simulated drive did not affect each age group differently. None
of the other subscales attained significance for an effect of age after
simulation while accounting for baseline scores. Table 2 shows the
ANCOVA results for all of the subscales.
After answering the primary hypothesis, we wanted to know
if there was an effect of age in the baseline RSSQ scores (C1 and
D1). The effect of age was significant for the baseline analyses
We predicted that there would be significant post-driving differences in RSSQ scores between the experimental groups in
the total severity and nausea subscales of the RSSQ after taking into account their baseline states. Participants’ baseline RSSQ
scores (C1 and D1) were used as a covariate. Consistent with
our prediction, the effect of group was significant in total severity (F(1,88) = 4.54, p = .036, partial 2 = .049) with higher adjusted
scores for the immediate group (M = 12.97, SE = 1.87) than the
lag group (M = 7.37, SE = 1.84). Significantly lower scores in the
lag group suggest that the adaptation had an effect in reducing
overall symptoms. Contrary to our prediction the effect of group
on the nausea subscale did not attain significance (F(1,88) = 2.22,
p = .139, partial 2 = .025). ANCOVA results and effect means
are presented in Table 4.There was also a significant effect of
group for post-simulation scores on disorientation (F(1,88) = 4.66,
p = .033, partial 2 = .050), ocular discomfort (F(1,88) = 6.02, p = .016,
Table 2
Overall RSSQ total severity and subscale ANCOVA results.
(Sub)scale
Variable
F
p
Partial 2
Nausea
Group (df = 1,88)
Age (df = 2,88)
Group × age (df = 2,88)
2.22
0.18
0.77
.139
.834
.463
.025
.004
.017
Disorientation
Groupa (df = 1,88)
Age (df = 2,88)
Group × age (df = 2,88)
4.66
2.71
2.06
.033
.072
.132
.050
.058
.045
Ocular discomfort
Groupa (df = 1,88)
Age (df = 2,88)
Group × age (df = 2,88)
6.02
0.06
1.50
.016
.940
.227
.064
.001
.033
Strain/confusion
Groupa (df = 1,88)
Age (df = 2,88)
Group × age (df = 2,88)
4.15
0.31
1.45
.044
.727
.240
.045
.007
.032
Total Severity
Groupa (df = 1,88)
Age (df = 2,88)
Group × age (df = 2,88)
4.54
0.49
0.41
.036
.612
.659
.049
.011
.009
a
p < .05.
Author's personal copy
J.E. Domeyer et al. / Accident Analysis and Prevention 53 (2013) 127–132
131
Table 4
Adaptation RSSQ subscale score ANCOVA-adjusted means and standard errors.
Group
Nausea
Disorientationa
Ocular discomforta
Strain/confusiona
Total severitya
Lag (D4)
Immediate (D2)
7.38 (1.74)
11.10 (1.76)
9.41 (2.21)
16.25 (2.24)
7.84 (2.02)
14.93 (2.05)
6.17 (1.32)
10.02 (1.34)
7.37 (1.84)
12.97 (1.87)
a
p < .05.
partial 2 = .064) and strain/confusion (F(1,88) = 4.15, p = .044, partial 2 = .045) further supporting the claim that the lag group
reported fewer symptoms than the immediate group.
4. Discussion
The present findings are consistent with other work (Howarth
and Hodder, 2008; Teasdale et al., 2009) and further demonstrate
that a single brief exposure to the simulator followed by a day with
no exposure (i.e., adaptation) produces declines in report of simulator sickness symptoms. Consistent with our hypothesis we found
that total severity scores decreased with an adaptation to the simulator. Unfortunately, we did not find the predicted decrease in
nausea scores with the adaptation. Adaptation as an intervention is
more amenable to clinical schedules than a schedule including multiple exposures per day or multiple single exposures over several
days. The results reported here support the notion that simulator
sickness is at least partially associated with the participant’s level
of experience with the simulated environment.
We did not find that older adults were different from middleaged or young adults in post-simulation simulator sickness ratings.
Interestingly, older adults indicated fewer symptoms in their baseline (pre-driving) simulator sickness scores than younger adults.
This may warrant further investigation to determine if the difference in baseline scores is real or an artifact.
The differences in baseline simulator sickness ratings potentially indicate differences in how young and older adults rate their
overall wellness which may be associated with health variability. That is, older adults experience more variability in health and
may therefore rate their baseline state more favorably than young
adults. Further research is needed to determine whether age and
group (lag or immediate) interact.
These findings suggest an avenue by which simulated environments may be made accessible to a population which currently
may not be taking advantage of them. Indeed, given the rise in
consumer-grade 3-D entertainment such as TVs and computer displays this type of situation (referred to as cybersickness in this
context) may become more prevalent (O’brien and Baime, 2010).
Research findings such as ours suggest that gradual exposure and
experience with these types of devices may alleviate symptoms
of cybersickness over time. Similarly, simulator sickness as a phenomenon may effectively disappear over time as experience with
3-D virtual environments continues to increase among the general
population.
Because this study was conducted as part of a larger project
with other goals, the adaptation was confounded with the number
of actual acclimations the participant received. That is, those participants in the lag group experienced the acclimation sequence
twice prior to performing the driving session. This meant that they
received an acclimation on day one, no session on day two, and
an acclimation and driving session on day three. Future research
should account for this confound by eliminating the pre-driving
adaptation session for the lag group. Future research should also
determine the benefits of reducing simulator sickness among
clients. Fortunately, the presence of simulator sickness has not
been shown to affect performance in driving simulators (Mullen
et al., 2010). However, reducing simulator sickness could result in
increased well-being or even acceptance of simulation as a valid
assessment tool. It is because of these reasons that we feel further
exploration of simulator sickness is warranted.
However, there may be other effects associated with a simulated
environment, separate from simulator sickness, that researchers
should be concerned with. For instance, Muth and colleagues (Muth
et al., 2006; Muth, 2009) have identified effects associated with
uncoupled motion that affect performance on some cognitive tasks,
that cannot be attributed to motion sickness, and that persist for
a number of hours after exposure. Such effects may be insidious
in that they are not immediately noticeable because they are not
necessarily accompanied by simulator sickness symptoms. A driver
suffering from such effects after participating in research or assessment in a simulator could pose a danger to him/herself or others on
the road. Adaptations such as the one proposed here could help alleviate those problems, but future research is warranted to determine
if this is case.
The number of older drivers is expected to continue to increase
in the coming years and the demand for driving assessments is
likely to increase. When a driver’s safety behind the wheel is in
question to begin with (as might be the case if a driver was referred
for an evaluation), the wisdom of performing an on-road driving
assessment is questionable. Even closed-circuit tracks may not be
the wisest choice in that situation. A shortened adaptation schedule
may open the door to increased use of simulators in driving assessment and in post-assessment remediation of driving performance
deficits. This might in turn help reduce the numbers of accidentinvolved senior drivers, thus reducing injuries, fatalities, and costs
associated with them. In addition, simulators are useful for training
novice drivers in basic vehicle control and hazard perception. Many
of them may also be susceptible to simulator sickness and would
benefit from an adaptation protocol that would make the simulator accessible to them. In each case (older, experienced drivers and
younger, novice drivers), a reduction in accident involvement could
be expected as a result.
Acknowledgments
We wish to thank Stephanie Tuttle and Davis Conley for their
assistance with data collection. We also wish to thank Dr. Linda
Boyle and 2 anonymous reviewers for their helpful comments. An
earlier version of these data were presented at the Association for
the Advancement of Automotive Medicine 54th Annual Conference.
This research was funded by a Central Michigan University Vision
2010 award to Richard W. Backs.
References
Backs, R.W., Tuttle, S., Conley, D., Cassavaugh, N.D., 2011. Attention factors compared to other predictors of simulated driving performance across age groups.
In: Proceedings of the Sixth International Driving Symposium on Human Factors
in Assessment, Training, and Vehicle Design, Iowa City, IA.
Brooks, J.O., Goodenough, R.R., Crisler, M.C., Klein, N.D., Alley, R.L., Koon, B.L., Logan,
W.C., Ogle, J.H., Tyrrell, R.A., Willis, R.F., 2010. Simulator sickness during driving
simulation studies. Accident Analysis and Prevention 42, 788–796.
Cassavaugh, N.D., Domeyer, J., Backs, R.W., 2009. The effect of age on decision making
during unprotected turns across traffic. In: Fifth International Symposium on
Human Factors in Driver Assessment, Training and Vehicle Design, Big Sky, MT,
pp. 97–103.
Craik, F.I.M., Salthouse, T.A., 2007. The Handbook of Aging and Cognition, third ed.
Lawrence Earlbaum Associates, Mahwah, NJ, p. 672.
Author's personal copy
132
J.E. Domeyer et al. / Accident Analysis and Prevention 53 (2013) 127–132
Domeyer, J., 2009. The effect of cognitive priming on simulator discomfort. Unpublished Undergraduate Honors Project, Central Michigan University.
Edwards, C.J., Creaser, J.I., Caird, J.K., Lamsdale, A.M., Chisholm, S.L., 2004. Older and
younger driver performance at complex intersections: implications for using
perception-response time and driving simulation. In: Proceedings of the Second
International Symposium on Human Factors in Driver Assessment, Training, and
Vehicle Design, Park City, UT.
Freund, B., Green, T.R., 2006. Simulator sickness amongst older drivers with
and without dementia. Advances in Transportation Studies (Special Issue),
71–74.
Gower, D.W., Lilienthal, M.G., Kennedy, R.S., Fowlkes, J.E., Baltzley, D.R., 1987. Simulator Sickness in the AH-64 Apache Combat Mission Simulator. USAARL, Fort
Rucker, AL.
Hill, K.J., Howarth, P.A., 2000. Habituation to the side effects of immersion in a virtual
envirionment. Displays 21, 25–30.
Howarth, P.A., Hodder, S.G., 2008. Characteristics of habituation to motion in a virtual
environment. Displays 29, 117–123.
Hu, S., Stern, R.M., 1999. The retention of adaptation to motion sickness
eliciting stimulation. Aviation, Space, and Environmental Medicine 70 (8),
766–768.
Kellog, R.S., Kennedy, R.S., Graybiel, A., 1965. Motion sickness symptomatology
of labyrinthine defective and normal subjects during zero gravity maneuvers.
Aerospace Medicine 4, 315–318.
Kennedy, R.S., Lane, N.E., Berbaum, K.S., Lilienthal, M.G., 1993. Simulator sickness
questionnaire: an enhanced method for quantifying simulator sickness. The
International Journal of Aviation Psychology 3, 203–220.
Kim, D.H., Parker, D.E., Park, M.Y., 2004. A New Procedure for Measuring Simulator
Sickness – The RSSQ. University of Washington Human Interface Technology
Laboratory, Seattle, WA, 1–14.
Mullen, N.W., Weaver, B., Riendeau, J.A., Morrison, L.E., Bedard, M., 2010. Driving performance and susceptibility to simulator sickness: are they related? American
Journal of Occupational Therapy 64, 288–295.
Muth, E.R., 2009. The challenge of uncoupled motion: duration of cognitive and
physiological after effects. Human Factors 51 (5), 752–761.
Muth, E.R., Walker, A.D., Fiorello, M., 2006. Effects of uncoupled motion on performance. Human Factors 48 (3), 600–607.
O’brien, M., Baime, J., 2010. Cybersickness: A Virtual Bummer – Science Nation.
National Science Foundation, Arlington, VA.
Park, G.D., Rosenthal, T.J., Allen, R.W., Cook, M.L., 2004. Simulator sickness results
obtained during a novice driver training study. In: Proceedings of the Human
Factors and Ergonomics Society 48th Annual Meeting, pp. 2652–2656.
Reason, J.T., Brand, J.J., 1975. Motion Sickness. Academic Press, London.
Reason, J.T., 1978. Motion Sickness Adaptation: A Neural Mismatch Model. Journal
of the Royal Society of Medicine 51, 819–829.
Rizzo, M., Sheffield, R.A., Stierman, L., Dawson, J., 2003. Demographic and driving
performance factors in simulator adaptation syndrome. In: Proceedings of the
Second International Driving Symposium on Human Factors in Driver Assessment, Training and Vehicle Design, pp. 201–208.
Stanney, K.M., Kingdon, K.S., Kennedy, R.S., 2002. Dropouts and aftereffects: examining general accesibility to virtual environment technology. Proceedings of the
Human Factors and Ergonomics Society 46th Annual Meeting, 2114–2118.
Teasdale, N., Lavalliere, M., Tremblay, M., Laurendeau, D., Simoneau, M., 2009. Multiple exposition to a driving simulator reduces simulator symptoms for elderly
drivers. In: Proceedings of the Ffifth International Driving Symposium on Human
Factors in Driver Assessment, Traioning, and Vehicle Design, Big Sky, MT.
Tuttle, S., Cassavaugh, N.D., Backs, R.W., 2009. Attention function and structure of
older and younger adult drivers. In: 5th International Driving Symposium on
Human Factors in Driver Assessment, Training and Vehicle Design, Big Sky, MT.
Academia.edu no longer supports Internet Explorer.
To browse Academia.edu and the wider internet faster and more securely, please take a few seconds to upgrade your browser.
Lessons Learned Regarding Simulator Sickness in Older Adult Drivers
Lecture Notes in Computer Science, 2011
By Nicholas Cassavaugh and Richard Backs
...Read more
Related Papers
Accident Analysis & Prevention, 2013
Download

American Journal of Occupational Therapy, 2011
Download

Accident Analysis & Prevention, 2010
Download

Download

Adaptation to simulator sickness in older drivers following multiple sessions in a driving simulator
Gerontechnology, 2014
Download

Advances in Human Aspects of Transportation, 2018
Download

Safety
Download

Download
Safety
Download

حولیة کلیة اصول الدین بالقاهرة, 2016
Download


Download

Routledge, 2024
Download

Sophia: International Journal of Philosophy and Traditions, 2024
Download
