Spectrochimica Acta Part A: Molecular and Biomolecular Spectroscopy 136 (2015) 625–634
Contents lists available at ScienceDirect
Spectrochimica Acta Part A: Molecular and
Biomolecular Spectroscopy
journal homepage: www.elsevier.com/locate/saa
Structural investigation of oxovanadium(IV) Schiff base complexes:
X-ray crystallography, electrochemistry and kinetic of thermal
decomposition
Mozaffar Asadi a,⇑, Zahra Asadi a, Nooshin Savaripoor a, Michal Dusek b, Vaclav Eigner b,c,
Mohammad Ranjkesh Shorkaei a, Moslem Sedaghat a
a
Department of Chemistry, College of Science, Shiraz University, Shiraz 71454, Iran
Institute of Physics AS CR, v.v.i., Na Slovance 2, 182 21 Prague, Czech Republic
c
Department of Solid State Chemistry, Institute of Chemical Technology, 166 28 Prague, Czech Republic
b
h i g h l i g h t s
g r a p h i c a l a b s t r a c t
� Kinetic of thermal decomposition
showed that the complexes had good
thermal stability.
� Electrochemical studies showed the
difference in redox potential of the
complexes according to the
substitutional groups.
� The X-ray of vanadyl Schiff base
complex showed two different crystal
structure.
a r t i c l e
i n f o
Article history:
Received 5 July 2014
Received in revised form 16 September
2014
Accepted 19 September 2014
Available online 23 October 2014
Keywords:
Oxovanadium(IV) complexes
Schiff base
Kinetics of thermal decomposition
Electrochemistry
a b s t r a c t
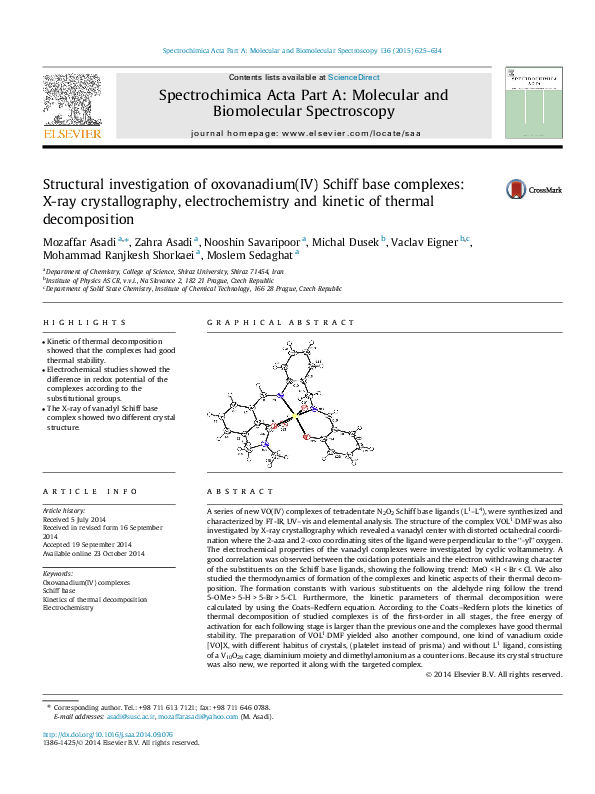
A series of new VO(IV) complexes of tetradentate N2O2 Schiff base ligands (L1–L4), were synthesized and
characterized by FT-IR, UV–vis and elemental analysis. The structure of the complex VOL1�DMF was also
investigated by X-ray crystallography which revealed a vanadyl center with distorted octahedral coordination where the 2-aza and 2-oxo coordinating sites of the ligand were perpendicular to the ‘‘-yl’’ oxygen.
The electrochemical properties of the vanadyl complexes were investigated by cyclic voltammetry. A
good correlation was observed between the oxidation potentials and the electron withdrawing character
of the substituents on the Schiff base ligands, showing the following trend: MeO < H < Br < Cl. We also
studied the thermodynamics of formation of the complexes and kinetic aspects of their thermal decomposition. The formation constants with various substituents on the aldehyde ring follow the trend
5-OMe > 5-H > 5-Br > 5-Cl. Furthermore, the kinetic parameters of thermal decomposition were
calculated by using the Coats–Redfern equation. According to the Coats–Redfern plots the kinetics of
thermal decomposition of studied complexes is of the first-order in all stages, the free energy of
activation for each following stage is larger than the previous one and the complexes have good thermal
stability. The preparation of VOL1�DMF yielded also another compound, one kind of vanadium oxide
[VO]X, with different habitus of crystals, (platelet instead of prisma) and without L1 ligand, consisting
of a V10O28 cage, diaminium moiety and dimethylamonium as a counter ions. Because its crystal structure
was also new, we reported it along with the targeted complex.
Ó 2014 Elsevier B.V. All rights reserved.
⇑ Corresponding author. Tel.: +98 711 613 7121; fax: +98 711 646 0788.
E-mail addresses: asadi@susc.ac.ir, mozaffarasadi@yahoo.com (M. Asadi).
http://dx.doi.org/10.1016/j.saa.2014.09.076
1386-1425/Ó 2014 Elsevier B.V. All rights reserved.
�626
M. Asadi et al. / Spectrochimica Acta Part A: Molecular and Biomolecular Spectroscopy 136 (2015) 625–634
Introduction
There has been considerable interest in the chemistry of transition metal complexes of Schiff bases, due to the fact that Schiff
bases stabilize many different metals in various oxidation states
[1]. Vanadium is actually known as a trace element essential for
higher organisms. The coordination chemistry of vanadium is of
great interest because of its presence in abiotic as well as biotic
systems [2,3]. Vanadium can be used as a catalyst for various types
of reactions [4], it exhibits variety of insulin mimetic properties
and plays a role in many enzymatic reactions. The biochemical
aspects of vanadium complexes are the driving force for research
of the coordination chemistry of vanadium [5].
Keeping all these facts in mind, we present here the synthesis
and characterization of the ligands obtained from the reaction of
salicylaldehyde derivatives with 2-aminobenzylamine and their
vanadium complexes. We also report the electronic effect of salicylaldehyde derivatives in the ligands on the thermodynamics,
thermal and electrochemical properties of their vanadyl(IV) Schiff
base complexes. The kinetic parameters of thermal decomposition,
calculated using the Coats–Redfern method are also presented.
Experimental
All chemicals and solvents used for synthesis and electrochemistry were of commercially available reagent grade and used without purification. Scanning UV–vis measurements were carried out
on a Perkin-Elmer Lambda 2 UV–vis spectrophotometer equipped
with a LAUDA ecoline RE 104 thermostat. The 1H NMR (250 MHz,
CDCl3 or DMSO-d6, TMS) spectra were recorded on Bruker Avance
DPX 250 MHz spectrometer. IR spectra were recorded on Shimadzu
FT-IR 8300 infrared spectrophotometer. Elemental microanalyses
(C.H.N.) were obtained using a CHN Thermo-Finnigan Flash
EA1112. BUCHI 535 instrument was used to obtain the melting
point of the compounds. Thermogravimetric measurements were
performed on a Perkin-Elmer Pyris Diamond Model. Electrochemistry studies were recorded using Auto lab 302N. X-ray
single-crystal diffraction experiment was performed on four-circle
diffractometer Gemini of Agilent Technologies with kappa geometry, equipped with a Copper sealed tube, Cu-Ultra collimator with
mirrors and CCD detector Atlas. The diffraction data were processed
with Crysalis Pro [6], the structures were solved with Superflip [7],
refined with Jana2006 [8] and plotted by Diamond 3 of crystal
impact. Hydrogen atoms attached to carbon atoms were kept in
theoretical positions, those attached to nitrogen atoms were
refined freely. The cyclic voltammetry experiments were carried
out with a three electrode apparatus. The working electrode was
a glassy carbon disc, polished with an Al2O3 suspension prior to
every experiment. Ag/AgCl and Pt foil were used as reference
and counter electrodes, respectively. The solutions of complexes
(1.0 � 10�3 mol L�1) in CH3CN, and tetrabutylammuniumperchlorate (0.1 mol L�1) as a supporting electrode were prepared. All
compounds were investigated at 25 °C and the voltammograms
were recorded with a potential scan of 100 mV s�1. The measurements of formation constant were done using UV–vis absorption
spectroscopy through titration of the ligands with various concentrations of metal ions at constant ionic strength (0.10 M NaClO4)
and at 25.0 (±0.1 °C). The interaction of NaClO4 with a ligand and
the metal ions in methanol was negligible. In a typical measurement 2.5 ml of the ligand solution was transferred into thermodynamic cell compartment of UV–vis instrument and titrated by the
metal ion solution. The titration was performed with aliquots of
the metal ion with Hamilton 50 ll syringe to the ligand. The
absorption measurements were carried out at various wavelengths
where the difference in absorption was the maximum after equilibrium. The final spectra of products show different absorption
bands from the free ligands, while the metal ion solutions show
no absorption at any wavelength.
Synthesis of the ligands
The tetradentate Schiff base ligands, L1–L4, were prepared
according to the literature [9] by condensing a hot solution of
1 mmol of 2-aminobenzylamine with a hot solution of 2 mmol of
salicylaldehyde and its derivatives in methanol and refluxing for
3 h. The pure yellow solid was filtered, washed with cold
Et2O(5 ml), dried in vacuum and used without further purification.
Synthesis of the complexes
A methanolic solution of VO(acac)2 (1.0 mmol) was added to
30 ml chloroform solution containing 1.0 mmol of the ligand. The
solution was refluxed for 2 h. The precipitate was filtered and
washed with chloroform (5 ml) and Et2O (5 ml) (Scheme 1).
Growth of the crystals for X-ray crystallography
Single crystals of the vanadyl complex, VOL1�DMF, were
obtained in good yield from slow diffusion of diethyl ether into a
solution of the metal complex in dimethylformamide (DMF) at
room temperature. The preparation of VOL1�DMF yielded also
another compound, [VO]X, with different habitus of crystals (platelet instead of prisma). Although it did not contain the L1 ligand we
reported it along with VOL1�DMF because its structure was new.
We believe that peroxide impurities of diethyl ether oxidized the
vanadyl Schiff base complex yielding the cage of vanadium oxide.
This cage is very similar to the vanadium (V) oxide (V2O5) and it
confirms our idea.
Results and discussion
Crystal structure of VOL1�DMF complex
The vanadyl ion is located in a general position of the noncentrosymmetric space group Pn. The presence of the center of
symmetry was excluded already during solution of the phase
Scheme 1. The structure of Schiff bases and their complexes.
�M. Asadi et al. / Spectrochimica Acta Part A: Molecular and Biomolecular Spectroscopy 136 (2015) 625–634
Table 1
Crystallographic data for VOL1�DMF complex.
Table 2
Selected bond lengths (Å) and angles (°) for VOL1�DMF complex; prisma structure.
Complex
Formula
Formula weight
Crystal system
Space group
T (K)
a (Å)
b (Å)
c (Å)
a (°)
b (°)
c (°)
V (Å3)
Z
Dx (g cm�3)
F (0 0 0)
Nref independent (measured)
Tmin, Tmax
Robs (reflections > 3r)
wR2 (all reflections)
627
C24H23N3O4V
468.39
Monoclinic
Pn
120
8.0734(5)
10.3653(4)
13.1415(7)
90
106.468(5)
90
1054.61(10)
2
1.475
486.0
1884 [3756]
0.540, 0.658
0.0320(2878)
0.0791(2939)
problem by charge flipping, which yielded clearly non-centrosymmetric electron density map, and further confirmed by the refinement. The Flack parameter 0.359(6) suggests presence of an
inversion twinning. The ligand L1 coordinates to the vanadyl center
in a tetradentate fashion forming an equator while the sixth coordination site is occupied with the solvent molecule. This results in
a distorted octahedral geometry where 2-aza and 2-oxo coordinating sites of the ligand are perpendicular to the ‘‘-yl’’ oxygen. The
coordination geometry around VO is significantly shifted from planarity with the dihedral angle of 26.64(14) between coordination
planes of N9–V1–O1 and N17–V1–O25. The crystal lattice of the
complex contains a DMF molecule, which is the solvent used for
recrystallization. The V@O bond distance in the vanadyl moiety
of the complex is 1.600(2), which is typical value for vanadyl compounds [10,11]. The V1–O1 and V1–O25 bond distances
[1.954(2), 1.955(2)] are shorter than V1–N9 and V1–N17
V1AO1v
V1AO1
V1AO25
V1AO1s
V1AN9
V1AN17
O1sAC2s
O25AC24
O1AC2
C18AN17
C8AN9
C16AN17
C10AN9
C18AC19
C7AC8
1.600(2)
1.954(2)
1.955(2)
2.353(2)
2.112(2)
2.087(2)
1.238(5)
1.311(4)
1.319(4)
1.282(4)
1.301(4)
1.485(3)
1.430(3)
1.453(4)
1.436(4)
O25AV1AO1
O25AV1AO1v
O25AV1AO1s
O25AV1AN17
O25AV1AN9
O1AV1AO1v
O1AV1AO1s
O1AV1AN17
O1AV1AN9
O1vAV1AO1s
O1vAV1AN9
O1vAV1AN17
N9AV1AN17
N9AC8AC7
N17AC18AC19
C10AN9AC8
C16AN17AC18
87.76(9)
99.9(1)
86.16(9)
88.51(9)
166.90(9)
105.6(1)
81.74(9)
156.57(9)
88.86(9)
170.6(1)
93.2(1)
97.8(1)
89.57(9)
126.7(3)
125.6(3)
117.0(2)
118.1(2)
[2.112(2), 2.087(2)], which indicates stronger coordination of the
oxygen atoms. Crystallographic data and details of the data collection are listed in Table 1, a molecule of the complex is shown in
Fig. 1. Selected bond parameters are listed in Table 2.
Crystal structure of [VO]X
The monoclinic structure of [VO]X with space group P21/c consists of V10O28 cage, fragments of diamine moiety and fragments of
DMF as the recrystallization solvent (Fig. 2a). The cage consists of
five symmetry independent vanadium atoms and fourteen symmetry independent oxygen atoms expanded through the center of
symmetry. Each vanadium is surrounded by six atoms of oxygen
in distorted octahedral geometry. The V–O bonds pointing out of
the cage keep the typical distance for vanadyl around 1.6 Å (see
Fig. 2b) while for vanadium V2 located inside the cage the vanadyl
oxygen cannot be identified. Oxygen O12 is bonded weakly with
V–O distances above 2.1 Å. Selected bond lengths and angles of
[VO]X are collected in Table 3. Because the compound was not
Fig. 1. Structure of VOL1�DMF complex.
�628
M. Asadi et al. / Spectrochimica Acta Part A: Molecular and Biomolecular Spectroscopy 136 (2015) 625–634
Fig. 2. (a) Structure of [VO]X. (b). Distribution of VAO distances in V10O28 cage of [VO]X. Color codes: 1.604–1.611 Å black, 1.683–1.704 Å indigo, 1.812–1.929 Å gray, 1.976–
2.051 Å light yellow, 2.120–2.321 Å white. (For interpretation of the references to colour in this figure legend, the reader is referred to the web version of this article.)
Elemental analysis
Table 3
Selected bond lengths and angles for ‘‘VO’’ cage of
[VO]X.
V1AO2
V1AO3
V1AO5
V1AO11
V1AO12
V1AO14
O2AV1AO3
O2AV1A O5
O2AV1A O11
O2AV1AO12
O2AV1AO14
O3AV1AO5
O3AV1AO11
O3AV1AO12
O3AV1AO14
O5AV1AO11
O5AV1AO12
O5AV1AO14
O11AV1AO12
O11AV1AO14
O12AV1AO14
The elemental analysis (Table 4) is in good agreement with
those calculated for the proposed formula.
1.909(2)
1.870(2)
1.821(2)
1.604(2)
2.311(2)
2.059(2)
153.82(8)
91.42(8)
102.0(9)
77.09(7)
82.29(8)
92.37(8)
102.16(9)
77.79(7)
84.15(8)
104.02(9)
82.16(7)
156.95(8)
173.80(8)
98.98(9)
74.83(7)
IR characteristics
The IR spectra of the free Schiff base ligands and the complexes
exhibit several bands in 400–4000 cm�1 region (Table 5). As a
result of replacing the hydroxyl hydrogen of the Schiff base ligands
by the metals, the strong band at about 3417–3448 cm�1 disappeared. The bands at 2823–3070 cm�1 in the Schiff base ligands
and complexes are assigned to aliphatic and aromatic CAH modes
of vibrations [12].The stretching vibration of the azomethine group
(C@N) in Schiff base ligands is observed in the range 1612–
1635 cm�1 [13,14]. In complexes, these bands are shifted to lower
frequencies, indicating that the nitrogen atom of the azomethine
group is coordinated to the metal ion. Stretching bands in the
range 1410–1566 cm�1 are due to the skeleton stretching vibration
of C@C of the benzene ring [15]. The vanadyl complexes show a
band at the range 864–972 cm�1 attributed to V@O frequency [16].
the targeted complex, other tables have been deposited as supplementary material. The deposited Table S1 collects the basic crystallographic data for [VO]X. The deposited Table S2 documents
geometric similarity of the C8H9N2 cyclic moiety found in [VO]X
with the diamine moiety of the ligand in VOL1�DMF, which supports the idea that C8H9N2 was separated from the ligand L1. The
deposited Table S3 makes similar analysis for C2H8N moiety of
[VO]X and the DMF molecule supporting the idea that C2H8N
was separated from DMF.
Electronic spectra
With the aim of obtaining information about the type of the
electronic transitions and interactions in solution, the electronic
spectra of ligands and their complexes (Fig. 3) were recorded in
MeOH (Table 6). The recorded spectra of the ligands have revealed
two main absorption bands. The first band observed at long
wavelength can be ascribed to the p–p⁄ transitions of azomethine
system and the second band at higher energy is attributed to the
Table 4
Characteristic and analytical data for the complexes.
Compounds
Color
m.p. (°C)
Yield (%)
Found (Calculated)
C
VOL1�H2O
VOL2�H2O
VOL3�H2O
VOL4�H2O
Green
Green
Brown
Brown
>250
>250
>250
>250
71
81
59
55
61.34
58.46
44.33
52.36
H
(61.02)
(58.36)
(44.16)
(52.31)
4.30
4.66
2.88
3.36
N
(4.39)
(4.68)
(2.82)
(3.34)
7.09
5.90
4.96
5.83
(6.78)
(5.92)
(4.91)
(5.81)
�M. Asadi et al. / Spectrochimica Acta Part A: Molecular and Biomolecular Spectroscopy 136 (2015) 625–634
Table 5
Selected IR bands (ˆmax/cm�1) of the Schiff base ligands and their vanadyl complexes.
Compounds
1
L
L2
L3
L4
VOL1�H2O
VOL2�H2O
VOL3�H2O
VOL4�H2O
ˆO
AH
3433
3417
3417
3448
–
–
–
–
ˆC
AH
3042
3008–2823
3068–2883
3070–2893
3047–2923
2939–2823
3056–2857
3046–2869
ˆC
ˆC
@N
1633
1635
1635, 1612
1635, 1612
1612
1627, 1596
1612
1612
ˆV
@C
1565–1410
1566–1488
1558–1473
1558–1473
1542–1450
1535–1460
1512–1458
1519–1458
@O
–
–
–
–
956
972
871
864
1.2
L4
---- VOL4
1
0.8
0.6
0.4
0.2
0
200
250
300
350
400
450
500
Fig. 3. The electronic spectra of L4 and VOL4 in methanol.
Table 6
UV–vis. absorption bands (nm) of the Schiff base ligands and their vanadyl complexes.
Compound
1
L (H)
L2(OMe)
L3 (Br)
L4 (Cl)
VOL1�H2O
VOL2�H2O
VOL3�H2O
VOL4�H2O
p–p⁄ (C@C)
p–p⁄ (C@N)
n–p⁄
235
235
247
240
255
260
263
260
275
265
266
265
320
350
335
330
370
390
377
375
–
–
–
–
p–p⁄ transition of the phenyl rings of the compounds. The band
due to the n ? p⁄ transition of the C@N chromophore can be seen
for the free ligands at the range 350–400 nm involving the promotion of electron pair on the nitrogen to an antibonding p⁄orbital of
imine group. On complexation this band disappeared suggesting
the coordination of azomethine nitrogen to the metal ion, as the
formation of the metal–nitrogen bond stabilizes the electron pair
on the nitrogen atom [17]. Thus addition of metal ion to the ligand
629
solution causes distinguishable changes in the visible absorption
spectra of the ligand, suggesting an instantaneous complex
formation in solution.
DFT or ab initio studies
The geometries of all molecules involved in this study were
fully optimized by using the DFT method with the B3LYP functional and basis set, 6-311G was used for all kinds of atoms at complexes. All of DFT calculations were performed using the GAUSSIAN
03 program and then the following molecular descriptors were collected: total energy (TE), dipole moment (DM), atomic charge of
central atom frontier orbital energies including HOMO (highest
occupied molecular orbital) and LUMO (lowest unoccupied molecular orbital) and the difference between HOMO and LUMO level
energies.
The optimized stable molecular structures of the ligands and
complexes are shown in Fig. 4 and Fig. S1 and their frontier orbitals
(HOMO, LUMO) are shown in Figs. 5 and S2.
Selected geometrical parameters including bond lengths, bond
angles and other parameters are listed in Tables 7–9. Results
showed that all of the bond lengths and bond angles are in the
normal range. In order to check the validity of the applied method,
X-ray diffraction data of VOL1 complex were used to compare the
optimized structures of the complex. The agreement between the
computed structure by the DFT or ab initio method and X-ray
diffraction data was excellent.
Fig. 6 compares the calculated absorption spectra of VOL1 and
VOL3 complexes with the corresponding recorded spectra of
complexes in methanol solvent. As seen, there is relatively good
agreement between the theoretical and experimental spectra.
Thus we can use the theoretical spectra to confirm the transition character of each band. In Fig. 7 four selected bands have been
identified in the theoretical spectrum of VOL1 complex and the
related transition of each bands are shown in the molecular orbital
diagram.
According to Fig. 7 and Table 10 for each band some important
transitions have been shown. For example for band 1 transition has
been occurred between 104a ? 108a and 104b ? 107b levels. By
considering the electron density of this transition (Table 10) it is
concluded that this transition is essentially related to the delocalization of the electrons from phenyl rings of the Schiff base to the
C@N moiety. Thus this band can be assign to the pring ? p⁄C@N transition. Similarly, for band 2 some important transitions have been
shown: 105a ? 109a, 106a ? 109a and 105b ? 108b. By considering the electron density of these transitions, this band can be assign
to the noxygen ? p⁄C@N transition and MLCT, but the portion of n ? p⁄
is more important than MLCT. With the same conclusion bands 3
and 4 can be assign to noxygen ? p⁄C@N transition and MLCT but again
the portion of n ? p⁄ is more important than MLCT.
Fig. 4. The optimized structure of the ligand L1 and its complex.
�630
M. Asadi et al. / Spectrochimica Acta Part A: Molecular and Biomolecular Spectroscopy 136 (2015) 625–634
Fig. 5. Frontier orbitals of the ligand L1 and its complex.
Table 9
The computed electronic properties for complexes at B3LYP method.
Table 7
Selected bond lengths in Å by theoretical calculation at B3LYP method.
VOL1
VAO(3)
VAO(4)
VAN(1)
VAN(2)
VAO(39)
VAO(37)
1.975
1.979
2.128
2.103
2.350
1.616
VOL4
VAO(3)
VAO(4)
VAN(1)
VAN(2)
VAO(39)
VAO(37)
VOL1
VOL3
VAO(3)
VAO(4)
VAN(1)
VAN(2)
VAO(39)
VAO(37)
1.978
1.979
2.130
2.106
2.33
1.615
VAO(3)
VAO(4)
VAN(1)
VAN(2)
VAO(39)
VAO(37)
�2165.68
10.25
�0.209
�0.086
0.123
1.648
VOL4
VOL2
1.978
1.979
2.130
2.106
2.330
1.615
EB3LYP (a.u.)
l (Debye)
HOMO (a.u.)
LUMO (a.u.)
HOMO–LUMO gap (a.u.)
Metal charge (c)
VOL3
1.968
1.976
2.132
2.108
2.358
1.617
EB3LYP (a.u.)
l (Debye)
HOMO (a.u.)
LUMO (a.u.)
HOMO–LUMO gap (a.u.)
Metal charge (c)
EB3LYP (a.u.)
l (Debye)
HOMO (a.u.)
LUMO (a.u.)
HOMO–LUMO gap (a.u.)
Metal charge (c)
�7312.66
10.55
�0.214
�0.092
0.122
1.649
VOL2
�3084.88
10.55
�0.215
�0.093
0.122
1.649
EB3LYP (a.u.)
l (Debye)
HOMO (a.u.)
LUMO (a.u.)
HOMO–LUMO gap (a.u.)
Metal charge (c)
�2394.70
7.81
�0.202
�0.087
0.115
1.644
Table 8
Selected bond angle (°) by theoretical calculation at B3LYP method.
VOL1
O3AVAO4
O3AVAN1
O4AVA N2
N1AVA N2
VOL3
90.00
87.29
85.71
89.87
VOL4
O3AVAO4
O3AVAN1
O4AVA N2
N1AVA N2
O3AVAO4
O3AVAN1
O4AVA N2
N1AVA N2
90.22
87.31
85.75
90.06
VOL2
90.28
87.31
85.70
90.11
O3AVAO4
O3AVAN1
O4AVA N2
N1AVA N2
90.09
87.34
85.52
89.75
Thermal analysis
The thermal decomposition of the complexes was studied to
evaluate their thermal stability as can be seen from the TG/DTG
curves presented in Fig. 8. The organic part of the complexes
may decompose in one or more steps with the possibility of the
formation of one or two intermediates. These intermediates may
include the metal ion with a part of the Schiff base and may finally
decompose to stable metal oxides.
VOL1�H2O complex decomposes in three steps. The first step
(calc. 4.36%, found 5%) occurs at the range of 343–393 °C and is
Fig. 6. The experimental (in methanol) and theoretical electronic spectra of VOL1
and VOL3.
attributed to the release of H2O molecule. The second step (calc.
21.79%, found 22%) occurs in the range 393–542 °C and is assigned
to the elimination of C7H8. The last step is attributed to the loss of
the rest of the ligand with the formation of metal oxide.
The decomposition of VOL2�H2O occurs in three steps. The first
mass loss (calc. 3.8%, found 4%) in the range of 312–392 °C is attributed to the dehydration of the coordinated water. The second mass
loss (calc. 16.07%, found 15%) can be seen between 392–498 °C corresponding to the elimination of C6H4 group. The third step is
assigned to the loss of the rest of the ligand with the formation of
metal oxide. By considering the TG percentage the metal oxide is.
�631
M. Asadi et al. / Spectrochimica Acta Part A: Molecular and Biomolecular Spectroscopy 136 (2015) 625–634
band2
band1
band3
band4
5
2
5
5
0
Molecular Orbitals
Molecular Orbitals
Molecular Orbitals
0.5
0.5
0.5
0
0
0
0
-0.5
-0.5
-0.5
-0.5
-1
-1
-1
-1
-1.5
-1.5
-1.5
-1.5
-2
-2
-2
-2
-2.5
-2.5
-2.5
-2.5
-4
-4.5
-5
-5.5
-3
-3.5
-4
-4.5
-5
-5.5
-3
Energy (eV)
-3.5
Energy (eV)
-3
Energy (eV)
-3
Energy (eV)
Molecular Orbitals
0.5
-3.5
-4
-4.5
-5
-5.5
-3.5
-4
-4.5
-5
-5.5
-6
-6
-6
-6
-6.5
-6.5
-6.5
-6.5
-7
-7
-7
-7
-7.5
-7.5
-7.5
-7.5
-8
-8
-8
-8
-8.5
-8.5
-8.5
-8.5
band1
band2
band3
band4
Fig. 7. Theoretical spectrum of VOL1 complex and the related transition of each bands.
Table 10
The electron density of different transitions.
Band 1
Ring 1 (%)
Ring 2 (%)
C@N (%)
V (%)
104a
108a
104b
107b
34
27
33
29
43
17
44
17
17
42
17
44
1
4
1
2
Band 2
O(Schiff
C@N (%)
V (%)
105a
109a
106a
109a
105b
108b
24
4
28
4
28
3
6
45
8
45
8
46
24
4
3
4
1
3
Band 3
107a
109a
106a
109a
106b
107b
19
4
28
3
28
1
7
45
8
42
8
44
38
4
3
4
1
2
Band 4
107a
109a
106a
108a
106b
107b
19
4
28
3
28
4
base)
(%)
7
45
8
42
8
44
38
4
3
4
1
2
For VOL3�H2O, a mass loss (calc. 3.1%, found 2.5%) occurred
within the temperature range 293–370 °C corresponding to the
loss of the coordinated water molecule. At the temperature range
370–595 °C a mass loss (calc. 64.4%, found 62%) occurred due to
the elimination of a C14H8O2Br2 group. The third step of the thermal decomposition was assigned to the loss of rest of the organic
part along with the metal oxide.
The weight loss of VOL4�H2O takes place in two steps. The first
step (calc. 36%, found 39%) occurs between 335–447 °C due to
the loss of the coordinated water with an organic part including
C8H6NOCl. The second step was assigned to the loss of the rest of
the ligand along with the metal oxide.
Kinetic aspects
The kinetic parameters of decomposition of the complexes (the
activation energy Ea and the pre-exponential factor A#) were calculated using the Coats–Redfern Eq. (1) [18]:
log
�
�
� logð1 � aÞ
T
2
¼ log
�
�
AR
2RT
E
�
1�
bE
E
2:303RT
ð1Þ
ðw0 �wt Þ
where a ¼ ðw
, w0 is the initial mass of the sample, wt is the mass
0 �wf Þ
of the sample at the temperature T, wf is the final mass at the temperature at which the mass loss is approximately unchanged, b is
the heating rate and R is the gas constant. In the present case, a plot
of left hand side (L.H.S.) of this equation against 1/T gives a straight
�632
M. Asadi et al. / Spectrochimica Acta Part A: Molecular and Biomolecular Spectroscopy 136 (2015) 625–634
Fig. 8. TG/DTA spectra of VOL2�H2O.
(1) According to the Coats–Redfern plots the kinetics of thermal
decomposition of studied complexes is of the first-order in
all stages.
(2) For all the complexes, free energy of activation for each stage
is larger than that for previous one. This is probably due to
the unstable intermediate of the proceeding stages.
(3) The values of Ea > 10 show that all complexes have good
thermal stability.
The various kinetic parameters calculated are given in Table 11.
Electrochemical measurements
2
Fig. 9. Coats–Redfern plot of VOL �H2O complex, step 2 (418–498 °C).
line (Fig. 9), which slopes and intercept are used to calculate the
kinetics parameters by the least square method. The goodness of
fit was checked by calculating the correlation coefficient. The other
systems and their steps show the same trend. The entropy of
activation S# was calculated using Eq. (2):
A¼
KT s S# =R
e
h
ð2Þ
where K, h and Ts are Boltzmann constant, Planck constant and the
peak temperature, respectively. The enthalpy H# and free energy of
activation G# were calculated using Eqs. (3) and (4):
Ea ¼ H# þ RT
ð3Þ
G# ¼ H# � TS#
ð4Þ
By comparing the kinetic parameters of all complexes, the
following results can be obtained:
A typical cyclic voltammogram of VOL2�H2O complex is shown
in Fig. 10. An oxidation peak is observed at about �0.797 V.
VOL2�H2O is oxidized to the mono cation [VOL2�H2O]+. The electron
is removed from the nonbonding orbitals and the V(V) complex
is formed. Upon reversal of the scan direction, the V(V) complex
is reduced to V(IV) at lower potentials. Multiple scans resulted in
nearly identical cyclic voltammograms, thereby showing that the
five coordinate geometry is stable in both oxidation states, at least
on the cyclic voltammetry time scale. These results revealed that
the redox process of all vanadyl Schiffbase complexes is the
one-electron transfer reaction. The oxidation potentials for the
different complexes are set out in Table 12. The formal potentials
(E1/2(IV M V)) for the V(IV/V) redox couple were calculated as the
average of the cathodic (Epc) and anodic (Epa) peak potentials of
this process. In order to investigate the effect of functional groups
of the Schiff base ligands on the oxidation potential, a series of the
vanadyl Schiff base complexes were studied by the cyclic voltammetry method. The results show that the anodic peak potential
(Epa) varies as it can be expected from the electronic effects of
the substituents at position 5. Thus, Epa becomes more positive
showing the following trend: MeO < H < Br < Cl. The strong
electron-withdrawing effects stabilize the lower oxidation state
while the electron donating groups have a reverse effect [19].
�633
M. Asadi et al. / Spectrochimica Acta Part A: Molecular and Biomolecular Spectroscopy 136 (2015) 625–634
Table 11
Thermal and kinetic parameters of decomposition for vanadyl complexes. Also note that the tables are renumbered sequentially.
Compounds
E# (kJ mol�1)
DT (°C)
S# (J mol�1 K�1)
H# (kJ mol�1)
G# (kJ mol�1)
4.3 � 10
738.77
226.21
�105.05
�197.79
�210.56
88.21
31.43
10.13
38.45
96.58
170.56
140.88
36.30
27.94
4.6 � 1011
669.73
162.62
�27.81
�198.36
�213.28
135.64
30.16
19.27
10.08
92.36
164.51
153.48
76.71
19.77
7.4 � 1012
5.3 � 105
504.93
�4.73
�143.42
�203.66
148.23
70.106
11.03
1.84
74.78
158.87
1
VOL �H2O
348–393
430–542
600–925
93.51
37.76
19.13
VOL2�H2O
312–392
418–498
640–900
VOL3�H2O
293–370
475–595
650–900
A# (s�1)
7
Thermodynamic interpretations
The average formation constant of the complexes were calculated in the selected range of spectra by using the SQUAD 84
program [20], designed to calculate values for the formation
constants of the proposed reaction model (Eq. (5)), by employing
a non-linear, least-squares approach.
H2 L þ VOðacacÞ2 $ ½VOL� þ 2Hacac
Fig. 10. Cyclic voltammogram of VOL2�H2O, in acetonitrile at room temperature.
Scan rate: 0.1 V/s.
ð5Þ
The free energy change DG° values of the formed complexes were
calculated from DG° = �RT ln Kf at 25 °C (Table 13). As an example,
the changes in the absorbance spectrum of one ligand (L4) at different molar ratio of added VO(acac)2 in methanol solvent is shown in
Fig. 11.
The stability of metal complexes with different ligands
decreases in sequence:
5-OMe > 5-H > 5-Br > 5-Cl
Table 12
Redox potential data of vanadyl complexes in acetonitrile solution.
Compounds
Epa
VOL1�H2O
VOL2�H2O
VOL3�H2O
VOL4�H2O
�0.766
�0.797
�0.756
�0.746
Epc
(IV?V)
E1/2
(V?IV)
�0.887
�0.927
�0.877
�0.867
�0.827
�0.862
�0.817
�0.807
Table 13
The formation constants, log Kf, and the free energy change, DG°, for the complexation
of Schiff base ligands with VO2+ in methanol at 25 °C (I = 0.10 NaClO4).
Schiff base ligand
1
L
L2
L3
L4
Log Kf
DG° (kJ mol�1)
4.12
8.01
3.19
2.26
�23.51
�45.70
�18.20
�12.89
(±0.08)
(±0.05)
(±0.05)
(±0.06)
(±0.42)
(±0.23)
(±0.25)
(±0.34)
which corresponds to the expected electronic effects of the substituents at positions 5 of Schiff base ligands, i.e. to the order of an
increase in both electron-withdrawing and p-acceptor power of
the substituents and to the decrease in donor ability of the ligand
groups. For example, the 5-OMe substituted ligand acts as a good
r-donor because of the high electron releasing power of the
OMe groups in the para position in L2 comparing with the nonsubstituted L1 and electron-withdrawing groups in para position
(L3, L4). The withdrawing functional groups make the Schiff base a
poor donor ligand and decrease the formation constants while the
electron donor groups increase the formation constants. Therefore,
the ligands having Br and Cl groups have the smallest formation
constants while the ligands with OMe group have the highest ones
[21,22].
Conclusions
In this work a series of new VO(IV) complexes of tetradentate
N2O2 Schiff base ligands was synthesized and characterized and
subjected to study of thermodynamic, electrochemistry and kinetics. VOL1�DMF complex was also studied with single-crystal X-ray
analysis. The results, the following conclusions have been drawn:
Fig. 11. The electronic spectra of L4 (1.5 � 10�5 M) titrated with various concentrations of VO(acac)2 (1.0 � 10�3–7.0 � 10�2 M) at I = 0.10 M (NaClO4) and at 25 °C
in MeOH.
(1) X-ray crystallography confirmed formation of the VOL1�DMF
complex. In the crystalline state it has a non-centrosymmetric structure with one symmetry independent molecule of
the complex. Moreover, formation of another compound
[VO]X was confirmed which was not a Schiff base complex.
(2) By comparing the kinetic parameters of thermal decomposition of the complexes, the following results were obtained:
� According to the Coats–Redfern plots the kinetics of thermal decomposition of the complexes is of the first-order
in all stages.
�634
M. Asadi et al. / Spectrochimica Acta Part A: Molecular and Biomolecular Spectroscopy 136 (2015) 625–634
� The free energy of activation for each following stage is
larger than the previous one. This is probably due to
the unstable intermediate of the proceeding stages.
� The values of activation energy, Ea > 10, show that the
complexes have good thermal stability.
(3) Electronic factors influence the values of formation constants for the complexes with various substituents on the
aldehyde ring. The stability of metal complexes with different ligands decreases in sequence:
5-OMe > 5-H > 5-Br > 5-Cl
(4) From analysis of cyclic voltammograms it can be concluded
that the anodic peak potential, Epa, for ligands with electron
withdrawing substituents is more positive than for ligands
with electron donating substituents. This is in agreement
with the formation constant, log Kf, trend for these complexes. It can be concluded that compounds with electron
withdrawing substituents are not liable to lose or donate
their electrons.
Acknowledgements
We are grateful to the Shiraz university research council for its
financial support. The project P204/11/0809 of the Grant agency of
the Czech Republic supported the crystallographic part of the work.
Appendix A. Supplementary material
Supplementary data associated with this article can be found, in
the online version, at http://dx.doi.org/10.1016/j.saa.2014.09.076.
References
[1] M. Bagherzadeh, M. Amini, J. Coord. Chem. 63 (2010) 3849–3858.
[2] P. Frank, R.M.K. Carlson, E.J. Carlson, K.O. Hodgson, Coord. Chem. Rev. 237
(2003) 31–39.
[3] R.E. Berry, E.M. Armstrong, R.L. Beddes, D. Collison, S.N. Ertok, M. Helliwell, C.D.
Garner, Ang. Chem. Int. Ed. 38 (1999) 795–797.
[4] A.G.J. Ligtenbarg, R. Hage, B.L. Feringa, Coord. Chem. Rev. 237 (2003) 89–101.
[5] S.I. Pillai, S.P. Subramanian, M. Kandaswamy, Eur. J. Med. Chem. 63 (2013)
109–117.
[6] Agilent Technologies. CrysAlis PRO, Yarnton, Oxfordshire, England, 2012.
[7] L. Palatinus, G. Chapuis, J. Appl. Cryst. 40 (2007) 786–790.
[8] V. Petricek, M. Dusek, L. Palatinus, Jana2006, Structure Determination Software
Programs, Institute of Physics, Czech Republic, 2006.
[9] M. Asadi, M. Mohammadikish, Kh. Mohammadi, Cent. Eur. J. Chem. 8 (2) (2010)
291–299.
[10] X. Wang, X.M. Zhang, H.X. Liu, Trans. Met. Chem. 19 (1994) 611–613.
[11] P. Plitt, H. Pritzkow, R. Kramer, Dalton Trans. (2004) 2314–2320.
[12] M. Tumer, H. Koksal, M.K. Sener, S. Serin, Synth. React. Inorg. Met.-Org. Nano
Met. Chem. 26 (1996) 1589–1598.
[13] D.X. West, A.A. Nassar, Trans. Met. Chem. 24 (1999) 617–621.
[14] M.H. Koksal, M.K. Sener, S. Serin, Trans. Met. Chem. 24 (1999) 414–420.
[15] Y.L. Zhang, W.J. Ruan, X.J. Zhao, H.G. Wang, Z.A. Zhu, Polyhedron 22 (2003)
1535–1545.
[16] R.B. Xiu, F.L. Mintz, X.Z. You, R.X. Wang, Q. Yue, Q.J. Meng, Y.J. Lu, D.V. Derveer,
Polyhedron 15 (1996) 4585–4591.
[17] B. Bosnich, J. Am. Chem. Soc. 90 (1968) 627–632.
[18] A.W. Coats, J.P. Redfern, Nature 201 (1964) 68–69.
[19] A.H. Kianfar, M. Paliz, M. Roushani, M. Shamsipur, Spectrochim. Acta Part A
Mol. Biomol. Spectrosc. 82 (2011) 44–48.
[20] D.L. Leggett, Computational Methods for the Determination of Formation
Constant, Plenum Press, New York, 1985.
[21] M. Asadi, Kh. AeinJamshid, A.H. Kianfar, J. Coord. Chem. 61 (2008) 1115–1126.
[22] M. Asadi, Kh. AeinJamshid, A.H. Kianfar, Inorg. Chim. Acta 360 (2007) 1725–
1730.
�
 Václav Eigner