This document is currently being converted. Please check back in a few minutes.
See discussions, stats, and author profiles for this publication at: https://www.researchgate.net/publication/7496567
In Vivo Particle Uptake by Airway Macrophages
in Healthy Volunteers
ARTICLE in AMERICAN JOURNAL OF RESPIRATORY CELL AND MOLECULAR BIOLOGY · MARCH 2006
Impact Factor: 3.99 · DOI: 10.1165/rcmb.2005-0373OC · Source: PubMed
CITATIONS
READS
34
21
6 AUTHORS, INCLUDING:
Neil E Alexis
John Lay
107 PUBLICATIONS 2,434 CITATIONS
63 PUBLICATIONS 1,023 CITATIONS
University of North Carolina at Chapel Hill
SEE PROFILE
University of North Carolina at Chapel Hill
SEE PROFILE
Kirby Zeman
William D Bennett
63 PUBLICATIONS 1,962 CITATIONS
107 PUBLICATIONS 3,030 CITATIONS
University of North Carolina at Chapel Hill
SEE PROFILE
University of North Carolina at Chapel Hill
SEE PROFILE
Available from: Kirby Zeman
Retrieved on: 04 February 2016
In Vivo Particle Uptake by Airway Macrophages in
Healthy Volunteers
Neil E. Alexis, John C. Lay, Kirby L. Zeman, Marianne Geiser, Nadine Kapp, and William D. Bennett
Center For Environmental Medicine, Asthma and Lung Biology, University of North Carolina, Chapel Hill, North Carolina;
and Institute for Anatomy, University of Bern, Bern, Switzerland
We combined two techniques, radiolabeled aerosol inhalation delivery and induced sputum, to examine in vivo the time course of
particle uptake by airway macrophages in 10 healthy volunteers.
On three separate visits, induced sputum was obtained 40, 100,
and 160 min after inhalation of radiolabeled sulfur colloid (SC)
aerosol (Tc99 m-SC, 0.2 m colloid size delivered in 6-m droplets).
On a fourth visit (control) with no SC inhalation, induced sputum
was obtained and SC particles were incubated (37ⴗC) in vitro with
sputum cells for 40, 100, and 160 min (matching the times associated with in vivo sampling). Total and differential cell counts were
recorded for each sputum sample. Compared with 40 min (6 ⫾ 3%),
uptake in vivo was significantly elevated at 100 (31 ⫾ 5%) and 160
min (27 ⫾ 4%); both were strongly associated with the number of
airway macrophages (R ⫽ 0.8 and 0.7, respectively); and the number
and proportion of macrophages at 40 min were significantly (P ⬍
0.05) elevated compared with control (1,248 ⫾ 256 versus 555 ⫾
114 cells/mg; 76 ⫾ 6% versus 60 ⫾ 5%). Uptake in vitro increased
in a linear fashion over time and was maximal at 160 min (40 min,
12 ⫾ 2%; 100 min, 16 ⫾ 4%; 160 min, 24 ⫾ 6%). These data suggest
that airway surface macrophages in healthy subjects rapidly engulf insoluble particles. Further, macrophage recruitment and phagocytosismodifying agents are factors in vivo that likely affect particle uptake
and its time course.
Keywords: airway macrophages; induced sputum; mucociliary clearance;
radiolabeled particles
Over the past several years, induced sputum has become a
method of choice to noninvasively assess markers of airways
inflammation in human subjects. We have previously demonstrated that when compared with bronchoalveolar lavage
(BAL)-derived cells, sputum cells (macrophages, monocytes,
and neutrophils) are equally viable and functional, with respect
to phagocytic capacity, oxidative burst generation, and expression of cell-surface receptors associated with inflammation and
innate host defense (1). We also showed, through the use of
radiolabeled aerosol bolus delivery techniques, that induced sputum retrieves samples selectively from the surfaces of the bronchial airways as compared to peripheral airways (2). In healthy
individuals, the predominant cell type recovered in sputum samples are macrophages, followed by neutrophils (3). Due to their
surface location, these cells represent one of the first lines of
cellular defense against inhaled pathogens from the external
environment. For this reason, sputum cells are ideal for under-
(Received in original form October 4, 2005 and in final form October 28, 2005)
Supported by cooperative agreement CR-829522 from the U.S. Environmental
Protection Agency (USEPA); RO1HL-62624.
Correspondence and requests for reprints should be addressed to Neil Alexis,
Ph.D., Center for Environmental Medicine, Asthma, and Lung Biology, University
of North Carolina at Chapel Hill, 104 Mason Farm Rd., Chapel Hill, NC 275997310. E-mail: Neil_Alexis@med.unc.edu
Am J Respir Cell Mol Biol Vol 34. pp 305–313, 2006
Originally Published in Press as DOI: 10.1165/rcmb.2005-0373OC on November 4, 2005
Internet address: www.atsjournals.org
standing how airway surface phagocytes interact with inhaled
particles.
Traditionally, the bronchial airways in human volunteers have
been a difficult region of the lung to examine in a noninvasive
fashion. Hence, both quantitative and qualitative data to characterize the cellular and biochemical events that occur within them
is limited. As a result, information on the functional properties
of phagocytic cells (in particular their ability and time course
for taking up particles), and the effect of macrophage numbers
on these parameters, is lacking, especially when it comes to
examining these properties in a dynamic, human in vivo model.
Experimental techniques such as electron microscopy for in situ
studies have been used mainly in animal models to examine
phagocytic properties of lung cells (4–8). These studies have
provided valuable information on the properties of lung phagocytes, although they require the use of special isolation and
fixation techniques that prevent the examination of events in
“real time.” A recent review (9) of the morphologic aspects of
particle uptake by lung phagocytes in hamsters (10–12) and
rats (13) show that engulfment of inhaled particles by airway
macrophages is rapid, occurring as soon as 40 min after inhalation, and the process is essentially complete within 24 h. Macrophage recruitment to the site of particle deposition has also been
noted to be rapid in these animal models, yet in hamsters, only
a small proportion of the recruited cells (12–15%) are actively
engaged in the phagocytosis of particles (7). These same in vivo
analyses have not been conducted in humans after actual inhalation of particles. To better understand the etiologic processes
of airway diseases caused by inhaled aerosols, it is important to
first investigate the interaction between airway phagocytes and
inhaled particles in healthy volunteers under normal homeostatic conditions.
The purpose of this study was to examine particle uptake by
airway surface phagocytes, their time course of action, and the
association between the number of macrophages and particle
uptake in healthy volunteers. To accomplish this, we combined
the use of induced sputum, a method that selectively retrieves
macrophages and neutrophils from the surfaces of the bronchial
airways in healthy individuals, with radiolabeled aerosol bolus
delivery, a method that preferentially delivers, via controlled
inhalation, traceable particles to the bronchial airways (2). In
addition, we examined the difference between in vivo particle
uptake after in vivo exposure (inhalation) versus in vitro particle
uptake after in vitro exposure, as a means to understand the
effect of the airway milieu on cell–particle interactions. Finally,
we employed electron microscopy, fluorescence microscopy, and
flow cytometry in ancillary studies to investigate the nature of
the particle/cell association.
This study was approved by the Committee on the protection
of the Rights of Human Subjects as the University of North
Carolina (Chapel Hill, NC).
MATERIALS AND METHODS
Experimental Design
The experimental design is shown schematically in Figure 1. The study
design comprised four distinct components: (1 ) inhalation of radiolabeled
306
AMERICAN JOURNAL OF RESPIRATORY CELL AND MOLECULAR BIOLOGY VOL 34
2006
Figure 1. Schematic of the experimental design and
study protocol. A timeline is shown indicating the three
different time points that induced sputum was
performed after cessation of radiolabeled aerosol
inhalation.
particles (with deposition targeted to the central airways) and subsequent monitoring of mucociliary clearance (MCC) via ␥ scintigraphy;
(2 ) assessment of in vivo uptake of inhaled radiolabeled particles by
airway phagocytes recovered from induced sputum at specific time
points after aerosol inhalation; (3 ) reproduction of the in vivo uptake
protocol in vitro by co-incubating radiolabeled particles with sputum
phagocytes for the same durations as the in vivo incubations; and (4 )
conducting of ancillary studies on selected sputum samples to establish
the nature of the particle/cell association (i.e., particle internalization
versus membrane adherence) using flow cytometry (FCM), epifluorescence microscopy (EFM), and electron microscopy (EM) techniques.
All 10 (n ⫽ 10) subjects were studied on three separate occasions,
and 7 (n ⫽ 7) of the 10 were studied on a fourth separate occasion.
All subjects were randomly assigned to their study occasions. On three
occasions, subjects inhaled a radiolabeled (Tc99-SC) aerosol with subsequent monitoring of MCC and collection of induced sputum. Each of
these sessions differed only as to when induced sputum was performed
after cessation of radiolabeled aerosol inhalation. Induced sputum was
performed either immediately, at 60, or 120 min after aerosol inhalation.
Since the induced sputum procedure itself took 40 min to perform,
40 min is included in the induced sputum measurement times (min)
referred to in this manuscript. Hence, the immediate measurement
time is labeled 40 min, and the 60- and 120-min measurement times
are 100 min and 160 min, respectively (Figure 1). During the fourth
session, subjects (n ⫽ 7) did not inhale the radiolabeled aerosol, but
underwent the induced sputum procedure to provide sputum cells for
in vitro evaluation of particle uptake, as well as cells for FCM, EFM,
and EM data.
Subjects
Ten healthy, nonsmoking volunteers aged 21 to 53 yr (5 male, 5 female)
were recruited to participate in the study. All subjects received a medical
exam on a separate screening day before beginning the study. Female
subjects provided a urine sample for pregnancy testing. A positive
pregnancy test resulted in exclusion from the study. All subjects had
no history of chronic lung disease and had been free of upper or lower
respiratory tract infections for 4–6 wk before beginning the study. All
subjects had a forced expiratory volume in 1 s (FEV1) of ⬎ 80%
(91–118%) of predicted values for a population of similar height, weight,
sex, age, and race. Informed written consent was obtained from all
subjects before their participation in the study.
Radiolabeling Technique and Aerosol Generation
Radiolabeled (Tc99 m) sulfur colloid (SC, 5 mCi) was prepared by
using TechneScan Sulfur Colloid Kits (CIS-Sulfur Colloid; CIS-US,
Inc., Bedford, MA) following the procedure provided by the manufacturer. The binding of TC99 m to SC was always ⬎ 99% as determined
by paper chromatography. The resultant Tc99 m-SC particles are submicronic, with a number mean diameter of 0.22 m and geometric
standard deviation (GSD) of 1.75 (14). Two milliliters of the particle
suspension were placed in a modified Devilbiss 646 jet nebulizer
(Devilbiss, Somerset, PA) and pulsed at 40 psi to generate 6-m MMAD
polydisperse (GSD ⫽ 2.40) aerosol droplets (i.e., aqueous particles
containing the smaller suspended Tc99 m-SC particles). Because the
nebulizer was located close to the subject’s mouth, there was negligible
evaporation and the aerosol was deposited on the airway surface as
aqueous droplets and not as dry particles. After deposition, the Tc99
m-SC particles suspended within the droplets dissociated into 0.22-m
particles.
Inhalation of Radiolabeled Aerosol Boluses
A single-breath nitrogen washout test and a Xenon 133 equilibrium
scan (rebreathing 1 mCi/liter) (Malinkrodt Medical, St. Louis, MO)
were performed on the first visit before radiolabeled aerosol inhalation
to determine anatomic dead space (ADS) and to determine the lung
outline and volume of the lung, respectively (2).
Aerosols of radiolabeled SC particles were generated and delivered
to the subject using a central airway deposition method that has been
previously described in detail (2). Briefly, a small (40-ml) bolus of
aerosolized particle suspension was delivered to shallow volumetric
front depths (VFDs) in the lung of the subjects. By computer-controlled
activation of the compressed air source used to nebulize the particle
suspension, the boluses were delivered to a VFD of ⵑ 0.6 anatomic
dead space (ADS) for each subject (mean ⫾ SD VFD ⫽ 95 ⫾ 22 ml,
mean ⫾ SD ADS ⫽ 154 ⫾ 33 ml). The Fowler ADS was measured
by single-breath nitrogen washout in the first six subjects, but due to
equipment failure (i.e., the mass spectrometer) ADS was estimated in
the last four subjects from a regression equation for ADS versus VC
(vital capacity) derived from the first six subjects and those of our
previous study (2) (r ⫽ 0.88). A photometer and pneumotachograph
(Fleisch #1; Fleisch, Lausanne, Switzerland) was placed between the
subject’s mouthpiece and the nebulizer which measured the relative
aerosol concentration and respired volumes for determining the VFD of
each inhaled bolus. Despite potential errors in an individual’s measured
ADS, the VFD was fixed within an individual for each of the three
study days. After inhalation of each bolus under controlled conditions
(500 ml tidal volume at 125 ml/s flow) the subject held his/her breath
for 5 s, followed by a rapid exhalation to maximally deposit the particles
on the bronchial/conducting airway surface. In general, inhalation of
20–30 boluses over a 15-min period were required to deliver a sufficient
activity to the lungs (ⵑ 20 Ci), as monitored by a single crystal NaI
scintillation detector placed at the subject’s back.
Mucociliary Clearance Measurements
Mucociliary clearance (MCC) was measured by ␥ scintigraphy commencing immediately after SC aerosol inhalation on all three visits.
Subjects rinsed their mouth with water after SC inhalation, then sat
with their back to the ␥ camera (Elscint large-field-of view, SP-4
equipped with a high sensitivity collimator; Elscint, Haifa, Israel) for
two initial 2-min scans and then remained seated in front of the camera
for 2 h to monitor MCC. Monitoring of MCC was interrupted only for
brief periods of time to perform the cough phase of the sputum induction procedure. MCC measurements resumed immediately after sputum
inductions (i.e., at 40, 100, and 160 min; see Figure 1). All subjects
returned to the laboratory the next day for a 30-min ␥ camera scan to
assess retention of particles at 24 h after SC inhalation. The longer
scan at the 24-h time point provided better counting statistics after the
3 to 4 half-life decay of Tc99 m.
Analysis of Deposition Patterns, Particle Clearance, and
Normalization of Sputum Counts
To assess the degree of central (C) versus peripheral (P) airway deposition within the lung for all three study days in each subject, we calculated
a C/P ratio of Tc99 m activity, normalized to the Xenon 133 equilibrium
Alexis, Lay, Zeman, et al.: In Vivo Particle Uptake by Airway Macrophages
scan, on the initial deposition scan after Tc99 m-SC aerosol inhalation
(2). To eliminate activity associated with the stomach in the left P
region, it was necessary to exclude the lower left lung base when creating
the left lung region-of-interest. This should have had no effect on our
intrasubject C/P comparisons, since the same regions were used for all
study days and the C/P was normalized to associated lung volumes (Xe
133 equilibrium) in each case. A rectangular region bordering the right
and left lung (defined by the Xe133 equilibrium scan) was used to
determine, by computer analysis, the whole lung retention/clearance
as a percent of the initial counts (background and decay-corrected)
over the ␥ camera scanning period of 2 h and at 24 h. Again care was
taken to assure that the activity in the stomach was excluded from the
left lung region.
Sputum Induction
On three separate study visits, induced sputum was performed over a
40-min interval, beginning either immediately, at 60, or at 120 min after
inhalation of the Tc99-SC aerosol (Figure 1). On a separate (fourth)
visit, induced sputum was performed without prior inhalation of the
radio-aerosol, to obtain sputum cells for in vitro studies, FCM, EFM,
and EM measurements. The induced sputum procedure has been previously described in detail (2). Briefly, subjects underwent two 12-min
periods of hypertonic saline (5%) inhalation. At the end of each 12-min
inhalation period, subjects performed a three-step cleansing procedure
before cough attempts and sample expectoration, to minimize squamous epithelial cell contamination of the expectorated sample. The
cleansing procedure involved rinsing the mouth with water, scraping
the back of the throat and expectorating the waste (but not coughing),
and blowing the nose to reduce post-nasal drip contamination. After
expectoration of sputum into a specimen cup, the subject’s FEV1 was
monitored as a safety endpoint and compared with pre–sputum induction FEV1 values. The entire procedure required 40 min to complete.
Sputum Processing
Immediately after sputum induction, radioactivity within the unprocessed total sputum sample was measured by placing the sample container a specified standard distance (30 cm) from the face of a single
crystal NaI scintillation detector for a 60-s count of radioactivity. Samples were then processed as has been previously described (1, 2). After
recording the weight of the entire sputum sample, a cell-enriched
“select” sample was obtained using thumb forceps to pluck visible
clumps of cells and cell-rich mucus “plugs” from the raw sample to
separate them from the noncellular portions of the sample. The nonselected portion of the sputum sample was not processed because these
secretions typically contain nonphagocytic epithelial cells (⬎ 90% squamous epithelial cells) and are considered to not be lung-associated, but
rather originate from the oral-pharyngeal region. The weight of the
select sample was recorded and radioactivity in the select sample was
then measured as described. To break down mucus and extract sputum
cells from the mucoid sputum sample, a volume of 0.1% dithiothrietol
(DTT, Sputolysin; Calbiochem, San Diego, CA) in Dulbecco’s phosphate-buffered saline (DPBS), equal to four times the volume of the
selected sample, was added to the sample and tumbled for 15 min.
After 15 min, an additional volume of DPBS (4 ⫻ volume of select
sample) was added, resulting in a final 1:9 dilution of the select sample.
The diluted sample was then counted as above, centrifuged (500 ⫻ g,
10 min), and the supernatant carefully transferred to a separate container using a micropipette to remove as much as possible without
disturbing the cell pellet. The radioactivity in the pellet and supernatant
was then counted separately as above and the cell pellet was then
resuspended in 1 or 2 ml of Hanks’ balanced salt solution (HBSS) and
filtered through 54-m mesh gauze to remove contaminating squamous
cells. A 10-l aliquot was diluted 1:2 with the vital stain, Trypan Blue,
and counted in a Neubauer hemacytometer to quantify cells and assess
viability. The cells were then diluted to a final concentration of either
1 or 2 ⫻ 106 cells/ml for in vitro assays (depending on the assay). Differential cell counts were performed by light microscopy of cytocentrifuged
cell preparations on glass slides and counting 300–400 leukocytes at
⫻800 magnification. Differential cell counts derived from sputum samples obtained for the in vitro phagocytosis assays of radiolabeled SC
served as control values.
307
Assessment of In Vivo Particle Phagocytosis
The in vivo phagocytosis of SC particles by airway phagocytes was
estimated by quantifying the radioactivity (as described above) associated with the cell pellet and that remaining in the supernatant after
centrifugation of the DTT-treated select sputum sample. The percentage of radiolabeled particles left in the supernatant (% supernatant)
after centrifugation was determined as follows:
% Supernatant ⫽
(Supernatant counts) ⫻ 100%
Pellet ⫹ Supernatant counts
(Eq. 1)
A correction factor was applied to all % supernatant values to account
for a small proportion of free radiolabeled particles that tended to spin
down with the cell pellet after low-level centrifugation (500 ⫻ g, 10 min).
The correction factor was based on a series of separate in vitro experiments in which the labeled SC particles were added to sputum cell
suspensions after processing (i.e., after reduction with DTT [see below])
and immediately centrifuged (500 ⫻ g, 10 min). The mean percent of
particles remaining in the supernatant for several such experiments
was 85 (i.e., 15% of particles were spun down with cells). This mean
percentage was used to normalize the % supernatant (Eq. 1) to approximate the true percentage of particles that were actually cell-associated
(i.e., % uptake) as follows:
% Uptake ⫽ 100 ⫺
冢100
⫻ % Supernatant
85
冣
(Eq. 2)
Although some radioactivity was detected in the nonselected sample
portions (on average ⬍ 15%), this likely resulted from non–cell-associated
free SC particles. Thus, their exclusion from uptake calculations on
the selected sample may have resulted in a modest overestimation
(maximum of 15%, as a relative amount) of uptake. Separate experiments
determined that DTT had no effect on the integrity of the Tc99 m label
to remain affixed to the SC particles.
Normalization of Sputum Radioactivity
The radioactivity measured in the select sputum samples (described
above) by the scintillation detector was also dependent on the total
amount of activity initially deposited and still remaining in the lung at
the time of sputum induction. To determine if comparable sampling of
particles occurred on the three study days within a given subject, it was
necessary to normalize these sputum counts relative to the amount of
activity in the lung just before induction of sputum. Calculation of
normalized sputum counts (NspC) was performed as follows:
NspC ⫽
measured select sputum counts whole
lung counts immediately prior to IS
(Eq. 3)
The whole lung ␥ camera counts were determined from the rectangular regions bordering the left and right lungs (described above).
In Vitro Assessment of Radiolabeled SC Particle Uptake by
Sputum-Derived Phagocytes
For comparison to in vivo particle uptake by airway phagocytes, we
performed particle uptake experiments in vitro, using sputum-derived
cells from 7 of 10 of the same subjects, which had provided in vivo–
derived data. For these experiments, the subjects did not inhale radiolabeled aerosol. Immediately after sample processing, 5 ⫾ 2 drops
(5–20 Ci) of Tc99 m-SC particle suspension was added in vitro to a
suspension of sputum cells (1 ⫻ 106cells/ml in HBSS). The cell/particle
suspension was then gently mixed and subsequently incubated (37⬚C)
with periodic mixing. To simulate the time frames for collection of
sputum for in vivo uptake measurements, equal aliquots (one third of
total volume) of the suspension were removed at 40, 100, and 160 min
(corresponding to the in vivo “incubation” intervals for the same individual), each time after gently mixing the incubating suspension. These
were centrifuged (500 ⫻ g, 10 min) to obtain the cell pellet and supernatant fractions, the latter carefully pipetted into a naı̈ve test tube. Counts
of radioactivity were measured on both the cell pellet and supernatant
fractions as described and the % uptake calculated (Eq. 2)
308
AMERICAN JOURNAL OF RESPIRATORY CELL AND MOLECULAR BIOLOGY VOL 34
2006
Fluorescence Microscopy and Flow Cytometric Evaluation of
In Vitro Particle Uptake
a percentage of total macrophages (based on 200 cells counted per
slide).
While our uptake measures using Tc99 m-SC showed the particles to
be associated with the cell pellet, we could not differentiate whether
or not they had been internalized or were merely attached to the cell
surface. To investigate the nature of the particle/cell association, we
employed nonradioactive, fluorochrome-labeled SC particles, FCM,
and EFM to perform separate in vitro experiments using sputum cells
from two subjects. A suspension of SC was prepared using a kit (CISSulfur Colloid; CIS-US) in accordance with the manufacturer’s instructions, except that 1 ml normal saline solution (nonradioactive) was
substituted for the radioactive technetium (Tc99 m) label. The suspended
sulfur colloid particles were labeled with fluorescein isothiocyanate
(FITC) using a Fluoreporter FITC Labeling Kit (Molecular Probes,
Eugene, OR) in accordance with the manufacturer’s instructions.
A 200-l aliquot of the sulfur colloid solution was labeled using a dye
to protein molecular ratio of 50, assuming a MWprotein of 330 kD for
gelatin. One hundred microliters of FITC-labeled SC particle suspension was incubated in a polypropylene tube with 100 l of a suspension
(2.0 ⫻ 106 cells/ml) of sputum-derived leukocytes in HBSS at 37⬚C for
1 h. After incubation, cells were fixed by adding 200 l of 2% formaldehyde
(EM grade; Electron Microscopy Sciences, Ft. Washington, PA) to the
mixture. EFM was performed using appropriate filters on a Zeiss
Axiovert-10 fluorescence microscope (Zeiss, Thornwood, NY), using
unstained and uncoverslipped cytocentrifuged cell preparations. Control slides were prepared using cell suspensions incubated without SC.
Flow cytometry was performed on these same cells to further evaluate phagocytosis of SC particles. The procedure for FCM examination
of sputum leukocytes has been previously described in detail (1). Briefly,
flow cytometry was performed with a FACSORT (Becton Dickinson,
Franklin Lakes, NJ) using an Argon-ion laser (wavelength ⫽ 488 nm).
Gain and amplitude settings were set to accommodate sputum samples,
which allowed for the establishment of reference gates for leukocyte
identification. Gating of viable macrophages, monocytes, neutrophils,
and lymphocytes in sputum was based on light scatter (FSC/forward
scatter, SSC/side scatter) properties and positive cell surface expression
of CD45 (pan-leukocyte marker), with further confirmation by the
expression of CD16 (neutrophils), HLA-DR/CD14 (mononuclear
phagocytes), and CD3 (lymphocytes). All fluorescent antibodies were
obtained from a single commercial source (Beckman Coulter, Inc.,
Miami, FL: CD45 cat# IM20782, CD14 cat# IM0650, CD16 cat# IM1238
and CD3 cat# IM1282). Phagocytosis of FITC-SC was assessed by
measuring changes (histogram analysis) in mean fluorescence intensity
(MFI) of SC-FITC–exposed sputum phagocytes and a shift in light
scatter properties of phagocyte populations as compared with controls.
Statistical Methods
Electron Microscopy and Electron Energy-Loss Spectroscopy
To further establish the intracellular location of SC particles, selected
samples of sputum leukocytes obtained after inhalation of Tc99
m-SC were examined by energy filter transmission electron microscopy
(EFTEM) and electron energy loss spectroscopy (EELS). Chemically
fixed cells (2% formaldehyde, EM grade) were embedded in epon, cut
into ultrathin sections of ⬍ 50 nm, transferred onto uncoated 600-mesh
copper grids, and post-stained with uranyl acetate and lead citrate.
Ultrathin sections were examined in a LEO 912 transmission electron
microscope equipped with an in-column energy filter for elemental
microanalysis. For elemental identification of sulfur, the L2/3-edge at
164.8 eV energy loss was used.
Statistically significant differences between multiple study end-points
were assessed using a repeated-measures one-way ANOVA. Paired
mean analysis between two study end-points was assessed using paired
parametric (t tests) or nonparametric (Wilcoxon matched pairs) tests as
appropriate. Simple linear regression analysis and Pearson correlation
coefficients (R) were used to assess associations between endpoints.
For all statistical tests, a P value of ⬍ 0.05 was considered statistically
significant.
RESULTS
Regional Particle Deposition, MCC, and Normalized
Sputum Counts
The mean (⫾ SD) C/P ratios for the three study days (i.e., 40,
100, and 160 min) were 1.91 ⫾ 0.50, 1.81 ⫾ 0.43, and 1.77 ⫾ 0.36,
respectively, and were not different when analyzed by repeated
measures tests. This suggested that the particles were similarly
deposited in the bronchial airways for the three study periods.
The average retention versus time curves on the three study
days for all subjects is illustrated in Figure 2. About 40–50% of
the deposited activity was cleared from the lung by induced
sputum at the 40-min time point. Because lung MCC occurred
naturally prior to the induced sputum procedures initiated at
100 and 160 min after aerosol inhalation, the actual amount
cleared via induced sputum at the 60–100 and 120–160 min time
intervals was reduced accordingly. Interestingly, at the conclusion of the induced sputum for each time point, the lung retentions were similar (0.48–0.52) and approximated those observed
24 h after deposition (0.40–0.42) of the radiolabeled particles.
This suggests that at each time point, sputum induction cleared
the airways of nearly all “clearable” particles. There were also no
correlations between lung retentions immediately before sputum
induction (for the 100- and 160-min samples) and the measured
%uptake of particles by airway phagocytes that might suggest
preferential clearance of free versus phagocytosed particles before sputum induction. Furthermore, normalized sputum counts
(NSpC) were not different between the three time points for
induced sputum (NSpC ⫽ 0.67 ⫾ 0.41, 0.60 ⫾ 0.66, and 0.65 ⫾
0.66), suggesting comparable sampling of the airways relative to
the available particle activity in the lung at the time of sputum
induction.
Cell Morphology
Morphology of sputum macrophages was assessed by light microscopy,
and macrophages were classified as having either normal to minimal
degenerative morphology or moderate to advanced degenerative morphology. Macrophages were considered to have moderate to advanced
degenerative morphology if they exhibited two or more of the following
morphologic changes: (1 ) cytoplasmic swelling and vacuolar (hydropic)
degeneration; (2 ) alterations of the plasma membrane (blebbing, rupture); (3 ) degenerative nuclear changes (nuclear swelling, karyolysis
or karyorhexis, loss of nucleoli, disruption of nuclear membrane); (4 )
altered (diminished) cytoplasmic and nuclear staining characteristics.
Normal and degenerative macrophage populations were expressed as
Figure 2. Average retention versus time curves for all subjects and the
three study days. Forty to fifty percent of the deposited activity was
cleared from the lung by induced sputum at the 40-min time point.
Alexis, Lay, Zeman, et al.: In Vivo Particle Uptake by Airway Macrophages
Sputum Characteristics, Total and Differential Cell Counts
All subjects tolerated the induced sputum procedure without
experiencing any adverse events or need for rescue therapy. All
ten subjects were able to produce a sputum sample of adequate
quality (⭓ 60% viability, ⭐ 20% squamous epithelial cells) on
all study occasions. The mean number and proportion (%) of
airway macrophages (and neutrophils) obtained at each time
point (40, 100, 160 min) after sulfur colloid (SC) inhalation and
after the control condition, appear in Table 1. After particle
inhalation, the mean (⫾ SEM) absolute number of macrophages
was maximal at 100 min (1,523 ⫾ 246 cells/mg), but was not
significantly different than levels at 40 (1,248 ⫾ 256 cells/mg) or
160 min (990 ⫾ 211 cells/mg).The proportion (%) of macrophages,
however, was significantly (P ⬍ 0.05) elevated at 100 (92 ⫾ 2%)
and 160 (92 ⫾ 2%) min compared with 40 min (76 ⫾ 6%).
Compared with control (555 ⫾ 114 cells/mg and 60% ⫾ 5%),
both the number and proportion of macrophages at 40 min
were significantly (P ⬍ 0.05) elevated (1,248 ⫾ 256 cells/mg and
76% ⫾ 6%), suggesting that SC inhalation induced macrophage
recruitment or accumulation in the airways. Macrophage numbers
peaked at 100 min (1,523 ⫾ 246 cells/mg) and decreased at
160 min (990 ⫾ 211 cells/mg) versus control, suggesting that
macrophage accumulation was likely complete shortly after
100 min post–aerosol inhalation.
In Vivo and In Vitro Uptake of Radiolabeled SC Particles
Mean (⫾ SEM) in vivo particle uptake (%) at 40, 100, and 160
min after SC inhalation is shown in Figure 3A. Uptake was
significantly (P ⬍ 0.05) enhanced at 100 (31 ⫾ 5%) and 160 min
(27 ⫾ 4%) compared with 40 min (6 ⫾ 3%), and was maximal
at 100 min. Mean (⫾ SEM) in vitro particle uptake after in vitro
exposure is shown in Figure 3B. In vitro uptake was maximal
and significantly elevated at 160 min compared with the 40-min
time point (24 ⫾ 6% versus 12 ⫾ 2%, P ⬍ 0.05). Uptake
in vitro increased linearly over time from 40–160 min after the
application of SC particles, and compared with uptake in vivo
was significantly elevated at the early time point of 40 min
(12 ⫾ 2% versus 6 ⫾ 3%, P ⬍ 0.05).
EFM and FCM
Light microscopic and EFM photomicrographs showing the uptake of SC-FITC particles by sputum macrophages after in vitro
incubation are depicted in Figure 4. Top (light microscope) and
bottom (fluorescent microscope) right panel images (C and D )
show particles as bright/fluorescent areas in contrast to the dark
background of the cell. These images are compared with their
respective left-hand panel images, in which cells were not exposed to particles (control condition) and the absence of bright/
fluorescent areas is noted. The fluorescence is confined to the
cytoplasm of macrophages and neutrophils and is absent in squamous cells and lymphocytes (not shown). This shows a definite
association of the particles with phagocytic cells. The diffuse
309
distribution within the cytoplasm (as opposed to localization
at the cell periphery) suggests an intracellular location for the
particles, rather than extracellular surface attachment.
Flow cytometric analysis of phagocytosis of FITC-labeled
SC particles by sputum macrophages is shown in Figure 5. A
representative dot plot (A ) in the control condition (no particle
inhalation) shows the gated sputum leukocyte populations (macrophages, neutrophils, monocytes, lymphocytes) based on light
scatter properties (x-axis: forward scatter; y-axis: side scatter).
A corresponding histogram (B ) shows the different cell population sizes (forward scatter) relative to the small size of the SC
particles, which fall below the threshold limit of 200 MFI for
the cells. Phagocytosis is demonstrated in C, where macrophages
have ingested SC particles (green peak) and have shifted to the
right into the particle region (M3) away from the control region
(M1-pink peak), where only background autofluorescence is
present and no particle uptake occurred.
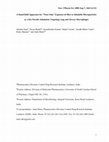
Electron Microscopic Studies
On EM analysis, particles were found mostly as agglomerates
surrounded by a halo that contained no or only little sulfur.
The particles themselves revealed the specific sulfur signal using
electron energy loss spectroscopy (EELS). Particles were localized within macrophages and the majority had a diameter of
100 nm or more, suggesting agglomeration of the primary particles within the cells. Figure 6 is a transmission electron micrograph depicting an airway macrophage containing an intracellular SC particle after particle inhalation in vivo. At low
magnification (A ), SC particles (black aggregate mass in boxed
region) are located in the perinuclear region within the cytoplasm
of a sputum macrophage. The boxed region in A is seen in higher
magnification in B. The particle consists of a large irregularly
shaped electron-dense mass that is an aggregate of smaller particles. The large particle mass is surrounded by an amorphous
electron-lucent material (interpreted to be the gelatin maxtrix
of the nebulized SC particle) and multiple smaller electron-dense
particles organized around the periphery. It is not possible to
discern whether the main particle mass is encased in a membranebound structure (phago-lysosome) due to inadequate staining
and contrast of cellular membranes. Electron spectroscopic images (ESI) displayed the specific signal of sulfur in white pixels.
The electron-dense particle aggregate, as well as the multiple
smaller electron-dense particles organized around the periphery,
depicted in Figure 6B, co-localize with the distribution of sulfur
as detected using EELS shown by white pixels in Figure 6C.
The sulfur-poor electron-lucent region surrounding the particle
aggregate shows only a weak signal for sulfur.
Association between In Vivo Particle Uptake and Macrophage
Levels in the Airways
Positive associations were observed between particle uptake (%)
and the absolute number of macrophages (cells/mg) at both
TABLE 1. IN VIVO MEAN (ⴞ SEM) SPUTUM MACROPHAGE AND NEUTROPHIL CELL COUNT
AFTER Tc99 m SULFUR COLLOID PARTICLE INHALATION BY HEALTHY SUBJECTS
Time after Particle Inhalation
Control (n ⫽ 7) (no particle inhalation)
40 min
100 min
160 min
Macrophages/mg Sputum
555
1248*
1523*
990
(114)
(256)
(246)
(211)
Definition of abbreviation: PMN, polymorphonuclear leukocytes.
* P ⬍ 0.05 versus control.
†
P ⬍ 0.05 versus 40 min.
% Macrophages
60
76*
92*†
92*†
(5)
(6)
(2)
(2)
PMN/mg Sputum
325
486
118
82
(85)
(356)
(28)
(20)
% PMNs
35
20
8
8
(7)
(9)
(2)
(2)
310
AMERICAN JOURNAL OF RESPIRATORY CELL AND MOLECULAR BIOLOGY VOL 34
2006
Figure 3. (A ) In vivo particle uptake (%) by airway macrophages obtained from induced sputum at 40, 100, and 160
min after radiolabeled (Tc99 m) sulfur colloid (SC) aerosol
inhalation by healthy subjects (n ⫽ 10). Uptake was significantly elevated at 100 and 160 min compared with 40 min
(*P ⬍ 0.05). (B ) In vitro particle uptake (%) by airway macrophages obtained from induced sputum from n ⫽ 7 healthy
subjects after incubation with radiolabeled (Tc99 m) sulfur
colloid (SC) particles for 40, 100, and 160 min. Uptake was
significantly elevated at 160 min compared with 40 min
(*P ⬍ 0.05).
100 min (R ⫽ 0.84, P ⫽ 0.01) and 160 min (R ⫽ 0.68, P ⫽ 0.04).
These associations and their respective regression lines are
shown in Figures 7A and 7B. No association between uptake
(%) and macrophage number was observed at 40 min after
SC inhalation (R ⫽ 0.04). Positive associations were observed
between particle uptake (%) and macrophage proportion (%)
at 40 (R ⫽ 0.4), 100 (R ⫽ 0.4), and 160 (R ⫽ 0.2) min, but these
did not reach statistical significance in each case. In addition,
no associations were observed between particle uptake (%) and
proportion or number of neutrophils at any time point. No significant association between in vivo and in vitro uptake was
found at 100 and 160 min, but a trend toward an association
was observed at 40 min (R ⫽ 0.6, P ⫽ 0.06, one-tailed).
Morphology
Our analysis on six subjects showed that on average (⫾ SEM)
there were a higher proportion of macrophages demonstrating
degenerative morphologic changes consistent with necrosis at
40 min (67 ⫾ 2%) compared with 100 min (39 ⫾ 4%). These
changes were marked by of hydropic degeneration (extensive
cytoplasmic vacuolation), cell swelling, and disruption of membranes resulting in blebbing and rupture of the plasma membrane, nuclear swelling, karyorhexis, and karyolysis (fragmentation and dissolution of the nucleus). Cells at 40 min likely
contained a smaller proportion of newly recruited cells, since
macrophage proportions were maximal at 100 min. Therefore,
at 40 min there were likely a relatively higher proportion of
older cells that would tend to have increased degenerative
morphology. Cell morphology assessed before particle exposure
(in vitro samples) showed a very similar proportion of degenerative cells (64 ⫾ 3%) compared with cells at 40 min in vivo,
suggesting that particles themselves were not inducing morphologic changes.
DISCUSSION
Combining the techniques of induced sputum with radiolabeled
aerosol bolus delivery allowed us to dynamically assess particle
uptake by airway surface macrophages in healthy volunteers.
Unlike previous animal studies that used in vitro culture systems,
or in situ methods on excised human lungs (15), the experimental
approach used in this study examined cellular airways events
after targeted aerosol inhalation to the central airways. This
targeted approach from both a deposition and sampling perspective allowed us to specifically examine the bronchial airways
independent of particle–alveolar macrophage interactions. Our
controlled particle inhalation procedure also provided reproducible lung deposition on the three study days, guaranteeing
comparable samples from induced sputum for evaluation of the
time course of in vivo particle uptake by airway macrophages.
Figure 4. Uptake of fluorescent SC particles by airway macrophages obtained from induced sputum from a healthy
subject. Images in the top panels (A, C ) are shown under
normal light microscopy, and those in the bottom panels
(B, D ) with fluorescent microscopy. Top and bottom
right panel images show particles as bright/fluorescent areas
in contrast to the dark background of the cell. Particle uptake
by MO (macrophages) and PMN (neutrophils) is shown
in C and D. No particle uptake is seen in control cells in
panels A and B. SQ (squamous epithelial cell).
Alexis, Lay, Zeman, et al.: In Vivo Particle Uptake by Airway Macrophages
311
Figure 5. In vitro phagocytosis of SC
particles by airway macrophages obtained from induced sputum in a
healthy subject. (A ) Flow cytometric
dot plot shows distribution of sputum
leukocytes (PMN/polymorphonuclear
neutrophils; MO/macrophages; Mono/
monocytes; LO/ lymphocytes) based
on light scatter properties (FWS: forward scatter; SSC: side scatter). (B )
Flow histogram shows SC particles register below FSC threshold of 200 MFI,
while leukocytes register above 200
MFI. (C ) Flow histogram shows
rightward shift of macrophage population (green) into the M3 region after
ingestion of SC particles. Control cells
(no particle ingestion) are shown in
pink in the M1 region and demonstrate
only background autofluorescence.
Furthermore, the recovered sputum phagocytes did not require
fixation for their analysis, but were rather processed in real time
within their own functional milieu.
Comparing the time course kinetics between our in vivo and
in vitro conditions, we observed some interesting differences in
particle uptake. In vivo, uptake began but was low at 40 min,
and was not maximal until 100 min after aerosol inhalation. By
160 min, uptake appeared to fall off slightly, but not significantly
so. These time course kinetics are similar to animal time course
studies in which uptake by hamster airway macrophages occurred as early as 40 min, and was usually maximal by 1 h after
the onset of inhalation (7). In vitro, uptake was also evident at
40 min, but unlike in vivo, continuously increased over time,
maximizing at 160 min. Together, these data suggest that in
healthy human airways, there exists a population of resident
macrophages on the airways surfaces that rapidly interact with
inhaled particles. The nonlinear time course kinetics observed
in vivo may reflect the presence of competing endogenous factors
that can function to either enhance or inhibit particle uptake.
For example, the surfactant film that covers the aqueous phase
at the air–liquid interface may promote displacement of particles
from air into an aqueous subphase (16–18). Here, specific factors
that enhance uptake may be present and include surfactant proteins (SP) A and D and immunoglobulins, while others like
1,2-dipalmitoylphosphatidylcholine (DPPC) have adsorptionreducing effects on opsonic proteins and may inhibit particle
uptake (19). These competing factors would be expected to be
in low concentration in our in vitro model due to the removal
of the supernatant fluid before particle incubation. Hence these
cells received limited exposure to endogenous compounds from
the airway’s natural milieu, as well as no exposure to the potential
effect of hypertonic saline on the airway milieu from the induced
sputum procedure itself (20). The effect of endogenous factors
on uptake, especially ones that enhance it, would be expected
to be least at 40 min and greater at 100 and 160 min as they
require the necessary time to exert their actions. Hence, in vivo
and in vitro uptake should be most similar early rather than
later, when exogenous factor’s influences are most minimal. Indeed, we observed a positive trend for association between
in vivo and in vitro uptake at 40 min but not at 100 and 160 min.
In vivo, competing factors would be secreted from endogenous
stores within the airways and either directly or indirectly affect
cell–particle interactions on the airways surface. The generally
Figure 6. Electron micrographic images of an ultrastructural view of
intracellular SC uptake by airway macrophages obtained from induced
sputum after in vivo particle inhalation by a healthy subject. (A ) Sputum
MØ containing intra-cellular SC Particle. (B ) Detail showing substructure
of the SC particle. (C ) Electron Spectroscopic image showing specific
sulfur signal.
312
AMERICAN JOURNAL OF RESPIRATORY CELL AND MOLECULAR BIOLOGY VOL 34
Figure 7. Association between in vivo particle uptake and the number
of sputum macrophages (macrophages/mg sputum) in healthy subjects
100 (A ) and 160 (B ) min after radiolabeled SC aerosol inhalation. Significant associations were observed at 100 (A; R ⫽ 0.84, P ⬍ 0.05) and
160 (B; R ⫽ 0.68, P ⬍ 0.05) min.
linear time course pattern we observed in vitro is more consistent
with uniform reaction kinetics that has limited access to exogenous factors.
Maximal uptake in vivo was 31% for the observation times
studied here. This is in the range of reported uptake values for
hamster airway macrophages, where uptake ranged between 17
and 44% depending on the size and type of particle examined
(9). Geiser (9) showed that the smallest particle type (3-m
spores) had the lowest uptake (10%), whereas the largest particle
type (6-m polystyrene microspheres) had the greatest uptake
(44%). There is no comparative in vivo animal data for smaller
colloidal particles (average 0.22 m) such as those used in this
study. While the effect of particle size on uptake in our human
model would be of interest, there are limitations on the types
and associated sizes of radiolabeled particles that human subjects
can inhale. Moreover, the size of particles with which macrophages interact, will almost certainly fall into a range of sizes,
since macrophages ultimately interact with both individual smallsized particles (0.22 m), and larger agglomerates of the primary
particles. We used flow cytometry and electron microscopy to
show that sputum macrophages are indeed capable of phagocytosing SC particles, hence we are confident that our uptake
measurements were a part of the phagocytosis process, not
merely particle adhesion to cells.
After aerosol inhalation by healthy volunteers, the most significant increase in uptake occurred between 40 and 100 min after
aerosol inhalation. There are several factors that may account for
uptake differences in vivo versus in vitro, and one of these is
macrophage recruitment. Macrophage recruitment to the site of
2006
particle deposition likely influenced both absolute uptake and
the time course of uptake at the early time point. In vitro, cell
migration did not occur, since cell–particle interaction occurred
immediately upon cell–particle incubation, whereas a significant
portion of the early events in vivo likely involved macrophage
recruitment to and organization at the site of particle deposition.
During cell recruitment, optimal particle uptake would not have
been expected to occur until both a critical number and proportion of macrophages were present and available for particle–cell
interactions. Macrophage migration to sites of particle deposition after particle inhalation has been demonstrated in situ for
several particle types and animal species (7, 21–23). Our differential cell count data suggest that macrophage recruitment did
occur in subjects after particle inhalation, despite delivery of a
very small mass of particles (⬍ 10 g) to the airway surface.
There was a significant increase in both the number and proportion of macrophages after particle inhalation at 40 min when
compared with a control condition (no particle inhalation). Furthermore, in vivo we observed that a significant increase occurred
in the proportion of macrophages at both 100 and 160 min
compared with 40 min, paralleling the significant particle uptake
responses. Interestingly, particle uptake correlated positively
and significantly with the number of macrophages at 100 and
160 min, but not at the 40-min time point. We interpret the
absence of the correlation at 40 min, and the relatively low mean
in vivo uptake value at 40 min (compared with in vitro), to be
due in part to macrophage recruitment to the sites of particle
deposition. This process and the time needed to achieve it would
influence and likely delay full macrophage involvement in particle uptake at the early time point.
Morphologic analysis of the in vivo macrophage populations
at both 40 and 100 min revealed that at 40 min, there was
a higher proportion of macrophages that showed evidence of
moderate to advanced degenerative cytoplasmic and nuclear
morphology compared with the 100-min time point. This finding
suggests that at the 40-min time point, a greater proportion of
the airway macrophages are cells with longer residence times
in the airways. These cells have reached or are approaching
senescence, and have reduced functional ability compared with
newly arrived monocytic cells from the peripheral circulation
or interstitial macrophages from the peribronchial spaces (24).
Taken together, our results suggest that by 100 min, when macrophage proportions in vivo were maximal (92%), cell recruitment
and migration of new monocytic cells into the airway were complete. Consequently, macrophages with greater phagocytic ability were the predominant phenotype in the airway, enabling
particle uptake processes to be optimal.
While most fine and coarse insoluble particles depositing
on the bronchial tree are cleared by the mucociliary clearance
apparatus (25), the role airway macrophage phagocytosis plays
in particle clearance is less well understood. The fact that we
found no association between clearance kinetics pre-sputum and
the %uptake measured post sputum suggests that both free
particles and particles within macrophages clear at similar rates.
For example, if phagocytosis of particles inhibited clearance, as
recently suggested by Moller and colleagues (26), we might have
expected higher lung retentions pre-sputum for those individuals
who exhibited higher %uptake after sputum. On the contrary,
if free particles cleared less well than those taken up by macrophages (e.g., due to interaction or uptake by epithelial cells),
we might have expected higher lung retentions pre-sputum for
those individuals who exhibited lower in vivo uptake. The fact
that no correlations occurred at all suggests that free and phagocytosed particles clear similarly within the mucociliary clearance
apparatus. In addition, the fact that subjects achieved similar lung
retentions post sputum at each collection time point (Figure 2)
Alexis, Lay, Zeman, et al.: In Vivo Particle Uptake by Airway Macrophages
suggests that “incubation” of particles on the airway surface for
periods up to 2 h does not affect their ability to be cleared. This
contradicts the hypothesis of Moller and colleagues (26), who
suggested that uptake of particles by airway macrophage may
be responsible for retarded clearance from the bronchial airways.
Our data suggested that particle uptake by airway macrophages
had no effect on clearance kinetics of particles through 24 h
after deposition.
One limitation of this study was our inability to determine
whether the retention of particles immediately post sputum or
at 24 h after aerosol inhalation represented a predominance of
free versus phagocytosed particles on alveolar regions. Previous
studies (27) using similar particle inhalation techniques suggest
that some of the particles still retained after sputum induction
and at 24 h may reflect particles residing in small bronchiole
airways where the induced sputum procedure may not sample
(2), and whose clearance occurs over a period of weeks. We
speculate that most of the particles retained at 24 h in this study
are indeed likely residing in alveolar regions reached by the
bolus delivery method (i.e., short path length alveoli), despite
our best efforts to maximize bronchial airway deposition. These
particles would be unavailable for sampling by the induced sputum technique (2). Moreover, we know from our previous studies
that in vivo uptake of particles by alveolar macrophages also
occurs very rapidly, with 90% uptake occurring by 24 h after
instillation (28).
The results reported here describe the time course and characteristics of phagocyte–particle interactions on the surfaces of
the bronchial airways in normal healthy individuals. These results will serve as useful comparisons to determine whether these
host defense features are altered in airway diseases like asthma
or COPD, in which inflammation plays a significant role in the
pathophysiology of the disease. Furthermore, understanding
particle uptake by airway macrophages may contribute toward
therapeutic strategies, some of which try to enhance uptake to
defend against toxic particles that may damage host tissue, while
others try to inhibit particle uptake to enhance drug bioavailability to target cells and organs. Our technique for evaluating
in vivo uptake of particles in the airways should provide a valuable tool for future studies to address these important questions.
Conflict of Interest Statement : None of the authors has a financial relationship
with a commercial entity that has an interest in the subject of this manuscript.
References
1. Alexis N, Ghio A, Soukup J, Becker S. Sputum phagocytes are functional
and activated: a flow cytometric comparison with cells in bronchoalveolar lavage and peripheral blood. Clin Immunol 2000;97:21–32.
2. Alexis N, Hu S-C, Zeman K, Alter T, Bennett WD. Induced sputum
derives from the central airways: confirmation using a radiolabeled
aerosol bolus delivery technique. Am J Respir Crit Care Med 2001;164:
1964–1970.
3. Belda J, Leigh R, Parameswaran K, O’Byrne PM, Sears MR, Hargreave
FE. Induced sputum cell counts in healthy adults. Am J Respir Crit
Care Med 2000;161:475–478.
4. Brain JD, Molina RM, DeCamp MM, Warner AE. Pulmonary intravascular macrophages: their contribution to the mononuclear phagocyte
system in 13 species. Am J Physiol 1999;276:L146–L154.
5. Geiser M, Matter M, Maye I, Im Hof V, Gehr P, Schurch S. Influence
of airspace geometry and surfactant on the retention of man-made
vitreous fibers (MMVF 10a). Environ Health Perspect 2003;111:895–
901.
6. Geiser M, Schurch S, Gehr P Influence of surface chemistry and topogra-
313
7.
8.
9.
10.
11.
12.
13.
14.
15.
16.
17.
18.
19.
20.
21.
22.
23.
24.
25.
26.
27.
28.
phy of particles on their immersion into the lung’s surface-lining layer.
J Appl Physiol 2003;94:1793–1801. Epub Jan 24 2003.
Geiser M, Baumann M, Cruz-Orive LM, Im Hof V, Waber U, Gehr P. The
effect of particle inhalation on macrophage number and phagocytic
activity in the intrapulmonary conducting airways of hamsters. Am J
Respir Cell Mol Biol 1994;10:594–603.
Warheit DB, Overby LH, George G, Brody AR. Pulmonary macrophages
are attracted to inhaled particles through complement activation. Exp
Lung Res 1988;14:51–66.
Geiser M. Morphological aspects of particle uptake by lung phagocytes.
Microsc Res Tech 2002;57:512–522.
Geiser M, Gerber P, Maye I, Im Hof V, Gehr P. Retention of Teflon
particles in hamster lungs: a stereological study. J Aerosol Med 2000;13:
43–55.
Geiser M, Serra AL, Cruz-Orive LM, Baumann M, Im Hof V, Gehr P.
Efficiency of airway macrophage recovery by bronchoalveolar lavage
in hamsters: a stereological approach. Eur Respir J 1995;8:1712–1718.
Geiser M, Cruz-Orive LM, Im Hof V, Gehr P. Assessment of particle
retention and clearance in the intrapulmonary conducting airways of
hamster lungs with the fractionator. J Microsc 1990;160:75–88.
Lehnert BE, Morrow PE. Characteristics of alveolar macrophages following the deposition of a low burden or iron oxide in the lung. J Toxicol
Environ Health 1985;16:855–868.
Lay JC, Berry CR, Kim CS, Bennett WD. Retention of insoluble particles
following local intrabronchial deposition in dogs. J Appl Physiol
1995;79:1921–1929.
Gil J, Weibel ER. Extra-cellular lining of bronchioles after perfusionfixation of rat lungs for electron microscopy. Anat Rec 1971;169:185–
199.
Gehr P, Schurch S, Berthiaume Y, Im Hof V, Geiser M. Particle retention
in airways by surfactant. J Aerosol Med 1990;3:27–43.
Geiser M, Im Hof V, Siegenthaler W, Grunder R, Gehr P. Ultrastructure
of the aqueous lining layer in hamster airways: is there a two-phase
system? Microsc Res Tech 1997;36:428–437.
Schurch S, Gehr P, Im Hof V, Geiser M, Green F. Surfactant displaces
particles toward the epithelium in airways and alveoli. Respir Physiol
1990;80:17–32.
Evora C, Soriano I, Rogers RA, Shakesheff KN, Hanes J, Langer R.
Relating the phagocytosis of microparticles by alveolar macrophages
to surface chemistry: the effect of 1,2-dipalmitoylphosphatidylcholine.
J Control Release 1998;51:143–152.
Kerby GS, Cottin V, Accurso FJ, Hoffmann F, Chan ED, Fadok VA,
Riches DW. Impairment of macrophage survival by NaCl: implications
for early pulmonary inflammation in cystic fibrosis. Am J Physiol Lung
Cell Mol Physiol 2002;283:L188–L197.
Huffnagle GB, Strieter RM, McNeil LK, McDonald RA, Burdick MD,
Kunkel SL, Toews GB. Macrophage inflammatory protein-1alpha
(MIP-1alpha) is required for the efferent phase of pulmonary cellmediated immunity to a Cryptococcus neoformans infection. J Immunol
1997;159:318–327.
Sorokin SP, Brain JD. Pathways of clearance in mouse lungs exposed to
iron oxide aerosols. Anat Rec 1975;181:581–625.
Warheit DB, Hartsky MA. Role of alveolar macrophage chemotaxis and
phagocytosis in pulmonary clearance responses to inhaled particles:
comparisons among rodent species. Microsc Res Tech 1993;26:412–422.
Hume DA. Ross IL, Himes SR, Sasmono RT, Wells CA, Ravasi T. The
mononuclear phagocyte system revisited. J Leukoc Biol 2002;72:621–
627.
Bennett WD, Brown JS. Particulate dosimetry in the respiratory tract.
In: Air pollutants and the respiratory tract. Foster WM, Costa DL,
editors. New York: Marcel Dekker; 2005. pp. 21–74.
Moller W, Haussinger K, Winkler-Heil R, Stahlhofen W, Meyer T,
Hofmann W, Heyder J. Mucociliary and long-term particle clearance
in the airways of healthy nonsmoker subjects. J Appl Physiol 2004;97:
2200–2206.
Bennett WD, Scheuch G, Zeman KL, Brown JS, Kim C, Heyder J,
Stahlhofen W. Bronchial airway deposition and retention of particles
in inhaled boli: effect of anatomic dead space. J Appl Physiol 1998;85:
685–694.
Lay JC, Bennett WD, Kim CS, Devlin RB, Bromberg PA. Retention
and intracellular distribution of instilled iron oxide particles in human
alveolar macrophages. Am J Respir Cell Mol Biol 1998;18:687–695.