Downloaded from jnm.snmjournals.org by on November 17, 2015. For personal use only.
BASIC SCIENCE INVESTIGATIONS
Evaluation of the Early Effect of Local Irradiation
on Normal Rodent Bone Marrow Metabolism
Using FDG: Preclinical PET Studies
Tatsuya Higashi, Susan J. Fisher, Raya S. Brown, Kunihiro Nakada, Gail L. Walter, and Richard L. Wahl
Division of Nuclear Medicine, Department of Internal Medicine, University of Michigan Medical Center, Ann Arbor; and Private
Practice, Kalamazoo, Michigan
Our aim was to evaluate the early effect of local irradiation on
normal bone marrow glucose metabolism in rodents, assessed
by FDG biodistribution measured by tissue excision and g
counting. Methods: Sixty-one rats were divided into nine groups
(n 5 4–11 per group). Eight groups of rats received either local
irradiation (10 Gy) or sham irradiation to the right femur on day 0.
Irradiation was performed using a 60Co g-ray unit under anesthesia. Each group of rats was fasted overnight and then injected
with 5.5–7.4 MBq FDG on day 1, 9, 18, or 30 after the local or
sham irradiation. A control group of rats that received neither
local nor sham irradiation was studied with FDG on day 0. 18F
activity in tissue 1 h after injection was measured using a g
counter. Smear specimens of bone marrow from bilateral femurs
were examined by light microscopy. Results: Tracer uptake was
relatively stable in marrow from the sham-irradiated rats. By
contrast, FDG uptake of the irradiated marrow on day 1 was
significantly higher (mean 6 SD, 0.257 6 0.036 percentage
injected dose [ID] per gram of tissue per kilogram of rat weight
[%ID/g/kg]) than that of the sham group on day 1 (0.187 6 0.028
%ID/g/kg) and the control group (0.184 6 0.009 %ID/g/kg) (P ,
0.05). Tracer uptake in the irradiated marrow on day 9 was
significantly lower (0.148 6 0.023 %ID/g/kg) than that of the
sham group on day 9 (0.193 6 0.021 %ID/g/kg) and the control
group (P , 0.01). In contrast, the nonirradiated contralateral
marrow from irradiated rats showed increased FDG uptake on
day 18 (0.274 6 0.063 %ID/g/kg) that was significantly higher
than that of the sham group on day 18 (0.208 6 0.030 %ID/g/kg)
and the control group (0.183 6 0.018 %ID/g/kg) (P , 0.05). The
irradiated marrow smear specimens initially revealed increased
percentages of neutrophils on day 1 (45% of 500 nucleoid cells
examined per slide) compared with that of the sham group (20%),
followed by severely decreased overall cellularity on day 9.
Conclusion: In this experimental system, normal marrow uptake
of FDG transiently rose, then fell, and ultimately returned to
baseline after external beam irradiation. Knowledge of this
biphasic early irradiation effect on normal bone marrow may be
important when the efficacy of radiation therapy on bone metastasis is evaluated using FDG PET after irradiation.
Key Words: FDG; irradiation; bone marrow
J Nucl Med 2000; 41:2026–2035
Received Nov. 10, 1999; revision accepted Mar. 28, 2000.
For correspondence or reprints contact: Richard L. Wahl, MD, Division of
Nuclear Medicine, University of Michigan Medical Center, 1500 E. Medical
Center Dr., B1G 412, Box 0028, Ann Arbor, MI 48109-0028.
2026
THE JOURNAL
OF
B
one marrow is a frequent site of metastatic cancers,
especially from the breast, lung, and prostate (1). Many
imaging modalities have been developed for detection,
assessment, and after treatment of bone marrow metastases.
PET using FDG has been shown to be a useful modality for
staging malignant tumors and for evaluating efficacy of
treatment (2,3). Recent reports show the usefulness of FDG
PET in detecting bone metastases in patients with breast and
lung cancer (4,5).
Normal bone itself has little uptake of FDG, whereas
normal hematopoietic bone marrow has moderate to occasionally intense uptake of FDG in humans and in animals
(6–8). With the increasing use of FDG PET studies in
assessing cancer patients, we have sometimes observed
increased FDG uptake in the bone marrow after chemotherapy accompanied by cytokine therapy (9,10). Multidrug
chemotherapy itself does not change FDG uptake of bone
marrow at least initially (2,10). However, little information
exists concerning the effect of irradiation on glucose metabolism using FDG in normal bone marrow in rats or in humans
(11–13).
Currently, it is difficult to noninvasively monitor the
response of bone marrow metastases to irradiation or
chemotherapy by conventional imaging methods. FDG PET
can quickly and accurately assess treatment response, but a
concern in such applications to bone metastases is that an
acute or subacute change in FDG uptake in normal marrow
as background could occur and make response assessment
more difficult, as is the case with cytokine therapy. In this
study, to assess the early effect of local irradiation on the
normal bone marrow, we evaluated the changes in FDG
uptake in bone marrow and other tissues in locally irradiated
healthy rats.
MATERIALS AND METHODS
Animals and Irradiation Procedures
Sixty-one healthy female Sprague-Dawley rats (Harlan SpragueDawley, Indianapolis, IN) (weight, 250–300 g; age, .3 mo at the
beginning of the study [day 0]) were divided into nine groups (n 5
NUCLEAR MEDICINE • Vol. 41 • No. 12 • December 2000
Downloaded from jnm.snmjournals.org by on November 17, 2015. For personal use only.
4–11 per group). Eight groups (groups 1–8) of rats were anesthetized by intramuscular injection in their left thigh muscles on day 0
with both ketamine hydrochloride (Fort Dodge Laboratories, Inc.,
Fort Dodge, IA) and xylazine (Bayer Corp., Shawnee Mission, KS)
at concentrations of 45 and 25 mg/kg of body weight, respectively.
Four groups of rats (groups 1–4; n 5 7–11 per group) were
subjected to localized irradiation on day 0 (irradiated groups).
Localized irradiation was delivered by a 60Co g-ray unit (Theratron
AECL, Kanata, Ontario, Canada) to the right femurs. The rats were
placed on a Plexiglas block (Rohm and Haas, Philadelphia, PA)
that was set at a distance of 50 cm from the radiation source. The
total dose of the irradiation was 10 Gy per rat, with an output of
137.0 cGy/min using a field size of 6 3 6 cm on the center of the
right femur, in which the right thigh and calf muscle were included.
The left femur was placed outside of this irradiation field.
Dosimetry was performed using an ionization chamber connected
to an electrometer system directly traceable to the National Institute
of Standards and Technology calibration. The exposure dose of the
contralateral left femur located outside of the irradiation field was
also examined in 5 rats using a small thermoluminescence dosimeter for each rat. Four groups of rats (groups 5–8; n 5 4–8 per
group) did not receive irradiation (sham-irradiated groups); all
procedures were performed in the same manner as in the irradiated
groups with the exception of local irradiation on day 0. The other
group of rats (group 0; control group) was studied without
irradiation or sham irradiation.
cells per slide and examination of the overall cellularity and
morphology. The percentage of each cell type relative to the total
nucleated cells and the group means, SDs, and myeloid-toerythroid ratios (M/Es) were calculated. Megakaryocytes were
evaluated for cellularity and morphology. Additionally, the percentage of degenerating cells was determined on smears from differential counts of at least 200 cells per slide.
Statistical Analysis
The data are presented as mean 6 SD. Comparisons of
differences in each organ’s FDG uptake among all 5 study-day
groups in either irradiated or sham-irradiated groups were performed by the Kruskal-Wallis test. Day-by-day comparisons of
differences in the organ FDG uptake between each study-day group
were performed by the Mann-Whitney U test (bone marrow,
spleen, and lung). P , 0.05 was considered significant.
RESULTS
The thermoluminescence dosimetry examination revealed
that the exposure dose on the contralateral left femur during
the irradiation procedure to right femur bone was between
0.097 and 0.158 Gy, with the average of 0.114 6 0.025 Gy.
This is in contrast to the 10 Gy delivered to the irradiated
side.
FDG Biodistribution
Table 1 shows the results of FDG biodistribution observed
in the rats from the irradiated groups (calculated as %ID/g/
kg) 1 h after intravenous injection. Two rats from groups 1
and 2 (one rat per group) were excluded because of
apparently inappropriate fasting conditions (FDG uptake in
heart, .1.0 %ID/g/kg). Higher FDG accumulation was
observed in the spleen and bilateral femur bone marrow
compared with that in other tissues. Bilateral femur bone,
liver, blood, and kidney showed lower and relatively stable
FDG accumulation throughout the study period. Table 2
shows the results of FDG biodistribution observed in the rats
from the sham-irradiated groups. Comparisons of differences in each organ’s FDG uptake across the 5 study days
revealed significant differences in the FDG uptake time
course of the nonirradiated groups in bilateral femur bones,
bone marrow, heart, spleen, and lung compared with those of
the irradiated groups.
FDG uptake of the right side marrow (irradiated marrow
from the irradiated groups and sham-irradiated bone marrow
from the sham-irradiated groups) on each study day is
shown in Figure 1. FDG uptake of the left side marrow
(nonirradiated marrow from the irradiated groups and nonsham-irradiated bone marrow from the sham-irradiated
groups) on each study day is shown in Figure 2. FDG uptake
in bilateral femur bone marrow from the sham-irradiated
groups had the same stable pattern but showed a slow
increase over the time course (Fig. 1, right, and Fig. 2, right).
FDG uptake of either right or left bone marrow from the
sham-irradiated group on day 30 was significantly higher
than that of the control group on day 0 (P , 0.05).
The irradiated right marrow showed a considerable fluctuation of FDG uptake throughout the time course (Fig. 1,
FDG Biodistribution Study
The biodistribution study using FDG was performed in each
group on a different study day. The control group (group 0)
received FDG on day 0. Irradiated groups (groups 1–4) received
FDG on day 1 (20–22 h), day 9 (9 d), day 18 (17 or 18 d), or day 30
(30 or 31 d) after irradiation. Sham-irradiated groups (groups 5–8)
received FDG on day 1 (20–22 h), day 9 (9 d), day 18 (14 or 18 d),
or day 30 (30 or 31 d) after sham irradiation. Each group of rats was
fasted overnight before the FDG study. Each rat was injected
intravenously with 5.55–7.40 MBq (150–200 µCi) FDG. One hour
after FDG injection, all rats were killed, the normal tissues (liver,
kidney, spleen, heart, lung, bilateral calf muscle, bilateral femur
bone, bilateral femur bone marrow, and blood) were excised and
weighed, and the 18F activity in tissue was determined with a g
counter. To obtain the bone marrow, we gently fractured bilateral
femoral bones, examined them visually, and curetted the marrow
both for smear specimens and for g counting. The percentage of
decay-corrected 18F activity per gram of tissue was determined and
normalized for rat weight (percentage injected dose [ID] per gram
per kilogram of rat weight [%ID/g/kg]) (7).
Marrow Specimen Examination
Twenty-six marrow smears from 13 representative rats were
prepared for cytologic examination at the time of killing. Two
specimens from bilateral femoral marrows (irradiated and nonirradiated or sham-irradiated and nonsham-irradiated) were examined
per rat. Nine rats were from the irradiated groups of day 1, 9, or 18
(groups 1–3; 3 rats per group) and 4 rats were from the shamirradiated group of day 18 (group 7). Slides were air-dried and then
were stained with Quick III Hematology Stain (MidAtlantic
Biomedical, Inc., Paulsboro, NJ). Masked evaluation of marrow
smear specimens was performed by an experienced veterinary
clinical pathologist using a light microscope. Bone marrow evaluation was performed as differential counts of at least 500 nucleated
RADIATION EFFECT
ON
BONE MARROW FDG UPTAKE • Higashi et al.
2027
Downloaded from jnm.snmjournals.org by on November 17, 2015. For personal use only.
TABLE 1
FDG Biodistribution in Irradiated Groups
FDG biodistribution (%ID/g/kg)
Tissue
Group 0*
day 0, n 5 5
Group 1
day 1, n 5 9
Group 2
day 9, n 5 7
Group 3
day 18, n 5 8
Group 4
day 30, n 5 8
Liver
Kidney
Spleen
Heart
Lung
Left calf
Right calf†
Left bone
Right bone†
Left marrow
Right marrow†
Blood
0.048 6 0.008
0.104 6 0.021
0.181 6 0.021
0.399 6 0.149
0.092 6 0.019
0.036 6 0.013
0.058 6 0.043
0.015 6 0.005
0.014 6 0.007
0.183 6 0.018
0.184 6 0.009
0.035 6 0.006
0.051 6 0.006
0.090 6 0.017
0.206 6 0.031
0.206 6 0.163
0.103 6 0.013
0.105 6 0.061
0.113 6 0.072
0.017 6 0.008
0.013 6 0.004
0.221 6 0.040
0.257 6 0.035
0.032 6 0.013
0.048 6 0.008
0.080 6 0.017
0.222 6 0.052
0.087 6 0.021
0.103 6 0.023
0.049 6 0.035
0.100 6 0.077
0.026 6 0.014
0.021 6 0.011
0.188 6 0.019
0.148 6 0.023
0.028 6 0.010
0.052 6 0.010
0.086 6 0.011
0.303 6 0.097
0.096 6 0.042
0.158 6 0.092
0.055 6 0.050
0.046 6 0.019
0.026 6 0.013
0.022 6 0.012
0.274 6 0.063
0.217 6 0.044
0.028 6 0.010
0.041 6 0.006
0.075 6 0.014
0.236 6 0.050
0.089 6 0.040
0.088 6 0.032
0.045 6 0.026
0.052 6 0.032
0.017 6 0.010
0.020 6 0.011
0.232 6 0.060
0.201 6 0.061
0.025 6 0.009
*Control group.
†Irradiated side.
Data are presented as mean 6 SD.
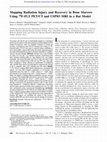
left). FDG uptake in irradiated marrow on day 1 after
irradiation was significantly higher (0.257 6 0.035 %ID/g/
kg) than that on day 0 of the control group (0.184 6 0.009
%ID/g/kg) (P , 0.01) and that on day 1 of the sham group
(0.187 6 0.028 %ID/g/kg) (P , 0.05). FDG uptake on day 9
was significantly lower (0.148 6 0.023 %ID/g/kg) than that
on day 0 of the control group (0.184 6 0.009 %ID/g/kg)
(P , 0.01) and that on day 9 of the sham group (0.193 6
0.021 %ID/g/kg) (P , 0.01).
On the other hand, marrow of the nonirradiated left side
from the irradiated groups showed a different fluctuation of
FDG uptake compared with that of the irradiated right side
(Fig. 2). FDG uptake of nonirradiated bone marrow from the
irradiated group on day 18 increased significantly (0.274 6
0.063 %ID/g/kg) compared with that on day 0 from the
control group (0.183 6 0.018 %ID/g/kg) (P , 0.05) or that
on day 18 from the sham groups (0.208 6 0.030 %ID/g/kg)
(P , 0.05). FDG uptake of nonirradiated bone marrow from
the irradiated group on day 1 (0.221 6 0.040 %ID/g/kg) was
significantly higher than that on day 1 from the sham group
(0.176 6 0.028 %ID/g/kg) (P , 0.05) but was not different
from that on day 0 of the control group (0.183 6 0.018
%ID/g/kg) (P 5 0.07).
The results of FDG uptake of spleen and lung after local
irradiation to the femur are shown in Figure 3. FDG uptake
in spleen showed an increase on day 18 (0.303 6 0.097
TABLE 2
FDG Biodistribution in Sham-Irradiated Groups
FDG biodistribution (%ID/g/kg)
Tissue
Group 0*
day 0, n 5 5
Group 5
day 1, n 5 5
Group 6
day 9, n 5 4
Group 7
day 18, n 5 7
Group 8
day 30, n 5 4
Liver
Kidney
Spleen
Heart
Lung
Left calf
Right calf†
Left bone
Right bone†
Left marrow
Right marrow†
Blood
0.048 6 0.008
0.104 6 0.021
0.181 6 0.021
0.399 6 0.149
0.092 6 0.019
0.036 6 0.013
0.058 6 0.043
0.015 6 0.005
0.014 6 0.007
0.183 6 0.018
0.184 6 0.009
0.035 6 0.006
0.046 6 0.009
0.085 6 0.021
0.118 6 0.042
0.373 6 0.354
0.067 6 0.022
0.077 6 0.035
0.033 6 0.009
0.016 6 0.002
0.019 6 0.005
0.176 6 0.028
0.187 6 0.028
0.038 6 0.011
0.053 6 0.007
0.088 6 0.032
0.204 6 0.011
0.055 6 0.009
0.077 6 0.021
0.070 6 0.064
0.025 6 0.010
0.021 6 0.006
0.018 6 0.004
0.190 6 0.010
0.193 6 0.021
0.041 6 0.005
0.051 6 0.007
0.095 6 0.021
0.218 6 0.046
0.097 6 0.044
0.109 6 0.035
0.035 6 0.009
0.049 6 0.028
0.013 6 0.007
0.012 6 0.006
0.208 6 0.030
0.206 6 0.026
0.032 6 0.011
0.055 6 0.012
0.101 6 0.019
0.233 6 0.035
0.054 6 0.009
0.099 6 0.010
0.028 6 0.012
0.076 6 0.083
0.006 6 0.001
0.006 6 0.002
0.222 6 0.020
0.228 6 0.021
0.045 6 0.008
*Control group.
†Sham-irradiated side.
Data are presented as mean 6 SD.
2028
THE JOURNAL
OF
NUCLEAR MEDICINE • Vol. 41 • No. 12 • December 2000
Downloaded from jnm.snmjournals.org by on November 17, 2015. For personal use only.
FIGURE 1. Time course of FDG uptake
(%ID/g/kg) in right bone marrow: FDG biodistribution 1 h after injection in irradiated
right bone marrow at different time intervals
after irradiation compared with that of shamirradiated marrow. Significant increase in
FDG accumulation was observed in irradiated marrow on day 1, which was followed
by considerable decrease to below control
level on day 9. Uptake increased back to
control level on days 18 and 30. Slight
increase in FDG uptake over time was
observed in sham-irradiated bone marrow.
%ID/g/kg) compared with that on day 0 (0.181 6 0.021
%ID/g/kg) (P , 0.05) and that on day 18 from the sham
groups (0.218 6 0.046 %ID/g/kg) (not significant). A
similar increase of FDG uptake was found in the lung on day
18 (0.158 6 0.092 %ID/g/kg) compared with that on day 0
(0.092 6 0.019 %ID/g/kg) or that on day 18 from the sham
groups (0.109 6 0.035 %ID/g/kg), but the differences were
not statistically significant. On day 1, there was a significant
decrease of FDG uptake in spleen and lung in the sham
group (P , 0.01).
Marrow Specimen Evaluation
The appearance of irradiated marrow of group 2 (on day
9) showed liquefaction and hemorrhagic changes at the time
of killing. All specimens from the other groups appeared to
have the same consistency as normal bone marrow. The
cytologic results of the smear specimen from bilateral femur
bone marrow from the irradiated groups are summarized in
Tables 3 and 4. No cytologic findings were related to
apoptosis in this study.
The smears of the irradiated right bone marrow were
different from those of the sham group (Table 3 and Fig. 4).
The overall marrow cellularity in the smear specimens of the
irradiated marrows showed a moderate decrease on day 1
and a severe pancellular loss on day 9 compared with that of
the sham group. The overall cellularity in the smear specimens of the irradiated marrow on day 18 was almost the
same as that of the sham groups. On day 18, an increased
number of adipose cells were observed on the irradiated
side. Figure 4 reveals a severe cellular loss of nucleated cells
and an increased number of red blood cells on specimens of
FIGURE 2. Time course of FDG uptake
(%ID/g/kg) in left bone marrow: FDG biodistribution 1 h after injection in nonirradiated
left bone marrow from irradiated groups at
different time intervals after irradiation compared with that of left marrow from shamirradiated groups. FDG uptake rose slightly
higher than control level on day 1 and
decreased on day 9. Then, on day 18, FDG
uptake increased substantially above control level. Modest increase in uptake with
time was also observed in left bone marrow
from sham-irradiated groups.
RADIATION EFFECT
ON
BONE MARROW FDG UPTAKE • Higashi et al.
2029
Downloaded from jnm.snmjournals.org by on November 17, 2015. For personal use only.
FIGURE 3. Time course of FDG uptake
(%ID/g/kg) in spleen (A) and lung (B): FDG
uptake of spleen (left) and lung (right) after
local irradiation in irradiated groups compared with those of sham groups. Increased
FDG uptake was observed in spleen and in
lung on day 18.
day 9. The increased numbers in mature red blood cells
observed on day 9 may be caused by hemodilution associated with the collapse of the irradiated sinusoids. The
percentages of degenerative cells on day 9 increased to 57%
in 200 cells counted, whereas those in the other groups were
,20%.
The percentages of total granulocytic cells of the irradiated right bone marrow showed an increase on day 1
TABLE 3
Results of Irradiated Bone Marrow Specimen from Irradiated Groups Compared with Sham-Irradiated Group
Sham-irradiated
day 18, n 5 4
Parameter
Total granulocytic cells* (%)
Myeloblast
Promyelocyte
Myelocyte neutrophil
Metamyelocyte neutrophil
Band neutrophil
Segmented neutrophil
Eosinophil
Basophil
Myeloid mitotic figures
Atypical myeloid cells
Total erythroid cells* (%)
Rubriblast
Prorubicyte
Rubricyte, basophilic
Rubricyte, polychromatophilic
Metarubricyte
Erythroid mitotic figures
Lymphoid* (%)
Monocyte* (%)
Plasma cell* (%)
Mast cell* (%)
Lymphoid mitotic figures* (%)
M/ET†
Degenerative cells‡ (%)
Megakaryocyte
Overall cellularity
31.7 6 1.35
0.0 6 0.09
0.4 6 0.16
1.1 6 0.71
3.0 6 0.70
8.9 6 3.21
12.9 6 2.56
4.6 6 2.10
0.7 6 0.49
0.2 6 0.01
0.0 6 0.00
28.6 6 5.10
0.0 6 0.10
0.8 6 0.62
18.7 6 4.89
7.9 6 1.59
0.8 6 0.26
0.4 6 0.40
37.2 6 6.91
0.8 6 0.52
0.7 6 0.39
0.9 6 0.67
0.0 6 0.00
1.1 6 0.16
9–19
Adequate
Irradiated marrow from irradiated groups
Day 1, n 5 3
Day 9, n 5 3
Day 18, n 5 3
55.6 6 5.19
0.0 6 0.00
0.1 6 0.11
0.4 6 0.10
1.1 6 0.29
7.2 6 2.53
38.2 6 5.77
3.6 6 1.51
0.3 6 0.29
0.1 6 0.11
4.5 6 0.01
4.0 6 0.63
0.1 6 0.11
0.0 6 0.00
0.9 6 0.23
1.4 6 0.40
1.7 6 0.45
0.0 6 0.00
37.1 6 3.45
2.1 6 1.13
1.0 6 0.13
0.2 6 0.20
0.0 6 0.00
14.2 6 3.78
,20
Adequate
Moderately decreased
6.7 6 1.63
0.1 6 0.11
0.3 6 0.10
0.4 6 0.64
1.0 6 0.46
1.0 6 0.25
2.7 6 1.84
0.9 6 0.19
0.0 6 0.00
0.3 6 0.10
0.0 6 0.00
70.7 6 8.15
0.6 6 0.09
1.5 6 0.65
52.4 6 5.40
13.0 6 3.73
1.6 6 0.38
1.6 6 0.71
20.5 6 7.03
1.6 6 0.71
0.4 6 0.10
0.2 6 0.01
0.0 6 0.00
0.1 6 0.04
38–57
Severely decreased
Severely decreased
17.3 6 5.63
0.0 6 0.00
0.4 6 0.21
1.1 6 0.85
2.7 6 0.50
5.1 6 1.67
5.4 6 3.11
1.9 6 1.16
0.3 6 0.28
0.4 6 0.38
0.0 6 0.00
27.9 6 8.32
0.1 6 0.10
0.7 6 0.29
15.4 6 5.23
9.1 6 3.74
2.2 6 0.93
0.4 6 0.58
52.8 6 5.28
1.2 6 0.57
0.4 6 0.17
0.5 6 0.11
0.0 6 0.00
0.7 6 0.48
,20
Decreased
Same as sham group
*Percentage of each cell type in 500 cells examined (mean 6 SD).
†Mean 6 SD.
‡Percentage of each cell type in 200 cells examined.
2030
THE JOURNAL
OF
NUCLEAR MEDICINE • Vol. 41 • No. 12 • December 2000
Downloaded from jnm.snmjournals.org by on November 17, 2015. For personal use only.
TABLE 4
Results of Nonirradiated Bone Marrow Specimen from Irradiated Groups Compared with Sham-Irradiated Group
Parameter
Total granulocytic cells* (%)
Myeloblast
Promyelocyte
Myelocyte neutrophil
Metamyelocyte neutrophil
Band neutrophil
Segmented neutrophil
Eosinophil
Basophil
Myeloid mitotic figures
Atypical myeloid cells
Total erythroid cells* (%)
Rubriblast
Prorubicyte
Rubricyte, basophilic
Rubricyte, polychromatophilic
Metarubricyte
Erythroid mitotic figures
Lymphoid* (%)
Monocyte* (%)
Plasma cell* (%)
Mast cell* (%)
Lymphoid mitotic figures* (%)
M/E*†
Degenerative cells‡ (%)
Megakaryocyte
Overall cellularity
Nonirradiated marrow from irradiated groups
Nonsham-irradiated
day 18, n 5 4
34.2 6 3.86
0.1 6 0.11
0.5 6 0.30
1.2 6 0.52
4.3 6 1.67
9.5 6 2.64
13.0 6 2.57
4.9 6 1.44
0.7 6 0.50
0.0 6 0.00
0.0 6 0.00
27.3 6 8.36
0.0 6 0.10
0.9 6 0.63
17.7 6 5.51
7.5 6 3.22
1.0 6 0.61
0.2 6 0.16
37.0 6 4.40
0.6 6 0.29
0.3 6 0.19
0.5 6 0.35
0.0 6 0.00
1.4 6 0.69
9–19
Adequate
Day 1, n 5 3
Day 9, n 5 3
Day 18, n 5 3
33.1 6 2.52
0.1 6 0.23
1.0 6 0.09
1.9 6 0.70
4.7 6 1.54
10.0 6 0.92
10.6 6 1.59
4.1 6 0.34
0.2 6 0.00
0.3 6 0.21
0.0 6 0.00
27.3 6 7.83
0.1 6 0.11
0.4 6 0.52
15.1 6 3.01
9.8 6 3.62
1.7 6 1.45
0.2 6 0.20
38.0 6 6.82
0.4 6 0.28
0.7 6 0.30
0.5 6 0.30
0.0 6 0.00
1.3 6 0.52
,20
No change
Same as sham group
43.9 6 1.68
0.3 6 0.23
0.9 6 0.42
2.2 6 0.90
4.1 6 1.37
10.1 6 3.17
18.7 6 4.99
6.9 6 1.40
0.4 6 0.18
0.3 6 0.23
0.0 6 0.00
34.0 6 8.19
0.2 6 0.43
1.0 6 0.16
24.3 6 5.17
7.0 6 2.45
1.1 6 0.25
0.4 6 0.31
20.4 6 6.75
1.0 6 0.69
0.6 6 0.40
0.1 6 0.23
0.0 6 0.00
1.4 6 0.42
18–20
No change
Same as sham group
33.6 6 4.30
0.0 6 0.00
0.1 6 0.11
2.0 6 0.78
5.2 6 0.91
10.8 6 3.59
12.2 6 0.95
3.1 6 0.82
0.1 6 0.11
0.2 6 0.21
0.0 6 0.00
29.3 6 6.95
0.1 6 0.11
0.7 6 0.19
21.5 6 7.60
6.4 6 1.39
0.5 6 0.22
0.1 6 0.11
35.7 6 3.15
0.6 6 0.31
0.7 6 0.22
0.1 6 0.11
0.0 6 0.00
1.2 6 0.46
,20
No change
Same as sham group
*Percentage of each cell type in 500 cells examined (mean 6 SD).
†Mean 6 SD.
‡Percentage of each cell type in 200 cells examined.
(55.6%) and then fell below the control level on days 9 and
18 (6.7% and 17.3%, respectively). The percentages of
myeloid mitotic figures on day 1 were lower than that of the
sham group and then slightly increased on days 9 and 18.
The increased percentages of mature neutrophils (band and
segmented) were observed on day 1 (45.4%), then decreased
on day 9 (3.7%), and were still relatively low on day 18
(10.5%) compared with that of the sham group (21.8%). A
decrease in megakaryocytes was also observed on days 9
and 18.
The percentages of total erythroid cells on the irradiated
marrow were decreased on day 1 (4.0%), increased remarkably on day 9 (70.7%), and then returned to the sham group
level. The percentages of erythroid mitotic figures also
showed a similar fluctuation. The percentages of erythroid
mitotic figures on day 9 were 4-fold higher than those of the
sham group. The premature erythroid cells (rubriblast,
prorubricyte, and rubricyte), except for metarubricyte,
showed the highest percentages on day 9.
The smear results from nonirradiated left bone marrow
from the irradiated rats did not show any significant changes
compared with the sham group (Table 4). The M/E, percent-
RADIATION EFFECT
ON
ages of degenerative cells, overall cellularity, and cellularity
of megakaryocytes were stable from day 1 to day 18. On day
9, the percentages of total granulocytic cells and total
erythrocytic cells increased slightly, but without any change
in the M/E. The percentages of myeloid and erythroid
mitotic figures were also the highest on day 9.
DISCUSSION
The preoperative assessment of patients considered for
surgery of lung or breast cancer sometimes results in the
detection of unresectable tumor with bone metastases (1). At
the time of initial diagnosis, up to 45% of breast cancer
patients with lymph node involvement exhibit microscopic
bone marrow metastases (14). Bone scintigraphy is widely
used for assessing the involvement of bone metastasis but
has a poor specificity. FDG PET has been shown to be a
useful modality in staging malignant tumors with high
sensitivity and high specificity (4,5). PET has also been
shown to be a promising tool in assessing treatment response
to chemotherapy and radiotherapy (2,15). An increasing use
of FDG PET in evaluation of the treatment effect of
BONE MARROW FDG UPTAKE • Higashi et al.
2031
Downloaded from jnm.snmjournals.org by on November 17, 2015. For personal use only.
FIGURE 4. Smear specimens of irradiated and sham-irradiated bone marrow: smear specimens of irradiated right bone marrow on
day 1 (B), day 9 (C), and day 18 (D) compared with sham-irradiated marrow on day 18 (A). Overall cellularity decreased moderately on
day 1, showed severe cellular loss on day 9, and then increased back to control level on day 18. Fraction of mature neutrophils (long
arrows) increased on day 1. On day 9, number of nucleated cells decreased and increased number of mature red blood cells was
observed, which suggested collapse of irradiated sinusoids. Increased number of premature erythroid cells (rubricyte [long arrows] or
prorubricyte [short arrows]) was also observed. Quick III Hematology Stain (MidAtlantic Biomedical, Inc., Paulsboro, NJ), 3400; bar 5
20 µm.
irradiation on bone metastases of tumors may be expected in
the future.
Our results in this experimental system showed that
localized irradiation of normal bone marrow with a single
dose of 10 Gy caused considerable changes in FDG uptake
in the early follow-up period of both irradiated and nonirradiated contralateral marrow. Irradiated marrow had a transient rise of FDG uptake, followed by a decline, and then
normalization. Nonirradiated marrow from irradiated animals had a transient rise in FDG uptake. Knowledge of this
phenomenon may be important for FDG PET diagnosis
because this kind of radiation-induced fluctuation could
make FDG PET diagnosis difficult or confusing (or both) in
evaluation of the treatment effect if it were performed as an
early follow-up after irradiation. FDG uptake of nonirradiated marrow should not be misinterpreted as bone marrow
metastasis. In addition, the significant rise in FDG uptake
observed in the nonirradiated marrow indicates that it may
be inadequate to use an irradiated-to-nonirradiated marrow
uptake ratio for the purpose of the evaluation of treatment
effect on metastatic bone lesions. Although we have no
evidence on how long the fluctuation of FDG uptake in bone
2032
THE JOURNAL
OF
marrow will last, evaluation of the treatment response of
irradiated bone marrow metastases with FDG PET should be
interpreted with caution within 30 d after irradiation.
Ultimately, careful sequential FDG PET evaluation of
human marrow at various time points after irradiation will
be needed to determine the significance of these preclinical
findings.
Our results are, on first inspection, seemingly at variance
with a previous study that evaluated FDG uptake in irradiated bone marrow and other tissues in rodents (11). In that
study, FDG uptake in bone and bone marrow did not show a
significant change after several doses of irradiation. However, we believe that this variance results from a different
experimental design, in which bone and bone marrow were
examined together only at 6 d after irradiation compared
with our multiple sequential assessment of bone and bone
marrow after irradiation.
As for the irradiation effect on FDG uptake in tumor,
multiple studies have shown that FDG accumulation in
irradiated tumor cells or tumor tissue is determined as a
result of the trade-off of several positive and negative
factors. Some clinical and experimental studies have shown
NUCLEAR MEDICINE • Vol. 41 • No. 12 • December 2000
Downloaded from jnm.snmjournals.org by on November 17, 2015. For personal use only.
Second, infiltration of inflammatory cells should be
considered. The changes in the percentages of neutrophils in
this study are in agreement with the results of previous
studies (29,30). These reports showed that infiltration of
inflammatory cells was observed in irradiated regions within
8 h after irradiation and had disappeared from there within
2–10 d. An increased uptake of 111In-labeled leukocytes has
also been observed in the irradiated bone marrow 1 d after
irradiation (31). We believe that most neutrophils observed
in the irradiated marrow were activated infiltrating cells
from outside of the irradiation field. In this study, although
the overall cellularity was moderately lower on day 1, the
percentage of mature neutrophils observed in the irradiated
marrow was 45% of total marrow cells on day 1, at least
2-fold higher than that of the sham group. In addition, the
main energy production pathway in neutrophils is glycolysis
(32). FDG is likely to accumulate in the region with
increased glycolysis. Thus, we conclude that the overall
FDG uptake of activated neutrophils in the irradiated bone
marrow on day 1 was much higher than that of nonactivated
neutrophils on day 0.
In this study, the proliferative activity of bone marrow
cells after irradiation had little apparent relationship with
FDG uptake observed in the irradiated marrow. The increased percentages in granulocytic cells on day 1 are
caused by the profound loss of erythroid cells, not the
proliferation of granulocytic cells. The increased percentages of the myeloid mitotic figures on day 18 suggest that
the recovery of granulocytic cells was active around 18 d
after irradiation. The evaluation of megakaryocytes also
showed a change over time that was similar to that seen with
the granulocytic cells. In contrast, the increased percentages
in total erythroid cells on day 9 may be associated with both
the profound loss of granulocytic cells and the increased
proliferation of erythroid cells. The highest percentages of
the mitotic figures and the premature cells observed on day 9
suggest that the proliferation and regeneration of erythroid
cells had started between 1 and 9 d after irradiation. The
timing is compatible with each of their transit times in bone
marrow, as 1 wk for erythroid cells and 10–14 d for
granulocytic and megakaryocytic cells (33). These findings
indicate that the proliferation of bone marrow cells increased
around day 9 through day 18; however, no increase in FDG
uptake was observed in the irradiated marrow on day 9 and
day 18. Our results are compatible with the findings of a
previous in vitro study using cancer cells: FDG uptake does
not strongly relate to the proliferative activity but is more
closely related to the number of viable tumor cells (20).
Table 5 summarizes the relationship between FDG uptake
and cytologic change in the irradiated and nonirradiated
bone marrow. The increased FDG uptake observed on day 1
in the irradiated marrow may be explained by the trade-off
between the infiltration of neutrophils and the relatively
decreased cellularity. The decreased FDG uptake on day 9 is
easily explained by the overall cellular loss. However, the
increased FDG uptake observed on day 18 in the nonirradi-
a reduction in FDG uptake in tumor tissue and cells after
irradiation (11,16,17), whereas other in vivo and in vitro
studies revealed transiently increased FDG uptake in the
early phase after irradiation (18,19). Higashi et al. (18,20)
reported a substantial increase in the overall tracer uptake
with an increased uptake per cancer cell after irradiation, in
spite of a decrease in viable cell number in vitro. Fujibayashi
et al. (19) showed a transient increase in glucose transporter-1 messenger RNA expression and the enzymatic
activity of hexokinase in cultured tumor cells within a few
hours after exposure to ionizing radiation. In their study, a
single radiation exposure with 10 Gy did not change the
number of tumor cells until 4 d, although it increased the
deoxyglucose uptake within a few hours. Furthermore,
inflammatory reactions with high metabolic activity have
also been reported to have some influence on the FDG
accumulation in irradiated tumor tissue (21). Our findings
suggest that similar phenomena can occur in normal bone
marrow after irradiation.
Sequential histopathologic changes, acute and subacute,
are typically observed in irradiated normal bone and bone
marrow (22–24). This damage is summarized as follows: (a)
decreased marrow cellularity, (b) extravasation of erythrocytes and increased blood pool, (c) dilatation or collapse of
the marrow sinusoids, (d) increased bone marrow blood
flow, (e) increased vascular permeability, (f) migration of
premature progenitor cells from outside and their proliferation, and (g) infiltration of inflammatory cells. Aspects of
a–c and f and g were clearly observed in this study. As for the
relationship between FDG accumulation and the histologic
changes, a decrease in marrow cellularity would be expected
to result in decreased FDG accumulation (20), whereas
infiltration of inflammatory cells would be expected to result
in increased FDG accumulation (21).
Although total cell counting of the entire bone marrow
was not performed in this study, the results of overall
cellularity in our smear specimen indicate a severe total cell
loss in the irradiated marrow by day 9. This finding is
generally in agreement with the previous studies in rodents
and humans, in which the cellularity of total bone marrow in
irradiated marrow reached a nadir between 4 and 10 d after
single local irradiation of various doses (25,26). The 10-Gy
dose, which was used as a single irradiation in this study, is
also known as a myeloablative dose in many species (27,28).
From the cytology and the literature, we assume that most
irradiated progenitor cells were still morphologically alive
on day 1 but were on the course to cell death and that most of
the irradiated cells were already dead on day 9. However,
migration of progenitor cells from outside the irradiated field
has been observed within 3 h and continues until around 3
wk after local irradiation (25,28). Therefore, the fluctuation
of overall cellularity observed in the irradiated marrow in
this study is believed to be the combined result of the
decreasing number of irradiated cells and the increasing
number of migrating progenitor cells and infiltrating inflammatory cells.
RADIATION EFFECT
ON
BONE MARROW FDG UPTAKE • Higashi et al.
2033
Downloaded from jnm.snmjournals.org by on November 17, 2015. For personal use only.
TABLE 5
Correlation Between FDG Uptake and Cytologic Change in Bilateral Bone Marrow from Irradiated Groups
Bone marrow
Irradiated
Day 1
Day 9
Day 18
Nonirradiated
Day 1
Day 9
Day 18
FDG uptake
Overall cellularity
Increased
Decreased
Control level
Moderately decreased
Pancellular loss
Control level
Increased
Decreased
Decreased
No change
No change
Increased
No change
No change
No change
No change
Moderately increased
No change
ated marrow cannot be explained by the results of the smear
specimen.
Concerning the nonirradiated contralateral bone marrow,
the smear specimen results in this study did not show any
significant change compared with the sham group throughout the time course. However, subtle histologic changes,
which could not be detected in our evaluation, are likely to
be responsible for the mild changes in FDG uptake in the
marrow over time. Our cytologic results are at variance with
some of the previous studies, in which overall cellularity in
shielded bone marrow also showed a smaller, but similar,
fluctuation after irradiation to the irradiated marrow (26,34).
This phenomenon is caused, in part, by the migration of
hematopoietic cells from nonirradiated area to irradiated
marrow (34). Therefore, the magnitude of this fluctuation of
overall cellularity in nonirradiated bone marrow appears to
depend on the irradiation dose and the irradiated area. In our
experimental system, the change in overall cellularity in
nonirradiated marrow appeared to be too subtle to be
observed by visual examination of the smear specimen.
Figure 3 showed similar increased FDG uptake on day 18
in the spleen and lung in the irradiated groups, which may
also help in understanding the mild changes in FDG uptake
in the nonirradiated marrow from the irradiated rats. Both
organs are monocyte/macrophage-rich tissues as is bone
marrow itself. This phenomenon could be explained by
systemic interactions between several cytokines, such as
interleukin-1, interleukin-3, interleukin-6, tumor necrosis
factor, granulocyte/macrophage colony-stimulating factor
(GM-CSF), and granulocyte colony-stimulating factor (GCSF). These interactions occur after irradiation and reportedly stimulate metabolism and cellularity of bone marrow
and circulation or cycling of myeloid progenitor cells
(35,36). In our previous study of normal rats and human
breast cancer patients treated with chemotherapy, FDG
uptake in bone marrow and spleen increased strikingly
during G-CSF and GM-CSF therapy and then decreased to
the control level after cessation of the therapy (10,37). Even
if no significant cytologic change occurs, endogenous CSFs
released by systemic interactions after irradiation stimulate
the metabolism of each marrow cell, which may result in
increased FDG uptake in the nonirradiated marrow. The
increased uptake observed on day 18 in the spleen and lung
may also be explained by the effect of CSF released either by
2034
THE JOURNAL
OF
Mature neutrophil
the irradiated bone marrow or by each of the individual
macrophage-rich tissues. Thus, local irradiation not only
affects glucose metabolism of the irradiated bone marrow
but also has systemic effects on the metabolism of the
nonirradiated tissue, such as contralateral marrow, spleen, or
lung.
It is likely, however, that the results of a trade-off may
change net marrow uptake upward or downward depending
on the dose and methods of irradiation. Fractionation or
hyperfractionation methods of irradiation generally tend to
spare normal tissues because of repair from irradiation
damage between dose fractions. Further study is needed to
determine the effects of fractionated radiation on normal
marrow.
CONCLUSION
In this experimental rodent model, normal bone marrow
FDG uptake transiently rises, then falls, and then returns to
baseline after external beam irradiation. Knowledge of this
early biphasic radiation effect on normal bone marrow FDG
uptake may be important for accurately assessing the
efficacy of radiation therapy on bone metastasis using FDG
PET after irradiation. Sequential studies in patients soon
after radiation therapy appear to be warranted to clinically
verify these preclinical observations.
ACKNOWLEDGMENTS
The authors thank Mary A. Davis (Radiation Oncology,
University of Michigan, Ann Arbor, MI) for technical
assistance with the rat irradiation procedure and Suzanne M.
Carlson (University of Michigan) for her valuable editorial
assistance. The authors also thank the members of Dr.
Wahl’s laboratory and the staff members of the PET center
(University of Michigan). This study was supported by
National Institutes of Health grants CA52880 and 2P30
CA46592.
REFERENCES
1. Shpall EJ, Gee AP, Hogan C, et al. Bone marrow metastases. Hematol Oncol Clin
North Am. 1996;10:321–343.
2. Wahl RL, Zasadny K, Helvie M, Hutchins GD, Weber B, Cody R. Metabolic
monitoring of breast cancer chemohormonotherapy using positron emission
tomography: initial evaluation. J Clin Oncol. 1993;11:2101–2111.
NUCLEAR MEDICINE • Vol. 41 • No. 12 • December 2000
Downloaded from jnm.snmjournals.org by on November 17, 2015. For personal use only.
20. Higashi K, Clavo AC, Wahl RL. Does FDG uptake measure proliferative activity
of human cancer cells? In vitro comparison with DNA flow cytometry and tritiated
thymidine uptake. J Nucl Med. 1993;34:414–419.
21. Kubota R, Yamada S, Kubota K, Ishiwata K, Tamahashi N, Ido T. Intratumoral
distribution of fluorine-18-fluorodeoxyglucose in vivo: high accumulation in
macrophages and granulation tissues studied by microautoradiography. J Nucl
Med. 1992;33:1972–1980.
22. King MA, Casarett GW, Weber DA. A study of irradiated bone. I. Histopathologic
and physiologic changes. J Nucl Med. 1979;20:1142–1149.
23. Knospe WH, Blom J, Crosby WH. Regeneration of locally irradiated bone
marrow. I. Dose dependent, long-term changes in the rat, with particular emphasis
upon vascular and stromal reaction. Blood. 1966;28:398–415.
24. Ullrich RL, Casarett GW. Interrelationship between the early inflammatory
response and subsequent fibrosis after radiation exposure. Radiat Res. 1977;72:
107–121.
25. Croizat H, Frindel E, Tubiana M. Abscopal effect of irradiation on haemopoietic
stem cells of shielded bone marrow: role of migration. Int J Radiat Biol.
1976;30:347–358.
26. Krizsa F, Rak K, Sovenyi E. Bone marrow megakaryocyte system and plasma
thrombopoietic activity in x-ray irradiated mice with and without partial shielding.
Strahlentherapie. 1969;137:712–717.
27. Croizat H, Frindel E, Tubiana M. Long term radiation effects on the bone marrow
stem cells of C3H mice. Int J Radiat Biol. 1979;36:91–99.
28. Nothdurft W, Calvo W, Klinnert V, Steinbach KH, Werner C, Fliedner TM. Acute
and long-term alterations in the granulocyte/macrophage progenitor cell (GMCFC) compartment of dogs after partial-body irradiation: irradiation of the upper
body with a single myeloablative dose. Int J Radiat Oncol Biol Phys. 1986;12:949–
957.
29. Kallfass E, Kramling HJ, Schultz-Hector S. Early inflammatory reaction of the
rabbit coeliac artery wall after combined intraoperative (IORT) and external
(ERT) irradiation. Radiother Oncol. 1996;39:167–178.
30. Vos J, Aarnoudse MW, Dijk F, Lamberts HB. On the cellular origin and
development of atheromatous plaques: a light and electron microscopic study of
combined x-ray and hypercholesterolemia-induced atheromatosis in the carotid
artery of the rabbit. Virchows Archiv. 1983;43:1–16.
31. Palestro CJ, Kim CK, Vega A, Goldsmith SJ. Acute effects of radiation therapy on
indium-111-labeled leukocyte uptake in bone marrow. J Nucl Med. 1989;30:1889–
1891.
32. Curnutte JT, Babior BM. Metabolism of Neutrophils. New York, NY: McGrawHill; 1991:775–780.
33. Jain NC. Schalm’s Veterinary Hematology. 4th ed. Philadelphia, PA: Lea and
Febiger; 1986.
34. Croizat H, Frindel E, Tubiana M. Proliferative activity of the stem cells in the
bone-marrow of mice after single and multiple irradiations (total-or partial-body
exposure). Int J Radiat Biol. 1970;18:347–358.
35. Hallahan DE, Haimovitz-Friedman A, Kufe DW, Fuks Z, Weichselbaum RR. The
role of cytokines in radiation oncology. Important Adv Oncol. 1993:71–80.
36. Herskind C, Bamberg M, Rodemann HP. The role of cytokines in the development
of normal-tissue reactions after radiotherapy. Strahlenther Onkol. 1998;174:
12–15.
37. Sugawara Y, Zasadny KR, Kison PV, Baker LH, Wahl RL. Splenic fluorodeoxyglucose uptake increased by granulocyte colony-stimulating factor therapy: PET
imaging results. J Nucl Med. 1999;40:1456–1462.
3. Wahl RL, Quint LE, Greenough RL, Meyer CR, White RI, Orringer MB. Staging
of mediastinal non-small cell lung cancer with FDG PET, CT, and fusion images:
preliminary prospective evaluation. Radiology. 1994;191:371–377.
4. Bender H, Kirst J, Palmedo H, et al. Value of 18fluoro-deoxyglucose positron
emission tomography in the staging of recurrent breast carcinoma. Anticancer
Res. 1997;17:1687–1692.
5. Bury T, Dowlati A, Paulus P, Hustinx R, Radermecker M, Rigo P. Staging of
non-small-cell lung cancer by whole-body fluorine-18 deoxyglucose positron
emission tomography. Eur J Nucl Med. 1996;23:204–206.
6. Som P, Atkins HL, Bandoypadhyay D, et al. A fluorinated glucose analog,
2-fluoro-2-deoxy-D-glucose (F-18): nontoxic tracer for rapid tumor detection. J
Nucl Med. 1980;21:670–675.
7. Wahl RL, Kaminski MS, Ethier SP, Hutchins GD. The potential of 2-deoxy2[18F]fluoro-D-glucose (FDG) for the detection of tumor involvement in lymph
nodes. J Nucl Med. 1990;31:1831–1835.
8. Harney JV, Wahl RL, Liebert M, et al. Uptake of 2-deoxy, 2-(18F) fluoro-Dglucose in bladder cancer: animal localization and initial patient positron emission
tomography. J Urol. 1991;145:279–283.
9. Yao WJ, Hoh CK, Hawkins RA, et al. Quantitative PET imaging of bone marrow
glucose metabolic response to hematopoietic cytokines. J Nucl Med. 1995;36:794–
799.
10. Sugawara Y, Fisher SJ, Zasadny KR, Kison PV, Baker LH, Wahl RL. Preclinical
and clinical studies of bone marrow uptake of fluorine-1-fluorodeoxyglucose with
or without granulocyte colony-stimulating factor during chemotherapy. J Clin
Oncol. 1998;16:173–180.
11. Reinhardt MJ, Kubota K, Yamada S, Iwata R, Yaegashi H. Assessment of cancer
recurrence in residual tumors after fractionated radiotherapy: a comparison of
fluorodeoxyglucose, L-methionine and thymidine. J Nucl Med. 1997;38:280–287.
12. Zasadny KR, Wahl RL. Standardized uptake values of normal tissues at PET with
2-[fluorine-18]-fluoro-2-deoxy-D-glucose: variations with body weight and a
method for correction. Radiology. 1993;189:847–850.
13. Jones SC, Alavi A, Christman D, Montanez I, Wolf AP, Reivich M. The radiation
dosimetry of 2 [F-18]fluoro-2-deoxy-D-glucose in man. J Nucl Med. 1982;23:613–
617.
14. Dearnaley DP, Ormerod MG, Sloane JP. Micrometastases in breast cancer:
long-term follow-up of the first patient cohort. Eur J Cancer. 1991;27:236–239.
15. Rege SD, Chaiken L, Hoh CK, et al. Change induced by radiation therapy in FDG
uptake in normal and malignant structures of the head and neck: quantitation with
PET. Radiology. 1993;189:807–812.
16. Abe Y, Matsuzawa T, Fujiwara T, et al. Assessment of radiotherapeutic effects on
experimental tumors using 18F-2-fluoro-2-deoxy-D-glucose. Eur J Nucl Med.
1986;12:325–328.
17. Daemen BJ, Elsinga PH, Paans AM, Wieringa AR, Konings AW, Vaalburg W.
Radiation-induced inhibition of tumor growth as monitored by PET using
L-[1-11C]tyrosine and fluorine-18-fluorodeoxyglucose. J Nucl Med. 1992;33:373–
379.
18. Higashi K, Clavo AC, Wahl RL. In vitro assessment of 2-fluoro-2-deoxy-Dglucose, L-methionine and thymidine as agents to monitor the early response of a
human adenocarcinoma cell line to radiotherapy. J Nucl Med. 1993;34:773–779.
19. Fujibayashi Y, Waki A, Sakahara H, et al. Transient increase in glycolytic
metabolism in cultured tumor cells immediately after exposure to ionizing
radiation: from gene expression to deoxyglucose uptake. Radiat Res. 1997;147:
729–734.
RADIATION EFFECT
ON
BONE MARROW FDG UPTAKE • Higashi et al.
2035
Downloaded from jnm.snmjournals.org by on November 17, 2015. For personal use only.
Evaluation of the Early Effect of Local Irradiation on Normal Rodent Bone Marrow
Metabolism Using FDG: Preclinical PET Studies
Tatsuya Higashi, Susan J. Fisher, Raya S. Brown, Kunihiro Nakada, Gail L. Walter and Richard L. Wahl
J Nucl Med. 2000;41:2026-2035.
This article and updated information are available at:
http://jnm.snmjournals.org/content/41/12/2026
Information about reproducing figures, tables, or other portions of this article can be found online at:
http://jnm.snmjournals.org/site/misc/permission.xhtml
Information about subscriptions to JNM can be found at:
http://jnm.snmjournals.org/site/subscriptions/online.xhtml
The Journal of Nuclear Medicine is published monthly.
SNMMI | Society of Nuclear Medicine and Molecular Imaging
1850 Samuel Morse Drive, Reston, VA 20190.
(Print ISSN: 0161-5505, Online ISSN: 2159-662X)
© Copyright 2000 SNMMI; all rights reserved.
Keep reading this paper — and 50 million others — with a free Academia account
Used by leading Academics

anna ozhiganova
Friedrich-Alexander-Universität Erlangen-Nürnberg

Rodrigo Toniol
Universidade Federal do Rio de Janeiro (UFRJ)

Denise L Spitzer
University of Alberta

Donna M Goldstein
University of Colorado, Boulder