Meat Science 95 (2013) 98–109
Contents lists available at SciVerse ScienceDirect
Meat Science
journal homepage: www.elsevier.com/locate/meatsci
Effects of feeding flaxseed or sunflower-seed in high-forage diets on beef production,
quality and fatty acid composition
C. Mapiye a, J.L. Aalhus a, T.D. Turner a, D.C. Rolland a, J.A. Basarab b, V.S. Baron a, T.A. McAllister c, H.C. Block d,
B. Uttaro a, O. Lopez-Campos a, S.D. Proctor e, M.E.R. Dugan a,⁎
a
Agriculture and Agri-Food Canada, Lacombe Research Centre, 6000 C & E Trail, Lacombe, Alberta T4L 1W1, Canada
Alberta Agriculture and Rural Development, Lacombe Research Centre, 6000 C & E Trail, Lacombe, Alberta T4L 1W1, Canada
Agriculture and Agri-Food Canada, Lethbridge Research Centre, 1st Avenue South 5403, PO Box 3000, Lethbridge, Alberta T1J 4B1, Canada
d
Agriculture and Agri-Food Canada, Brandon Research Centre, 18th Street and Grand Valley Road, P.O. Box 1000A, RR3, Brandon, Manitoba R7A 5Y3, Canada
e
Metabolic and Cardiovascular Diseases (MCVD) Laboratory, Alberta Diabetes and Mazankowski Institutes, Li Ka Shing (LKS) Centre for Health Research Innovation, University of Alberta,
Edmonton, Alberta T6G 2E1, Canada,
b
c
a r t i c l e
i n f o
Article history:
Received 7 February 2013
Received in revised form 26 March 2013
Accepted 27 March 2013
Keywords:
Beef production
Conjugated linoleic acid
Grass hay
Red clover silage
a b s t r a c t
Yearling steers were fed 70:30 forage:concentrate diets for 205 d, with either grass hay (GH) or red clover
silage (RC) as the forage source, and concentrates containing either sunflower-seed (SS) or flaxseed (FS),
each providing 5.4% oil to diets. Feeding diets containing SS versus FS significantly improved growth and carcass
attributes (P b 0.05), significantly reduced meat off-flavor intensity (P b 0.05), and significantly increased intramuscular proportions of vaccenic (t11-18:1), rumenic (c9,t11-CLA) and n−6 fatty acids (FA, P b 0.05). Feeding
diets containing FS versus SS produced significantly darker and redder meat with greater proportions of atypical
dienes (P b 0.05). A significant forage × oilseed type interaction (P b 0.05) was found for n−3 FA, α-linolenic
acid, and conjugated linolenic acid, with their greatest intramuscular proportions found when feeding the
RC-FS diet. Feeding GH versus RC also significantly improved growth and carcass attributes, sensory tenderness
(P b 0.05) and significantly influenced intramuscular FA composition (P b 0.05), but overall, forage effects on FA
profiles were limited compared to effects of oilseed.
Crown Copyright © 2013 Published by Elsevier Ltd. All rights reserved.
1. Introduction
Beef lipids typically have high contents of saturated fatty acids
(SFA), compared to tissues from monogastric species, due to extensive ruminal biohydrogenation (BH) of polyunsaturated fatty acids
(PUFA; Raes, De Smet, & Demeyer, 2004). Efforts have been made to
increase amounts of PUFA in beef, particularly omega-3 (n− 3)
PUFA and PUFA BH intermediates, which may have health benefits
for consumers (Dilzer & Park, 2012; Molendi-Coste, Legry, & Leclercq,
2011). The challenges have been to define appropriate diets and
rumen conditions to promote accumulation of PUFA and their BH
intermediates in beef.
Abbreviations: AD, atypical dienes; ADG, average daily gain; ALA, α-linolenic acid; BCFA,
branched-chain fatty acids; BH, biohydrogenation; c, cis; CLA, conjugated linoleic acids;
CLNA, conjugated linolenic acids; d, days; DHA, docosahexaenoic acid; DM, dry matter;
DMI, dry matter intake; DPA, docosapentaenoic acid; EPA, eicosapentaenoic acid; FA, fatty
acids; FAME, fatty acid methyl esters; GC, gas chromatography; FS, flaxseed; GH, grass hay;
LA, linoleic acid; LT, longissimus thoracis; MUFA, monounsaturated fatty acids; n−3,
omega-3; n−6, omega-6; PPO, polyphenol oxidase; PUFA, polyunsaturated fatty acids; RC,
red clover silage; RA, rumenic acid; SS, sunflower seed; SFA, saturated fatty acids; t, trans;
VA, vaccenic acid; vs., versus.
⁎ Corresponding author. Tel.: +1 403 782 8124.
E-mail address: duganm@agr.gc.ca (M.E.R. Dugan).
To substantially increase PUFA and their BH intermediates in beef,
typically an oil or oilseed source of PUFA must be fed while creating
rumen conditions conducive to promote PUFA bypass or partial as opposed to complete BH (Jenkins & Bridges, 2007). To this end, our research
group has undertaken a series of studies feeding diets containing 10–15%
flaxseed (FS), a rich source of α-linolenic acid (18:3n−3, ALA) to cattle
and resulting in increased deposition of n−3 PUFA in total muscle FA
by 0.7–1.1% (Juárez et al., 2011; Mapiye et al., 2013; Nassu et al., 2011).
The type (He et al., 2012; Nassu et al., 2011) and level (Aharoni, Orlov,
& Brosh, 2004; Mir et al., 2003) of forage can, however, have overriding
effects on accumulation of PUFA BH intermediates in beef. Juárez et al.
(2011) fed steers 10% FS in a high (73%) barley grain diet with 22%
alfalfa/brome hay, and found limited accumulations of either ALA or its
BH intermediates. In this study, the PUFA BH pathway favored accumulation of trans (t)13/t14-18:1 instead of t11-18:1 (vaccenic acid, VA), and
atypical dienes (AD, i.e., non-conjugated, non-methylene interrupted
dienes) instead of conjugated linoleic acid (CLA). Nassu et al. (2011)
fed FS to cull cows in 50:50 forage:concentrate diets with either grass
hay (GH) or barley silage as the forage source for an extended period
(20 weeks), and found that feeding GH-FS promoted greater accumulations of PUFA BH intermediates, with VA as the major trans mononene.
In addition, feeding GH-FS yielded more AD than barley silage-FS, and
for both diets, AD exceeded amounts of total CLA and total n−3 PUFA.
0309-1740/$ – see front matter. Crown Copyright © 2013 Published by Elsevier Ltd. All rights reserved.
http://dx.doi.org/10.1016/j.meatsci.2013.03.033
99
C. Mapiye et al. / Meat Science 95 (2013) 98–109
Recently, Mapiye et al. (2013) found feeding 15% FS in a 70% forage
(red clover silage, RC) diet for 215 d provided even greater accumulations of PUFA BH intermediates in beef lipids with t11-18:1 reaching a
high of 9.5% in perirenal fat, cis (c)9,t11-18:2 (rumenic acid, RA)
reaching a high of 2.9% in subcutaneous fat, and t11,c15-18:2 reaching
a high of 1.9% in perirenal fat. The increased amounts of PUFA BH intermediates were in part attributed to the amount and duration of FS feeding. In addition, the relatively high level of polyphenol oxidase (PPO)
activity in RC may have played a role, as PPO reduces rates of PUFA lipolysis and BH in the rumen (Van Ranst, Lee, & Fievez, 2011) thereby
enhancing deposition of PUFA and their BH intermediates in tissues
(Lee, Evans, Nute, Richardson, & Scollan, 2009). The benefits of feeding
RC were, however, not evaluated in comparison with other forage
sources such as GH which have demonstrated positive effects on the accumulation of PUFA BH intermediates in beef (Nassu et al., 2011).
Feeding sources of linoleic acid (18:2n−6, LA), for example
sunflower-seed (SS) or oil, in high-forage diets can also increase PUFA
BH intermediates in beef, but these are mostly restricted to VA and RA
(Basarab, Mir, et al., 2007; Noci, French, Monahan, & Moloney, 2007).
Feeding SS or FS in high forage diets can, therefore, increase VA and RA
in beef, and feeding FS can also increase other ALA specific BH intermediates. Consuming VA and RA may have positive health effects for humans
(Dilzer & Park, 2012; Jaudszus et al., 2012; Sofi et al., 2010), but effects of
many other PUFA BH intermediates have not been evaluated. Consequently, the objectives of the present experiment were to feed steers a
high forage diet (either RC or GH) in combination with oilseeds (either
FS or SS) for an extended period, and determine which diets would lead
to the greatest accumulations of PUFA and their related BH intermediates
in beef. In addition, animal performance, carcass traits, meat quality and
sensory attributes were evaluated since increasing the degree of FA
unsaturation in beef accentuates oxidation of fat, possibly leading to unacceptable changes in shelf-life and eating quality (Wood et al., 2004).
2. Materials and methods
Table 1
Nutrient and fatty acid composition of the experimental diets.
Dieta
Variable
GH-FS
GH-SS
RC-FS
RC-SS
Diet ingredients (% DM basis)
Red clover silage
Grass hay
Barley straw
Sunflower-seed
Flaxseed
Vitamin/mineral supplementb
Barley grain
0.0
70.0
11.5
0.0
14.3
4.2
0.0
0.0
70.0
0.0
18.4
0.0
4.2
7.4
70.0
0.0
11.5
0.0
14.3
4.2
0.0
70.0
0.0
0.0
18.4
0.0
4.2
7.4
Nutrient composition (DM basis)
Dry matter (%)
Crude protein (%)
Crude fat (%)
Calcium (%)
Phosphorus (%)
ADF (%)
NDF (%)
Digestible energyc (Mcal/kg)
93.1
13.3
6.4
1.1
0.3
44.3
53.2
2.08
93.0
13.4
6.6
1.1
0.3
45.4
57.6
2.02
46.9
14.2
8.2
1.1
0.3
43.0
55.5
2.16
46.9
14.0
8.4
1.2
0.2
44.0
61.6
2.10
Fatty acid (% of total fatty acids)
14:0
16:0
18:0
20:0
22:0
24:0
c9-18:1
c11-18:1
18:2n−6
18:3n−3
0.2
8.6
3.0
0.4
0.7
0.6
11.6
0.8
23.4
50.7
0.2
10.2
4.1
0.5
0.9
0.5
11.3
0.9
66.0
5.3
0.1
7.5
2.9
0.3
0.4
0.4
11.6
0.8
21.4
54.6
0.1
8.4
4.2
0.4
0.8
0.4
11.7
0.7
70.4
2.8
a
GH-FS, grass hay + flaxseed; GH-SS, grass hay + sunflower-seed, RC-FS, red clover
silage + flaxseed; RC-SS, red clover silage + sunflower-seed.
b
Vitamin/mineral supplement per kg DM contained 1.86% calcium, 0.93% phosphorous,
0.56% potassium, 0.21% sulfur, 0.33% magnesium 0.92% sodium, 265 ppm iron, 314 ppm
manganese, 156 ppm copper, 517 ppm zinc, 10.05 ppm iodine, 5.04 ppm cobalt, 2.98 ppm
selenium, 49,722 IU/kg vitamin A, 9944 IU/kg vitamin D3, and 3222 IU/kg vitamin E.
c
Digestible energy was calculated according to Bull (1981).
2.1. Animals and diets
Sixty-four 12-month-old British × Continental crossbred steers
with an initial mean body weight of 423.2 ± 5.93 kg were used in the
current study conducted at Lacombe Research Centre, Alberta, Canada.
Animal care was in compliance with the principles and guidelines
established by the Canadian Council on Animal Care (CCAC, 1993).
Steers were stratified by weight to four experimental diets, with two
pens of eight steers per diet. The four diets were GH-FS, GH-SS, RC-FS
and RC-SS. On a dry matter (DM) basis, diets contained 70% forage
and either SS (18.4%) or FS (14.3%), with oilseeds added to provide
the same amount of oil (5.4%, DM basis; Table 1) to each diet. All diets
included 4.2% of a vitamin mineral supplement (Table 1) and in an attempt to equalize the digestible energy of the diets, additional ground
barley grain was added to the diets containing SS, and additional barley
straw was added to the diets containing FS. Flaxseed was triple rolled,
while SS was fed whole. Steers in each pen were group fed to appetite
and were all capable of feeding at the feed bunk at the same time
(0.8 m of space at the bunk per animal). Steers had free access to
fresh, clean water. Feed was provided once daily (feed DM equaling
~2.5% body weight) and the amount adjusted so that 10–15% orts
were present after 18 h with all feed being consumed by 24 h. During
the study period one animal from the GH-FS treatment was withdrawn
due to lameness unrelated to dietary treatment.
2.2. Feed analysis
Feed samples were collected weekly and stored at −40 °C, then
pooled monthly before determination of DM, minerals, crude fat,
crude protein (AOAC, 2006), neutral detergent fiber and acid detergent
fiber (Van Soest, Robertson, & Lewis, 1991). Fatty acids from the
finishing total mixed ration were extracted and methylated as described
by Sukhija and Palmquist (1988) and analyzed according to Dugan et al.
(2007).
2.3. Growth measurements and slaughter procedure
Individual steer weights were measured monthly and average daily
gain (ADG) was calculated by dividing each animal's body weight by
days on-test. Animal growth and DM intake (DMI) were recorded
from the start of the experiment until the first group of animals were
slaughtered due to difficulties in measuring DMI when numbers of
animals per pen were reduced. Backfat thickness was measured monthly
by a certified ultrasound technician using an Aloka 500 V diagnostic
real-time ultrasound with a 17 cm 3.5 MHz linear array transducer
(Overseas Monitor Corporation Ltd., Richmond, B.C., Canada) following
procedures of Brethour (1992). Steers were slaughtered at the Lacombe
Research Centre abattoir over four slaughter dates in November 2011
(two steers/pen/diet/slaughter day) at an average of 205 d on feed corresponding to subcutaneous fat depths of 5–8 mm between the 12th and
13th rib over the right longissimus thoracis (LT) muscle of each animal.
On mornings of slaughter, animals were transported 2 km to the
Lacombe Research Centre abbatoir. At slaughter, final live weights were
recorded and steers were stunned, exsanguinated and dressed in a commercial manner. Following carcass splitting, trimmed side weights were
recorded and initial (45 min) pH and temperature were recorded caudal
to the grade site on the left LT using a Hanna HI99163 pH meter equipped
with a Hanna Smart electrode FC232 for meat (Hanna Instruments,
Laval QC, Canada). Upon entry into the cooler, stainless steel thermocouples (10 cm) were placed into the right LT ~2.5 cm anterior to the
100
C. Mapiye et al. / Meat Science 95 (2013) 98–109
12th vertebrae of all animals, and temperatures were recorded every
15 min for 24 h using data temperature loggers (Mark III, MC4000;
Sumaq Wholesalers, Toronto, ON, Canada).
2.4. Meat quality
Carcass sides were chilled overnight in a cooler set at 2 °C, with an
average wind speed of 1.4 m/s. At 24 h post-slaughter, the left and
right carcass sides were weighed to determine cooler shrinkage losses.
The left carcass sides were knife-ribbed at the Canadian grade site
(between the 12th and 13th ribs) and the muscle surface exposed to atmospheric oxygen for 20 min. Full Canadian grade data were collected
(grade fat thickness, estimated lean yield, ribeye area and marbling
score) along with objective color measurements from three surface locations (CIE L* (brightness), a* (red–green axis), b* (yellow–blue axis)
values; Commission Internationale de l'Eclairage, 1978) using the
Minolta CR-300 with Spectra QC-300 Software (Minolta Canada Inc.,
Mississauga, ON, Canada). Color measurements were converted to hue
angle [hab = arctan(b*/a*)] and chroma [C*ab = (a*2 + b*2) 0.5]. Grade
data, including yield estimation and subjective estimates of marbling
were assessed according to the Livestock and Poultry Carcass Grading
Regulations (Canadian Food Inspection Agency, 1992) by two certified
graders. Temperature and pH of the LT were again measured at 24 h
caudal to the grade site.
The left LT was dissected from the carcass at 24 h and a 5.0 cm
steak removed from the grade site (caudal end of the LT), trimmed of
epimysium, subcutaneous and intermuscular fat, comminuted using a
Robot Coupe Blixir BX3 (Robot Coupe USA Inc.; Ridgeland, MS, USA),
and subsamples were frozen at −80 °C for subsequent FA analyses.
The remainder of the muscle was trimmed of all extraneous fat to the
epimysium, weighed, vacuum packaged (Multivac AGW; Multivac Inc.,
Kansas City, MO, USA) and aged for 6 d at 2 °C.
After aging, four 2.5 cm thick steaks were removed from the caudal
end of the LT. The first steak was pre-weighed onto a polystyrene tray
with a dri-loc pad, over-wrapped with oxygen permeable film
(8000 cm3·m−2·24 h−1 vitafilm choice wrap; Goodyear Canada Inc.,
Toronto, ON, Canada) and placed in a fan assisted, horizontal (chest
type) retail display case (Hill Refrigeration of Canada Ltd., Barrie, ON,
Canada). Steaks were exposed to fluorescent room lighting (GE deluxe
cool white; General Electric Canada, Oakville, ON, Canada), supplemented
with incandescent lighting directly above the display case (GE clear cool
beam 150 W/120 V spaced 91.5 cm apart; General Electric Canada,
Oakville, ON, Canada) to provide an intensity of 1076 lx at the meat surface for 12 h·day−1 (Jeremiah & Gibson, 2001). The average temperature
in the retail display case was 3.5 °C. Following 0, 2 and 4 days of retail display, three objective color measurements (L*, a* and b*) were collected
across the steak and converted to hue angle and chroma as reported previously. Spectral reflectance readings were also collected concurrently
and the relative contents of metmyoglobin, myoglobin and oxymyoglobin
were calculated as described by Shibata (1966) and Krzywicki (1979).
Following the fourth day of objective color measurements, steaks were removed from retail display and final weights were recorded to determine
drip-loss.
Raw steak weights were recorded on the second steaks and a 10 cm
spear point Type T thermocouple probe (Wika Instruments, Edmonton,
AB, Canada) was inserted into the mid-point of each steak prior to
cooking. Steaks were then cooked, on a Garland grill (Model ED30B,
Condon Barr Food Equipment Ltd., Edmonton, AB, Canada) preheated
to 210 °C, to an internal temperature of 35.5 °C, turned and cooked to
a final temperature of 71 °C. Internal temperatures during cooking
were monitored with a Hewlett Packard HP34970A Data Logger (Hewlett
Packard Co., Boise ID, USA). Upon removal from the grill, steaks were
placed into polyethylene bags, sealed and immediately immersed in an
ice/water bath to prevent further cooking. Steaks were then transferred
to a 2 °C cooler for 24 h. Final steak weights were recorded and six
cores, 1.9 cm in diameter, were removed from each steak parallel to the
fiber grain. Peak shear force was determined on each core perpendicular
to the fiber grain (TA-XT Plus Texture Analyzer equipped with a WarnerBratzler shear head at a crosshead speed of 200 mm·min−1 and a 30 kg
load cell using Texture Exponent 32 Software; Texture Technologies Corp., Hamilton, MA, USA). Shear force was recorded as the average
of all six cores per steak. Raw and final steak weights were used to determine cooking losses, and cooking times were also recorded.
The third steaks were labeled, individually vacuum packaged, placed
into a 2 °C cooler, and aged for 16 d prior to shear force determination
as previously described. Fourth steaks were labeled, vacuum packaged,
placed into a 2 °C cooler and aged for 16 d. Following aging, steaks were
placed into a −35 °C freezer until used for sensory evaluation.
The remaining portion of the LT was trimmed of epymysium and
comminuted using Robot Coupe Blixir BX3 (Robot Coupe USA Inc.,
Ridgeland MS, USA) and analyzed for protein, moisture and fat using a
CEM rapid analyzer system (Sprint Protein Analyzer Model 558000,
Smart Turbo Moisture Analyzer Model 907990, and Smart Trac Fat
Analyzer Model 907955; CEM Corporation, Matthews, NC, USA).
2.5. Longissimus thoracis fatty acid analysis
Intramuscular lipids were extracted from LT samples using a mixture
of chloroform–methanol (2:1, v/v) according to Folch, Lees, and Sloane
Stanley (1957). Aliquots of muscle lipids (10 mg) were methylated
separately using acid (5% methanolic HCl) and base (0.5 N sodium
methoxide) reagents (Kramer, Hernandez, Cruz-Hernandez, Kraft, &
Dugan, 2008). Internal standard, 1 ml of 1 mg c10-17:1 methyl ester/ml
toluene (standard no. U-42M form Nu-Check Prep Inc., Elysian, MN,
USA), was added prior to addition of methylating reagents. Fatty acid
methyl esters (FAME) were analyzed using the gas chromatography
(GC) and silver-ion high-performance liquid chromatography methods
outlined by Cruz-Hernandez et al. (2004), except t-18:1 isomers were
analyzed using two complementary GC temperature programs as described by Kramer et al. (2008).
For the identification of FAME by GC, the reference standard no. 601
from Nu-Check Prep Inc, Elysian, MN, USA was used. Branched-chain
FAME were identified using a GC reference standard BC-Mix1 purchased previously from Applied Science (State College, PA, USA). For
CLA isomers, the UC-59M standard from Nu-Chek Prep Inc. was used
which contains all four positional CLA isomers. Trans-18:1 CLA isomers
and other BH intermediates not included in the standard mixtures were
identified by their retention times and elution orders as reported in
literature (Cruz-Hernandez et al., 2004; Gómez-Cortés, Bach, Luna,
Juárez, & de la Fuente, 2009; Kramer et al., 2008). The FAME were quantified using chromatographic peak area and internal standard based
calculations. Only FAME representing more than 0.01% of total FAME
were included in tables and figures, except for BH intermediates where
all the quantified isomers were reported.
2.6. Sensory analysis
Sensory analysis of steaks was conducted using previously described
procedures (Aldai et al., 2010; Basarab, Aalhus, et al., 2007). Prior to
taste panel assessments, steaks were removed from the freezer and
placed in a refrigerator to thaw for 24 h. Fifteen minutes prior to
cooking, steaks were removed from the refrigerator and were cooked
to a final temperature of 71 °C as described previously for shear force
determinations. Each steak was cut into 1.3 cm cubes, avoiding connective tissue and large areas of fat. Eight cubes from each sample were
randomly assigned to an eight-member trained sensory panel. Samples
were placed in lightly covered glass jars in a circulating water bath
(Lindberg/Blue Model WB1120A-1; Kendro Laboratory Products,
Asheville, NC, USA) and allowed to equilibrate to 68 °C prior to evaluation. Attribute ratings were electronically collected using Compusense
5, Release 4.6 software (Compusense Inc., Guelph, ON, Canada ) using
8-point descriptive scales for initial and overall tenderness (1 =
101
C. Mapiye et al. / Meat Science 95 (2013) 98–109
extremely tough and 8 = extremely tender), initial and sustainable
juiciness (1 = extremely dry and 8 = extremely juicy), beef flavor
intensity (1 = extremely bland and 8 = extremely intense), off-flavor
intensity (1 = extremely intense off-flavor and 8 = no off-flavor) and
amount of connective tissue (1 = abundant and 8 = none detected).
Initial tenderness was rated on the first bite through the cut center surface with the incisors; initial juiciness was rated after 3–5 chews with
the molars; beef flavor intensity, off-flavor intensity and amount of
connective tissue were rated between 10 and 20 chews, and overall tenderness and sustainable juiciness were rated prior to expelling. All panel
evaluations were conducted in well-ventilated partitioned booths, under
red lighting (124 lx). Distilled water and unsalted soda crackers were
provided to purge the palate of residual flavor notes between samples
(Larmond, 1977).
to SS and final live weights were also lower (P b 0.05) in steers fed
RC compared to those fed GH (Table 2). The lower DMI could be partly
related to the slightly higher digestible energy of FS diets, but likely
relates more to reduced palatability, as FS has been shown to reduce intake when fed at levels above 10% of DM (Kim et al., 2009). Addition
of straw to the FS diets to balance digestible energy across diets may
have also reduced palatability and DMI due to its lower digestibility
(Sarnklong, Coneja, Pellikaan, & Hendriks, 2010). The reasons for the
lower final live weight when feeding RC as opposed to GH are less
clear, but the higher crude fat content of RC diets, or the quality of silage
fed may have had some influence. Levels of fat above 5% have been
shown to inhibit ruminal fiber digestion, which can result in increased
rumen fill and reduced DMI (Jenkins, 1993). The quality of the silage
fed in the current study was, however, not evaluated.
2.7. Statistical analysis
3.3. Carcass traits and longissimus thoracis quality
Data were analyzed using the PROC MIXED procedure of SAS
(2009). The statistical model used for animal weights and feed intake
included oilseed, forage and oilseed × forage interaction as fixed effects,
and pen nested within the oilseed × forage interaction as the random
effect. Data analysis for carcass traits, meat quality, sensory attributes
and muscle FA profiles included the fixed effects of oilseed, forage and
oilseed × forage interaction and random effects of slaughter date and
pen nested within the oilseed × forage interaction. Meat shear force
and retail display data were analyzed with a repeated measures design,
with oilseed, forage, day and their interactions as main effects, slaughter
date and pen nested within the oilseed × forage interaction as random
effects, and day as the repeated factor. Since the random effect of pen
nested within the oilseed × forage interaction was not significant, it
was removed from carcass traits, meat quality and FA models and individual animal was used as the experimental unit. Treatment means
were generated and separated using the LSMEANS and PDIFF options
respectively (SAS, 2009). Frequency tables were generated along with
Chi-Square tests for yield and quality grade data. The significance threshold for all statistical analyses was set at P b 0.05.
At 24 h post-slaughter, feeding diets containing FS reduced (P b 0.05)
cold carcass weight, hot dressing percentage and grade fat thickness as
compared to feeding SS (Table 3). Feeding diets containing RC vs. GH
also reduced cold carcass weight (P b 0.05), but only led to trends for reduced hot dressing percentage (P b 0.07). These findings may be associated with the lower DMI, ADG and final live weights reported for the FS
and RC containing diets. Compared to steers fed diets containing SS, steers
fed FS had greater (P b 0.05) carcass shrink loss, and steers fed diets
containing RC tended (P b 0.07) to have greater carcass shrink loss than
steers fed GH. These findings could be related to differences in grade fat
thickness. Subcutaneous fat can act as a thermal insulator and reduce
water losses during carcass cooling (Bezerra et al., 2012). Type of forage
had an effect on ribeye area, with steers fed diets containing GH having
larger (P b 0.05) ribeye areas than those fed RC. These results could be
explained by differences in DMI, carcass weights and nitrogen utilization
efficiency when consuming these two forages (Fraser, Fychan, & Jones,
2000). Diet had no effect on estimated lean yield or marbling score
(Table 3). There were no differences in the distribution of yield and quality grades among the dietary treatments (Table 3). Overall, the distribution of yield and quality grades indicates that about 82% and 65% of the
carcasses graded Canada 1 and Canada AA, respectively (Table 3).
Loin temperature decline by diet data are presented in Fig. 1.
Steers fed diets containing SS had higher (P = 0.05) 45 min postslaughter LT temperatures than those fed FS (Table 3), but forage
type had no effect on 45 min LT temperature. Types of forage and oilseed had no effect on 24 h muscle temperature (Table 3). Steers fed
diets containing RC as opposed GH had higher (P = 0.05) 45 min LT
pH. At 24 h, however, an oilseed type × forage type interaction was
detected for LT pH, and steers fed the RC-SS diet had the highest
pH, the GH-SS the lowest and steers fed the RC-FS and GH-FS diets
had intermediate values (P b 0.05; Table 3). Oilseed and forage type
affected muscle L* and interacted to influence hue angle (P b 0.05). Feeding diets containing RC or FS resulted in darker (lower L*; P b 0.05) and
redder (lower hue angle; P b 0.05) meat compared to feeding GH and SS
(Table 3). Slower rates of live weight gain and lighter carcass weights
observed for steers fed diets containing RC or FS likely resulted in faster
loin cooling rates (Fig. 1) to produce meat with a higher pH and a less
3. Results and discussion
3.1. Nutrient and fatty acid composition of the experimental diets
The DM content of GH was double that of RC diets (Table 1). The
DM nutrient composition of the experimental diets was similar
(Table 1) with RC diets having slightly more crude protein, crude fat
and digestible energy than GH diets. Linoleic acid and ALA were the
dominant FA in the SS and FS diets, respectively (Table 1).
3.2. Animal performance
Over the course of the experiment, steers fed diets containing FS had
significantly lower (P b 0.05) DMI than those fed SS, and steers fed
diets containing RC consumed less (P b 0.05) feed than those fed GH
(P b 0.05; Table 2). As a reflection of these findings, ADG and final live
weights were lower (P b 0.05) in steers fed FS containing diets compared
Table 2
Effect of forage type and oilseed supplementation on feed intake and growth performance of feedlot steers.
Grass hay
Variable
Dry matter intake, kg DM·d
Initial live weight, kg
Final live weight, kg
Average daily gain, kg·d−1
−1
Red clover
s.e.m
Flax
Sunflower
Flax
Sunflower
13.0
425
539
0.56
13.6
431
563
0.69
11.2
419
497
0.45
12.9
418
536
0.71
0.37
8.24
9.55
0.08
P-value
Oilseed
Forage
O ∗ F1
0.03
0.77
0.001
0.001
0.03
0.25
0.001
0.22
0.21
0.68
0.44
0.09
Means with different superscripts for a particular animal performance trait are significantly different (P b 0.05); s.e.m, standard error of mean.
1
Oilseed type × forage type interaction.
102
C. Mapiye et al. / Meat Science 95 (2013) 98–109
Table 3
Effect of forage type and oilseed supplementation on carcass and meat quality of feedlot steers.
Grass hay
Red clover
s.e.m
P-value
Oilseed
Forage
O ∗ F1
0.05
5.79
0.37
0.01
0.001
0.04
0.07
0.01
0.07
0.62
0.30
0.26
0.67
1.98
1.77
22.0
0.04
0.28
0.43
0.59
0.28
0.04
0.31
0.25
0.87
0.49
0.27
0.31
21.0
4.84
0.89
0.30
0.55
4.76
17.5
1.59
6.35
14.3
4.76
0.87
0.58
0.44
6.73
36.3
5.66ab
1.54
33.3
21.0
21.5b
38.6
6.70
19.9
4.21
73.8
6.71
36.5
5.68a
1.48
33.7
21.1
21.6b
40.1
5.84
20.0
4.26
73.4
0.93
0.05
0.37
0.31
0.04
0.13
0.03
0.66
0.08
0.21
0.88
0.29
0.05
0.70
0.001
0.15
0.01
0.07
0.001
0.53
0.12
0.01
0.86
0.01
0.56
0.34
0.02
0.97
0.20
0.21
0.04
0.77
0.30
0.45
0.97
0.77
Variable
Flax
Sunflower
Flax
Sunflower
Carcass traits
Shrink loss, %
Cold carcass weight, kg
Hot dressing, %
1.71
304
56.5
1.59
320
56.9
1.76
283
56.8
1.68
310
58.0
Canadian grade data
Grade fat, mm
Ribeye area, cm2
Estimated lean yield, %
Marbling score2
6.35
73.5
56.5
442
7.25
74.3
59.8
456
5.75
68.0
60.3
441
6.81
71.5
59.7
437
Yield grade3, %
Canada 1
Canada 2
19.4
4.84
21.0
4.84
21.0
3.23
Quality grade, %
Canada A
Canada AA
Canada AAA
4.76
14.3
4.76
1.59
19.1
4.76
Longissimus thoracis quality measures
pH, 45 min
Temperature °C, 45 min
pH, 24 h
Temperature °C, 24 h
L*, 24 h
Chroma, 24 h
Hue angle, 24 h
Drip loss, mg·g−1 (average of 6 and 16 d)
Shear force, kg (average of 6 and 16 d)
Protein, %
Fat, %
Moisture, %
6.65
36.1
5.64b
1.46
34.0
21.3
21.9b
38.1
5.90
20.4
4.27
72.9
6.67
36.6
5.58c
1.41
35.8
22.7
23.0a
38.4
5.69
20.8
4.36
72.7
0.03
1.17
0.04
0.42
0.52
0.61
0.45
1.86
0.44
0.29
0.86
0.38
a,b
Means with different superscripts for a particular carcass or longissimus thoracis quality trait are significantly different (P b 0.05); s.e.m, standard error of mean.
Oilseed type × forage type interaction.
2
Marbling score terminology: 100, devoid; 200, practically devoid; 300, trace; 400, slight; 500, small; 600, modest; 700, moderate; 800, slightly abundant; 900, moderately abundant;
1000, abundant; 1100, very abundant.
3
No yield grade done on B4 carcasses.
1
desirable appearance. Młynek and Guliński (2007) obtained similar
results and attributed them to variation in muscle fiber type composition
with growth rate. Overall, slower growth rates result in higher contents
of type I muscle fibers and lower contents of type II muscle fibers
(Młynek & Guliński, 2007). Type I muscle fibers are red in color, have
high oxidative capacity, and are lower in glycogen content and glycolytic
enzyme activity (Klont, Brocks, & Eikelenboom, 1998). Consequently,
lactic acid production is reduced, muscle acidification slows down and
meat with redder and darker color is produced (Młynek & Guliński,
2007).
Diet had no effect on LT drip loss, shear force at 6 or 16 d post-mortem
or fat content (Table 3). Longissimus thoracis shear force, however, declined (P b 0.05) from 6.90 kg on day 6 to 5.16 kg on day 16. Slightly
higher (P b 0.05) protein content was found when feeding GH vs. RC
containing diets (Table 3), and may again be related to differences in
DMI and nitrogen utilization efficiency between these two forages
(Fraser et al., 2000). The slightly higher (P b 0.05) LT moisture reported
for steers fed RC compared to GH containing diets (Table 3) may be partly
related to the higher 24 h LT pH. High muscle pH has been reported to
elevate moisture content through an increase in water holding capacity
(Byrne et al., 2001).
3.4. Steak retail display
As expected, all retail steak measurements were affected by time
in display except for myoglobin (Table 4). Overall, L* values increased
up to day 2 and then decreased to day 4 (P b 0.05), chroma and
oxymyoglobin values declined (P b 0.05) whereas hue angle and
metmyoglobin values rose (P b 0.05) with increasing time in display.
No interactions were found between time in display with either forage
type or oilseed type for any retail measurements (P b 0.05).
The LT content of oxymyoglobin was influenced by an oilseed ×
forage type interaction with steaks from steers fed the GH-SS diet
having the highest (P b 0.05) values compared to steaks from steers
fed other diets (Table 5). Forage type had an effect on L*, chroma,
hue angle and the metmyoglobin content of steaks (Table 5). Steaks
from steers fed diets containing RC had slightly lower (P b 0.05) L*
and chroma values, and higher (P b 0.05) hue angle and metmyoglobin
values compared to steaks from steers fed GH. These findings agree
with earlier reports by Lee et al. (2009) and Scollan et al. (2006) who
attributed the differences to increased PUFA and reduced vitamin E
levels in the muscle of steers fed RC. In the current study, vitamin E
was fed (135 IU/kg of dietary DM) in excess of the amount known to
improve meat shelf-life (Liu, Lanari, & Schaefer, 1995), but muscle levels
of vitamin E were not assessed. However, as noted below, the levels of
PUFA in the muscle tended (P = 0.10) to be higher in steers fed RC
diets than in steers fed GH. Variation in color during retail display
observed when feeding these forages may also be partly attributed to
the small differences in LT moisture observed in the current experiment. Overall, high moisture content has been reported to reduce the
stability of vitamin E in foods (Miquel, Alegrı́a, Barberá, Farré, &
Clemente, 2004).
3.5. Longissimus thoracis fatty acid profiles
3.5.1. n − 3 and n − 6 polyunsaturated fatty acids
Total LT FA were similar across diets (Table 6), but total PUFA
were influenced by oilseed type. Steers fed diets containing SS had
103
C. Mapiye et al. / Meat Science 95 (2013) 98–109
36
34
32
30
28
26
Temperature, °C
24
22
20
18
16
14
12
10
8
6
4
2
0
0
2
4
6
8
10
12
14
16
18
Time, h
Red clover silage-Sunflower seed
Red clover silage-Flaxseed
Grass hay-Sunflower seed
Grass hay-Flaxseed
Fig. 1. Loin temperature of feedlot steers fed red clover silage or grass hay supplemented with sunflower-seed or flaxseed.
higher (P b 0.05) proportions of total PUFA than steers fed diets
containing FS. Proportions of total n−6 PUFA and the majority of individual n−6 PUFA were also influenced by oilseed type, with steers fed
diets containing SS having greater (P b 0.05) proportions than those
fed diets containing FS (Table 6). For all diets, over 75% of n−6 PUFA
in the muscle was linoleic acid (LA). The present results show that
increasing the supply of LA through feeding SS was more effective in
raising the total PUFA in the muscle through an increase in n−6 PUFA
than increasing the supply of ALA and n−3 PUFA through feeding FS.
These findings could be related to LA's higher proportions in SS
containing diets. For most diets, LA also has lower rates of BH as compared to ALA (Shingfield, Bonnet, & Scollan, 2013). Given that SS were
fed whole, while FS was triple rolled, rolling may have increased the
availability of ALA in the rumen compared to LA provided in whole
SS (Doreau, Aurousseau, & Martin, 2009). Feeding RC vs. GH based
diets tended (P b 0.10) to increase total PUFA, increased 20:4n−6
(P b 0.05) and may relate to the either greater supply of PUFA in these
diets and/or elevated PPO activity in RC (Lee et al., 2009; Van Ranst et
al., 2011).
Oilseed type × forage type interactions were significant for total
n − 3 PUFA and ALA, with steers fed the RC-FS diet having the greatest
proportions followed by those fed the GH-FS diet, while steers fed the
Table 4
Effect of day on retail measurements of beef from feedlot steers.
Variable
L*
Chroma, %
Hue angle, °
Metmyoglobin
Myoglobin
Oxymyoglobin
Day
s.e.m
0
2
4
49.2c
10.3a
35.8c
0.23c
0.04
0.73a
50.4a
10.1a
37.4b
0.27b
0.04
0.68b
49.7b
9.73b
38.9a
0.30a
0.04
0.67c
P-value
0.22
0.23
0.30
0.01
0.01
0.01
b0.001
0.02
b0.001
b0.001
0.26
b0.001
a,b,c
Means with different superscripts for a particular beef retail measurement are
significantly different (P b 0.05); s.e.m, standard error of mean.
GH-SS and RC-SS diets had the lowest proportions with no difference
found between them (P b 0.05; Table 6). Proportions of ALA accounted
for about 50% to 70% of the total n−3 PUFA in LT of steers fed diets
containing SS and FS, respectively. The observation that steers fed the
RC-FS diet had the greatest proportions of total n−3 PUFA and ALA
could be associated with their greater dietary supply, a reduction in
ruminal lipolysis and BH of ALA from FS through a shift in ruminal
microbial population (Huws et al., 2010), or through products of PPO
activity, which inhibit lipase or form lipid–phenol matrices (Van Ranst
et al., 2011). The effects of RC on n−3 PUFA might also be explained
by its increased rumen passage rates (Vanhatalo, Kuoppala, Toivonen,
& Shingfield, 2007). The proportion of ALA in LT FA of steers fed the
RC-FS diet (1.38%) was slightly lower than that reported by Mapiye et
al. (2013, 1.59%) when a similar diet was fed, but is higher than those
reported when feeding FS with grain- (0.25%, Kim et al., 2009; 1.35%,
Juárez et al., 2011) or forage-based (0.93%, Aharoni et al., 2004; 1.06–
1.22%, Nassu et al., 2011; 1.35%, Noci et al., 2007) diets. The inconsistencies across studies could be a result of differences in the type, physical form and quantity of PUFA and forages fed, levels of plant secondary
compounds consumed, time on feed, age at slaughter, breed and gender
of the animals assayed.
The proportions of long chain n − 3 PUFA were only influenced
(P b 0.05) by oilseed type. Steers fed diets containing FS had higher
(P b 0.05) proportions of 20:5n−3 (eicosapentaenoic acid, EPA),
22:5n−3 (docosapentaenoic acid, DPA) and 22:6n−3 (docosahexaenoic
acid, DHA) compared to steers fed SS (Table 6). Several studies have
shown that diets rich in ALA result in increased levels of EPA and DPA
in beef with DPA being the most abundant long chain n−3 PUFA while
in most cases no effect on DHA level was observed (Mapiye et al., 2013;
Nassu et al., 2011; Noci et al., 2007; Raes et al., 2004). Overall, the proportions of long chain n−3 PUFA in the current study are comparable to
those reported by Noci et al. (2007) and Nassu et al. (2011), but higher
than those reported by Mapiye et al. (2013). Variation in long chain
n−3 PUFA across studies could be due to diet-linked differences in
rumen metabolism or desaturase and/or elongase activity. Increasing
ALA and its long-chain derivatives, especially DHA and EPA in beef
104
C. Mapiye et al. / Meat Science 95 (2013) 98–109
Table 5
Effect of forage type and oilseed type on retail measurements of beef from feedlot steers.
Variable
L*
Chroma, %
Hue angle, °
Metmyoglobin
Myoglobin
Oxymyoglobin
a,b
Grass hay
Red clover silage
s.e.m
Flax
Sunflower
Flax
Sunflower
50.0
10.1
37.1
0.27
0.04
0.69b
49.9
10.3
37.1
0.26
0.04
0.71a
49.6
9.91
38.0
0.28
0.04
0.68b
49.5
9.82
37.4
0.28
0.04
0.68b
0.23
0.24
0.33
0.01
0.01
0.01
P-value
O
F
O ∗ F1
0.59
0.65
0.32
0.13
0.18
0.03
0.01
0.03
0.04
b0.001
0.11
b0.001
0.77
0.29
0.25
0.15
0.17
0.04
Means with different superscripts for a particular beef retail measurement are significantly different (P b 0.05); s.e.m, standard error of mean.
Oilseed type × forage type interaction.
1
Table 6
Effect of forage type and oilseed supplementation on intramuscular fatty acid profiles of feedlot steers.
Variable
∑ FA (mg/g muscle)
∑ PUFA
∑ n−6
18:2n−6
20:3n−6
20:4n−6
∑ n−3
18:3n−3
20:5n−3
22:5n−3
22:6n−3
∑ CLNA
∑ CLNA
c9,t11,t15-18:3
c9,t11,c15-18:3
∑ AD
∑ CLA
∑ c,t-CLA
∑ t,t-CLA
∑ t-18:1
∑ c-MUFA
c9-14:1
c7-16:1
c9-16:1
c11-16:1
c9-17:1
c9-18:1
c11-18:1
c12-18:1
c13-18:1
c14-18:1
c15-18:1
c9-20:1
c11-20:1
∑ BCFA
iso-15:0
anteiso-15:0
iso-16:0
iso-17:0
anteiso-17:0
iso-18:0
∑ SFA
14:0
15:0
16:0
17:0
18:0
19:0
20:0
Grass hay
Red clover silage
s.e.m
Flax
Sunflower
Flax
Sunflower
30.6
6.59
4.94
3.72
0.24
0.87
1.66b
1.09b
0.21
0.34
0.02
0.22b
0.22b
0.04
0.17b
2.40
0.76
0.64
0.12
5.85
37.9
0.47
0.16
2.57
0.12
0.52
30.7
1.02
0.83c
0.29
0.08
0.41
0.09
0.10
1.71
0.18
0.20
0.35
0.34
0.51
0.14
45.8
2.32
0.46
24.4
0.85
15.9
0.06
0.06
31.8
6.70
5.85
4.47
0.32
0.92
0.85c
0.49c
0.10
0.24
0.02
0.10c
0.10c
0.02
0.08c
1.52
0.85
0.76
0.08
7.71
36.9
0.49
0.15
2.47
0.12
0.45
29.6
0.91
1.54a
0.27
0.08
0.19
0.06
0.09
1.55
0.17
0.18
0.34
0.31
0.45
0.11
45.6
2.30
0.44
24.1
0.76
16.3
0.05
0.06
28.6
6.99
4.96
3.73
0.24
0.89
2.03a
1.38a
0.26
0.36
0.03
0.27a
0.27a
0.05
0.22a
2.29
0.79
0.67
0.12
5.64
37.9
0.51
0.17
2.80
0.13
0.53
30.6
1.07
0.61d
0.29
0.07
0.38
0.08
0.11
1.65
0.17
0.20
0.35
0.31
0.48
0.14
45.6
2.34
0.48
24.4
0.81
15.8
0.05
0.06
30.5
7.63
6.89
5.17
0.38
1.17
0.74c
0.39c
0.10
0.23
0.02
0.09c
0.09c
0.02
0.08c
1.07
0.86
0.79
0.06
7.53
35.9
0.41
0.16
2.38
0.11
0.47
29.4
0.96
1.07b
0.23
0.07
0.16
0.06
0.10
1.58
0.16
0.19
0.38
0.30
0.45
0.11
46.2
2.22
0.47
23.85
0.78
17.1
0.05
0.07
3.71
0.07
0.59
0.40
0.04
0.15
0.15
0.08
0.03
0.04
0.00
0.02
0.02
0.00
0.01
0.09
0.05
0.05
0.01
0.28
0.63
0.04
0.01
0.12
0.01
0.01
0.62
0.03
0.06
0.01
0.00
0.02
0.00
0.01
0.04
0.00
0.01
0.02
0.01
0.01
0.01
0.70
0.09
0.01
0.42
0.03
0.42
0.00
0.00
P-value
Oilseed
Forage
O ∗ F1
0.48
0.03
b0.001
b0.001
b0.001
0.01
b0.001
b0.001
b0.001
b0.001
0.05
b0.001
b0.001
b0.001
b0.001
b0.001
0.03
0.01
b0.001
b0.001
0.02
0.23
0.33
0.03
0.10
b0.001
0.03
0.001
b0.001
0.001
0.14
b0.001
b0.001
0.18
0.001
0.02
0.10
0.69
0.03
b0.001
b0.001
0.70
0.47
0.19
0.31
0.01
0.04
0.01
0.16
0.43
0.10
0.11
0.15
0.19
0.04
0.21
0.19
0.11
0.73
0.16
0.08
0.08
0.76
0.05
0.001
0.52
0.37
0.21
0.50
0.48
0.66
0.01
0.56
0.54
0.21
0.79
0.13
b0.001
0.09
0.001
0.08
0.83
0.09
0.73
0.02
0.44
0.14
0.04
0.19
0.23
0.79
0.72
0.08
0.66
0.67
0.46
0.01
0.79
0.87
0.50
0.12
0.16
0.08
0.10
0.02
0.01
0.07
0.41
0.52
0.03
0.03
0.41
0.02
0.06
0.76
0.96
0.10
0.96
0.43
0.09
0.65
0.20
0.18
0.69
0.89
0.98
0.01
0.10
0.20
0.97
0.32
0.76
0.20
0.74
0.81
0.23
0.23
0.14
0.93
0.50
0.58
0.99
0.74
0.19
0.27
0.39
0.09
a,b,c
Means with different superscripts for a particular fatty acid profile are significantly different (P b 0.05); s.e.m, standard error of mean.
∑ FA, total fatty acids in mg per g of meat; ∑ PUFA, sum of polyunsaturated fatty acids = ∑ n−6 + ∑ n−3; ∑ n−6 = sum of 18:2n−6, 20:3n−6, 20:4n−6; ∑ n−3 sum of
18:3n−3, 20:5n−3, 22:5n−3, 22:6n−3; ∑CLNA, sum of conjugated linolenic acid = c9,t11,t15-, c9,t11,c15-; ∑ AD, atypical dienes = sum of t11,t15-, c9,t13-/t8,c12-, t8,c13-,
c9,t12-/c16-18:1, t9,c12-, t11,c15-, c9,c15-, c12,c15-; ∑ CLA, conjugated linoleic acid = sum of t,t-CLA + sum of c,t-CLA; ∑ trans-trans-CLA = sum of t12,t14-, t11,t13-, t10,t12-,
t9,t11-, t8,t10-, t7,t9-t6,t8-; ∑ cis-/trans-CLA = sum of c9,t11-, t7,c9-, t11,c13-, t12,c14-, c11,t13-, t10,c12-, t8,c10-, t9,c11-; ∑ t-18:1, sum of trans-18:1 isomers = t6,t7,t8-, t9-,
t10-, t11-, t12-, t13,t14-, t15-, t16-; ∑ c-MUFA = sum of c9-14:1, c7-16:1, c9-16:1, c11-16:1, c9-17:1, c9-18:1, c11-18:1, c12-18:1, c13-18:1, c14-18:1, c15-18:1, c9-20:1,
c11-20:1; ∑ BCFA, branched chain fatty acids = sum of iso-15:0, anteiso15:0, iso16, iso17:0, anteiso17:0, iso18:0; ∑ SFA = sum of 14:0, 15:0, 16:0, 17:0, 18:0, 19:0, 20:0.
1
Oilseed type × forage type interaction; c, cis; t, trans.
C. Mapiye et al. / Meat Science 95 (2013) 98–109
remains a priority as they have been reported to have cardiovascular,
immune and mental health benefits in humans (Molendi-Coste et al.,
2011). In the current study, estimated levels of n−3 PUFA in LT from
steers fed SS and FS containing diets would be 0.03 and 0.06 g per
100 g LT, respectively, which would account for 10% and 20% of the
levels required to make an n−3 PUFA enrichment claim in Canada
(≥0.3 g of n−3 PUFA per serving; CFIA, 2003). However, at retail
most lean steak is sold with subcutaneous fat contributing 5 to 15% of
the whole steak, and in other species, this fat depot is included as part
of the serving and can contribute significantly to the overall n−3
PUFA enrichment level.
3.5.2. Triene and diene biohydrogenation intermediates
The proportions of total conjugated linolenic acid (CLNA) and c9,
t11,c15-18:3 were affected by oilseed × forage type interactions
(P b 0.05; Table 6). Steers fed the RC-FS diet had the highest proportions of total CLNA (Table 6) and c9,t11,c15-18:3 (Fig. 2A) followed by
steers fed GH-FS, while RC-SS and GH-SS resulted in the lowest proportions with no difference between them (P b 0.05). These findings are
consistent with our previous findings when feeding diets containing FS
(Nassu et al., 2011) or its combination with RC (Mapiye et al., 2013).
The result that steers fed the RC-FS diet had the highest proportions of
LT CLNA would be expected as a similar interaction was found for ALA,
and since ALA is first isomerized to CLNA during BH in the rumen
(Jenkins, Wallace, Moate, & Mosley, 2008). Red clover silage might have
further increased the proportions of CLNA by increasing passage rates
(Vanhatalo et al., 2007) or by reducing BH of CLNA (Huws et al., 2010;
Van Ranst et al., 2011) or a combination of these mechanisms. The proportions of CLNA in the current study are similar to those reported by
Mapiye et al. (2013) but higher than those reported by Nassu et al.
(2011). In a large number of cell culture and animal model studies,
CLNA isomers have displayed potent anti-inflammatory, immunemodulatory, anti-obesity and anti-carcinogenic activity, along with the
ability to improve biomarkers of cardiovascular health (Hennessy, Ross,
Devery, & Stanton, 2011). Consequently, their accumulation in beef may
be perceived as a positive development from a human health perspective.
For AD, there were two clear isomer patterns found related to oilseeds fed and their dominant FA (Fig. 2a). For AD derived from ALA
(t8,c13; c9,c15; t11,c15; c12,c15; t11,t15), proportions were mainly
increased by feeding FS (P b 0.05). Minor forage effects were, however,
noted for c12,c15 (P b 0.05) and t11,t15 (P b 0.05). These results are
consistent with earlier reports (Bessa et al., 2007; Mapiye et al., 2013;
Nassu et al., 2011) when feeding FS to ruminants. For AD derived
from LA (t8,c12; c9,t12; t9,c12), a fairly consistent forage × oilseed
type interaction was found (P b 0.05) with the greatest amounts
found when feeding the GH-SS diet. This is somewhat inconsistent
with CLNA results where feeding RC was found to increase BH intermediates, but Shingfield et al. (2005) has reported higher PUFA transfer
efficiency from diet to tissues when hay as compared to silage was provided as a forage source, probably due to alterations in ruminal lipid
metabolism and/or forage lipids during preservation. Overall, accumulations of ALA derived AD when feeding FS were greater than when
feeding diets containing SS, and this is consistent with previously
reported pathways where ALA BH leads mostly through AD vs. CLA,
while LA BH leads mostly through CLA (Jenkins et al., 2008; Nassu et
al., 2011). The type of forage fed, however, only led to marginal differences in levels of AD.
The most concentrated AD isomer found when feeding any diet
was t11,c15-18:2, and reached a high of 0.85% when feeding FS
containing diets. This is comparable to the ~ 0.9% found when Nassu
et al. (2011) fed 15% FS to cull cows in a 50:50 forage-concentrate
diet, but lower than 1.65% found by Mapiye et al. (2013) when feeding
diets containing 15% FS to steers in a 70% forage diet. A number of AD
isomers (t8,c12; t8,c13; t9t12/c9,t13) were clearly enriched by Nassu
et al. (2011) and Mapiye et al. (2013) when feeding FS containing
diets, but were not preferentially enriched in the present experiment
105
when feeding FS compared to SS containing diets. These isomers may,
therefore, be found in common BH pathways for LA (i.e., from SS) and
ALA (i.e., from FS). The human health implications of consuming increased amounts of AD in beef fed GH and FS merits investigation as
suggested earlier by Nassu et al. (2011). Of particular interest will be
if t11,c15-18:2 can be desaturated to c9,t11,c15-18:3 which may have
beneficial health properties similar to RA (Hennessy et al., 2011).
For CLA, there were again two clear isomer patterns found related
to the types of oilseed fed and their dominant FA (Fig. 2b). For CLA
isomers with the first double bond at carbon 10 or closer to the carboxyl end, proportions of most isomers (t7,c9; c9,t11 (RA); t10,c12;
t10,t12) were elevated (P b 0.05) when feeding diets containing SS
as opposed to FS. This likely stems from LA being their common precursor, as demonstrated previously in a number of studies (Bessa et
al., 2007; Noci et al., 2007). Of the isomers in this group, a small but
significant forage effect was also found for t7,c9-CLA with feeding
GH containing diets resulting in slightly higher (P b 0.05) proportions
than RC. In addition, small but significant forage × oilseed type interactions (P b 0.05) were found for t8,c10-CLA and t9,c11-CLA. Specifically feeding the RC-SS diet resulted in the greatest proportion of t8,
c10-CLA, while feeding GH-SS or RC-SS resulted in the greatest proportions of t9,c11-CLA. For CLA isomers where the first double bond
was from carbon 11 or further from the carboxyl end, proportions
of most isomers (t11,t13; t12,t14; t12,c14; c12,t14) were elevated
(P b 0.05) when feeding FS. This likely resulted from their common
precursor being ALA, which was the predominant FA in the diets
containing FS, and is consistent with previously outlined pathways
(Mapiye et al., 2013; Nassu et al., 2011). Within this group of isomers, a
main effect of oilseed type was also found for t11,c13-CLA, with feeding
flaxseed increasing its proportions (P b 0.05), but a forage × oilseed
type interaction (P b 0.05) indicated its preferential accumulation when
feeding the RC-FS diet.
Across all diets, RA was the predominant CLA isomer contributing
over 60% and 75% of total CLA in LT lipids of steers fed diets containing
FS and SS, respectively. This is consistent with other studies feeding
diets containing FS and SS to ruminants (Bessa et al., 2007; Noci et
al., 2007), and is likely the result from most CLA being further hydrogenated in the rumen, and tissue CLA being synthesized through
Δ9-desaturation of VA (Griinari & Bauman, 1999; Jenkins et al., 2008).
In the present study, the proportions of RA in the muscle of steers fed
SS (0.65–0.69%) are comparable to previous findings when feeding
high-forage diets with sunflower oil (0.63%, Basarab, Mir, et al., 2007)
or FS (0.7%, Aharoni et al., 2004), but lower than those reported when
feeding RC plus FS (Mapiye et al., 2013, 1.41%) or when supplementing
grass pastures with FS oil (1.26%) or sunflower oil (1.78%; Noci et al.,
2007). Direct comparisons among studies are, however, difficult as for
the most part when RA is reported, it is combined with t7,c9-CLA. In
the present study, there was no clear advantage in terms of RA accumulation when feeding either GH or RC.
3.5.3. Monounsaturated fatty acids
For t-18:1, patterns of isomers found were clearly influenced by
both types of oilseed and forage fed (Fig. 2C). For t-18:1 isomers
with double bonds from carbon 6 to 12, these were primarily increased
(P b 0.05) when feeding diets containing SS compared to FS. Feeding
diets containing GH vs. RC also increased these isomers, except for VA,
but overall responses to oilseed were greater than forage type. Current
findings contradict previous reports by Nassu et al. (2011) and Mapiye
et al. (2013) where all t-18:1 isomers were clearly enriched by feeding
FS. The relative amounts of t10- and t15-18:1 in particular are lower
than those reported in our previous studies (Juárez et al., 2011; Mapiye
et al., 2013; Nassu et al., 2011) when feeding diets containing FS. The proportion of t-18:1 isomers with double bonds from carbon 13 to 16 were
elevated (P b 0.05) when feeding diets containing GH as opposed RC but
these differences were relatively small. Reasons for differences are
unclear, but could be partially ascribed to differences in forage-borne
106
C. Mapiye et al. / Meat Science 95 (2013) 98–109
% of total fatty acids
A
1
0.9
0.8
0.7
0.6
0.5
0.4
0.3
0.2
0.1
0
ß
a
b
b b
b
a
c
d b
ß
a
b
b a b b
c
c
t8,c12
B
α,ß
a a α
ß
t8,c13
c9,t12
t9,c12
t9,t12/c9,t13
c9,c15
t11,c15
t11,t15
c12,c15
ß
0.8
% of total fatty acids
0.7
0.6
0.5
0.4
0.3
0.2
α,ß
0.1
a
c b bc
a
b
ß
α,ß
c
ba b a
ß
ß
ß
α,ß
c
0
t7,c9
% of total fatty acids
C
t8,c10
c9,t11
t9,c11
5
t10,c12
t10,t12
c11,t13
t11,c13
t11,t13
c12,t14
t12,c14
t12,t14
ß
4
3
α
2
α,ß
α,ß
α,ß
α,ß
α,ß
α
1
0
t6/t7/t8
t9
Grass hay-Flaxseed
t10
t11
Grass hay-Sunflower seed
t12
t13/t14
Red clover silage-Flaxseed
t15
t16
Red clover silage-Sunflower seed
Fig. 2. Effect of forage type and oilseed supplementation on atypical dienes (A), conjugated linoleic acid (B) and trans-18:1 isomers (C) in intramuscular fat from feedlot steers. a,b,c,d
Means (±standard error) with different superscripts for a particular fatty acid profile are significantly different (P b 0.05). α: Significant forage effect (P b 0.05); ß: Significant oilseed effect (P b 0.05).
microbes or alterations in endogenous ruminal microbes (Kong, He,
McAlister, Seviour, & Forster, 2010), or disparities in ruminal and duodenal passage rates between these forages (Lee, Harris, Dewhurst, Merry, &
Scollan, 2003).
Vaccenic acid was the major t-18:1 isomer and constituted over
45% of total t18:1 irrespective of diet fed (Fig. 2C). The proportions
of VA found in LT regardless of diet were less than we previously
found when feeding FS in a high RC diet (Mapiye et al., 2013;
6.37%) and when supplementing with either sunflower or flaxseed
oil on pasture (Noci et al., 2007; 8.56%). Differences between present
results and others may, therefore, be related to influences of non-oil
components of the diets. Specifically, the SS fed in the present experiment had a relatively low oil content (29.5%) compared to a typical
value of 40% (Gunstone & Harwood, 1994). Consequently, the amount
of SS that had to be added to the diet to get 5.4% oil was relatively
high (18.4%) and the nutritive or forage value of the hull relatively
low. Subsequently, to balance the digestible energy content across diets,
straw had to be added to the flaxseed containing diets, which would
have led to diminished overall quality of forage in FS containing diets.
Results of the present study, therefore, dramatically reinforce the importance of the non-oil components of the diet when trying to enrich BH
intermediates, particularly VA, in beef.
Emphasis on increasing VA in beef relates to its abilities to reduce
pro-inflammatory cytokines (Jaudszus et al., 2012; Sofi et al., 2010)
and platelet aggregation in humans (Sofi et al., 2010), and substantially
reduce plasma triglycerides in animal models (Wang, Jacome-Sosa, &
Proctor, 2012). It may also have positive health effects through Δ-9
desaturation to RA, which may reduce risk of cardiovascular disease
and cancer, increase bone mass and modulate immune and inflammatory responses (Dilzer & Park, 2012). In the present study, the estimated
levels of VA in LT from steers fed FS and SS containing diets would be
0.08 and 0.12 g per 100 g LT, while the RA contents would be 0.01 and
0.02 g per 100 g LT, respectively. Thus, the RA levels in lean steak from
steers fed SS would contribute 0.6 to 20% of the estimated dietary CLA
intake of 0.1 to 3.0 g/day considered necessary for cancer prevention
(Ip, Singh, Thompson, & Scimeca, 1994; Knekt, Järvinen, Seppänen,
Pukkala, & Aromaa, 1996; Ritzenthaler et al., 2001). Although the levels
of VA required to elicit positive effects on human health remain to be
elucidated, up to 30% of VA is converted to RA in humans (Turpeinen
et al., 2002) suggesting that VA could be regarded as potential RA.
Including VA conversion, LT from steers fed SS could therefore contribute 1.8 to 56% (VA, 1.2 to 36% + RA, 0.6 to 20%) of the dietary CLA intake
considered necessary for cancer prevention. The relative risk to human
health of consuming the individual t-18:1 isomers other than VA
C. Mapiye et al. / Meat Science 95 (2013) 98–109
remains to be elucidated, and thus recommendations to either enrich or
deplete these isomers should be reserved until their effects are known.
Feeding cattle a combination of oils or oilseeds rich in ALA and LA has
been found to result in a synergistic accumulation of VA (AbuGhazaleh,
Schingoethe, Hippen, Kalscheur, & Whitlock, 2002) and CLA (Lock &
Garnsworthy, 2002) in tissues, which may have additive health effects
(Jacome-Sosa et al., 2010). In this respect, it could be worthwhile to
evaluate if supplementing high-forage diets with a blend of SS and
FS would simultaneously enhance concentrations of VA, RA and n−3
PUFA in beef. Effects of feeding mixtures of SS, FS and sources of
long-chain PUFA such as EPA and DHA, which are known potent
inhibitors of BH of 18:1 to 18:0 in the rumen (Chow et al., 2004; Maia,
Chaudhary, Figueres, & Wallace, 2007) may also be worth investigating.
Total c-MUFA and the majority of individual c-MUFA isomers
(c9-16:1, c9-17:1, c9-18:1, c11-18:1, c13-18:1, c15-18:1 and c9-20:1)
were influenced by oilseed type, with steers fed diets containing FS
having greater proportions (P b 0.05) than those fed diets containing
SS (Table 6). The observation that feeding FS increased the proportions
of total c-MUFA and c9-18:1 in muscle when compared with SS agrees
with earlier findings by Jacobs et al. (2011) in cow milk and Bernard,
Bonnet, Leroux, Shingfield, and Chilliard (2009) in goat milk when feeding diets rich in LA and ALA. The levels of c-MUFA in ruminant tissues
reflect the extent of BH of PUFA to c-MUFA in the rumen and the capacity of PUFA/or its BH intermediates to inhibit stearoyl-CoA desaturase
(SCD), which converts 18:0 to c-MUFA in tissues (Nakamura & Nara,
2004). The current findings, therefore, confirm that ALA has a higher
level of BH in the rumen than LA (Doreau & Ferlay, 1994) and/or indicates that ALA is less effective in down-regulating SCD activity than LA
as suggested earlier by Jacobs et al. (2011). The lower total c-MUFA in
SS steers may also relate to displacement of c-MUFA due to increased
total t-18:1 observed in the current study. A forage × oilseed type effect
was noted for c12-18:1, with steers fed GH-SS having the largest proportions, followed by steers fed RC-SS, GH-FS and RC-FS, respectively
(P b 0.05; Table 6). The proportion of a few minor c-MUFA isomers
(c7-16:1 and c14-18:1) were significantly influenced (P b 0.05) by
forage type (Table 6), with steers fed GH having more (P b 0.05)
c7-16:1 and less (P b 0.05) c14-18:1 (Table 6) than those fed RC. These
findings may also be partially ascribed to dissimilarities in forage-borne
microbes, changes in endogenous ruminal microbes (Kong et al., 2010)
or differences in ruminal and duodenal flow rates between these forages
(Lee et al., 2003).
Oleic acid (c9-18:1) was the most abundant c-MUFA in muscle
making up over 65% of total c-MUFA when feeding all diets (Table 6).
Overall, c-MUFA including oleic acid are considered to be beneficial
for human health by reducing inflammation and blood coagulation
factors (Williamson, Foster, Stanner, & Buttriss, 2005), but the effects
of the minor c-MUFA on human health are not known and warrant
further research. For example, serum triglyceride levels of c11-18:1
have now been associated with markers of insulin resistance in men
(Zulyniak et al., 2012).
3.5.4. Saturated fatty acids
The proportions of total branched chain FA (BCFA), iso-15:0,
iso-17:0, anteiso-17, iso-18:0 and some odd-chain SFA (17:0 and 19:0)
were affected by oilseed type, with steers fed FS containing diets having
higher (P b 0.05) proportions than those fed SS (Table 6). Overall, the
reduction of BCFA and odd-chain SFA in ruminant products is related
to a direct inhibition of PUFA on microbial FA synthesis (Vlaeminck,
Fievez, Cabrita, Fonseca, & Dewhurst, 2006). Present results, therefore,
further suggest that ALA has lower inhibitory effects on rumen microbial
FA synthesis than LA. The proportions of iso-15:0, and iso-17:0 were also
influenced (P b 0.05) by forage type with steers fed GH having higher
(P b 0.05) proportions than those fed RC (Table 6). These findings are
consistent with earlier reports by Vlaeminck et al. (2006) who reported
that grass-based diets promote the growth of cellulolytic bacteria rich in
iso-FA. The variation between these two diets might also be linked to
107
dietary differences in leucine, which is deaminated and decarboxylated
to yield isovaleryl-CoA that serve as a substrate for microbial synthesis of
iso-15 and iso-17 (Vlaeminck et al., 2006). A slight increase in 19:0 was
also found when feeding GH as opposed to RC (P b 0.05). Enriching
BCFA in beef could be of interest because of their potential to reduce
cancer (Wongtangtintharn, Oku, Iwasaki, & Toda, 2004) and necrotizing
enterocolitis (Ran-Ressler et al., 2011) in humans.
Total SFA and proportions of 14:0, 15:0, 16:0 and 20:0 were not
influenced by diet (Table 6). The amount of 18:0 was significantly increased (P b 0.05) when feeding SS (Table 6). These results could
again suggest that ALA and its BH intermediates were less effective
at down-regulating SCD activity than LA. Alternatively, differences
in 18:0 might also relate to changes in endogenous FA synthesis,
but lack of differences in 16:0, the major endogenous FA synthesis
product indicates that endogenous synthesis may not have been differentially affected by diet.
3.6. Sensory attributes
Initial (P = 0.04) and overall tenderness (P = 0.05) scores were
higher for LT steaks from steers fed GH compared to RC (Table 7).
These results may relate to lower LT pH at 24 h observed for the
former steers. Overall, the improved tenderness observed as pH falls
below 6.0 has been attributed to higher protease activity (Yu & Lee,
1986), increased sarcomere length (Purchas & Aungsupakorn, 1993)
and greater calcium-induced weakening of myofibrillar protein structures (Takahashi, Kim, & Yano, 1987).
As compared to FS, feeding SS containing diets resulted in steaks
with higher (P b 0.05) ratings for flavor intensity, off-flavor intensity
and lower (P b 0.05) ratings for initial juiciness (Table 7). These
findings may be linked to the differences in intramuscular proportions of n−3 and n−6 PUFA observed for steers fed these diets. Overall,
thermally-induced oxidation of PUFA produces volatile compounds
which may contribute to desirable or undesirable meat flavor depending
on type, amounts and proportions in meat (Elmore, Mottram, Enser, &
Wood, 1999). The finding that steaks from steers fed SS had more desirable flavors and less intense off-flavors may also be partly related to
some positive influences of increased barley grain intake on beef flavor
(Purchas & Davies, 1974). Overall, although some differences in sensory
attributes were noted in the present study, absolute differences were all
less than one sensory panel unit, and these differences would not likely
be detectible by the average consumer.
4. Conclusions
Feeding SS compared to FS in high-forage diets improved beef
production, enhanced sensory qualities and enriched levels of VA
(up to 0.55-fold), RA (up to 0.50-fold) and n − 6 PUFA in beef. On
the other hand, feeding FS compared to SS in high-forage diets
resulted in enrichments of n−3 PUFA, CLNA and AD. However, feeding
FS in high-forage diets also resulted in lower growth rates and smaller
carcasses, which interacted with faster cooling rates to produce meat
with less desirable appearance. Overall, differences in FA profiles,
meat and sensory quality were more influenced by oilseed than forage
type. The influence of the non-oil fraction of the diets, however, may
have resulted in lower PUFA BH intermediates compared to other studies. To consistently increase proportions of BH intermediates in beef,
careful attention must be paid to the non-oil fraction of the diet, and
feeding combinations of SS, FS and long-chain PUFA sources should be
further investigated. The choice of which oil or oilseed combinations
to supplement in diets will, however, ultimately depend on which produces the healthiest FA profile. Extensive bioactivity testing of many
previously uncharacterized BH intermediates will, therefore, also be
required.
108
C. Mapiye et al. / Meat Science 95 (2013) 98–109
Table 7
Effect of forage type and oilseed type on sensory of beef from feedlot steers.
Variables
Initial tenderness
Initial juiciness
Flavor intensity
Off-flavor intensity
Amount of connective tissue
Overall tenderness
Sustainable juiciness
Grass hay
Red clover silage
Flax
Sunflower
Flax
Sunflower
6.50
5.99
5.01
7.09
8.24
6.52
5.59
6.30
5.59
5.27
7.96
8.26
6.53
5.38
5.98
6.01
4.82
6.96
8.09
6.06
5.65
6.16
5.79
5.05
7.63
8.24
6.42
5.57
s.e.m
0.20
0.18
0.18
0.28
0.26
0.24
0.17
Oilseed
Forage
F ∗ O1
0.91
0.001
0.10
0.001
0.21
0.11
0.08
0.04
0.13
0.16
0.26
0.21
0.05
0.20
0.09
0.21
0.87
0.39
0.35
0.08
0.30
a,b,c
Means with different superscripts for a particular sensory trait are significantly different (P b 0.05); s.e.m, standard error of mean.
Oilseed type × forage type interaction; 8-point descriptive scales (1 = extremely tough, extremely dry, extremely bland flavor, extremely intense off-flavor, abundant connective tissue; and 8 = extremely tender, extremely juicy, extremely intense flavor, no off-flavor, no connective tissue detected).
1
Acknowledgments
This research was funded by the Alberta Meat and Livestock Agency
(ALMA). Drs. C. Mapiye and T.D. Turner acknowledge the receipt of
NSERC Fellowships funded through ALMA. Dr. S.D. Proctor holds a New
Investigator Award from the Heart and Stroke Foundation of Canada.
Special thanks are extended to staff at the Lacombe Research Centre
(LRC) Beef Unit of AAFC for animal care, animal management and sample
collection. The slaughter and processing of the cattle by the LRC abattoir
staff is gratefully acknowledged. Contributions of the meat grading and
quality staff at the LRC to the results are appreciated. Ms. I.L. Larsen is
acknowledged for her valuable assistance in statistical analysis.
References
AbuGhazaleh, A. A., Schingoethe, D. J., Hippen, A. R., Kalscheur, K. F., & Whitlock, L. A.
(2002). Fatty acid profiles of milk and rumen digesta from cows fed fish oil, extruded
soybeans or their blend. Journal of Dairy Science, 85(9), 2266–2276.
Aharoni, Y., Orlov, A., & Brosh, A. (2004). Effects of high-forage content and oilseed
supplementation of fattening diets on conjugated linoleic acid (CLA) and trans
fatty acids profiles of beef lipid fractions. Animal Feed Science and Technology,
117(1–2), 43–60.
Aldai, N., Aalhus, J. L., Dugan, M. E. R., Robertson, W. M., McAllister, T. A., Walter, L. J., &
McKinnon, J. J. (2010). Comparison of wheat- versus corn-based dried distillers'
grains with solubles on meat quality of feedlot cattle. Meat Science, 84(3), 569–577.
AOAC (2006). Official methods of analysis (14th ed.)Washington, DC, USA: Association
of Official Analytical Chemists (AOAC).
Basarab, J. A., Aalhus, J. L., Shah, M. A., Mir, P. S., Baron, V. S., Dugan, M., Okine, E. K., &
Robertson, W. M. (2007). Effect of feeding sunflower seeds on the performance,
carcass characteristics, meat quality, retail stability and sensory characteristics of
pasture-fed and feedlot finished beef. Canadian Journal of Animal Science, 87(1), 15–27.
Basarab, J. A., Mir, P. S., Aalhus, J. L., Shah, M. A., Baron, V. S., Okine, E. K., & Robertson, W. M.
(2007). Effect of sunflower seed supplementation on the fatty acid composition of
muscle and adipose tissue of pasture-fed and feedlot finished beef. Canadian Journal
of Animal Science, 87(1), 71–86.
Bernard, L., Bonnet, M., Leroux, C., Shingfield, K. J., & Chilliard, Y. (2009). Effect of
sunflower-seed oil and linseed oil on tissue lipid metabolism, gene expression,
and milk fatty acid secretion in Alpine goats fed maize silage-based diets. Journal
of Dairy Science, 92(12), 6083–6094.
Bessa, R. J. B., Alves, S. P., Jerónimo, E., Alfaia, C. M., Prates, J. A. M., & Santos-Silva, J.
(2007). Effect of lipid supplements on ruminal biohydrogenation intermediates
and muscle fatty acids in lambs. European Journal of Lipid Science and Technology,
109(8), 868–878.
Bezerra, S. B. L., Véras, A. S. C., de Andrade Silva, D. K., de Andrade Ferreira, M., Pereira, K. P.,
de Arruda Santos, G. R., Magalhães, A. L. R., & de Almeida, O. C. (2012). Morphometry
and carcass characteristics of goats submitted to grazing in the Caatinga. Revista
Brasileira de Zootecnia, 41(1), 131–137.
Brethour, J. R. (1992). The repeatability and accuracy of ultrasound in measuring
backfat of cattle. Journal of Animal Science, 70(4), 1039–1044.
Bull, H. S. (1981). Estimating the nutrient value of corn silage. Proceedings of 41st
semi annual meeting of American feed manufacturers association, 18–20 November,
Lexington, KY (pp. 15–19).
Byrne, D. V., Bredie, W. L. P., Bak, L. S., Bertelsen, G., Martens, H., & Martens, M. (2001).
Sensory and chemical analysis of cooked porcine meat patties in relation to
warmed-over flavour and pre-slaughter stress. Meat Science, 59(3), 229–249.
Canadian Food Inspection Agency (1992). Livestock and poultry carcass grading regulations, office consolidation. Part III. Schedules I and II (online). (bhttp://laws.justice.gc.
ca/en/C-0.4/SOR-92-541> (accessed 12.12.2012)).
CCAC (1993). In E. D. Olfert, B. M. Cross, & A. A. McWilliams (Eds.), (2nd ed.)Guide to
the care and use of experimental animals, Vol. 1, Ottawa, Ontario, Canada: Canadian
Council on Animal Care (CCAC).
CFIA (2003). Guide to food labelling and advertising. : Canadian Food Inspection
Agency (http://www.inspection.gc.ca/english/fssa/labeti/guide/toce.shtml. (accessed
12.12.2012)).
Chow, T. T., Fievez, V., Moloney, A. P., Raes, K., Demeyer, D., & Smet, S. D. (2004). Effect
of fish oil on in vitro rumen lipolysis, apparent biohydrogenation of linoleic and
linolenic acid and accumulation of biohydrogenation intermediates. Animal Feed
Science and Technology, 117(1–2), 1–12.
Commission Internationale de l'Eclairage (1978). Recommendations on uniform color
spaces — Color difference equations — Psychometric color terms (CIE publication
no.15 (E-1.3.3)1971/(TC-1.3), supplement no. 2, pp. 8–12). (Paris, France).
Cruz-Hernandez, C., Deng, Z., Zhou, J., Hill, A. R., Yurawecz, M. P., Delmonte, P.,
Mossoba, M. M., Dugan, M. E. R., & Kramer, J. K. G. (2004). Methods for analysis
of conjugated linoleic acids and trans-18:1 isomers in dairy fats by using a combination of gas chromatography, silver-ion thin-layer chromatography/gas chromatography, and silver-ion liquid chromatography. Journal of AOAC International,
87(2), 545–562.
Dilzer, A., & Park, Y. (2012). Implication of conjugated linoleic acid (CLA) in human
health. Critical Reviews in Food Science and Nutrition, 52(6), 488–513.
Doreau, M., Aurousseau, E., & Martin, C. (2009). Effects of linseed lipids fed as rolled
seeds, extruded seeds or oil on organic matter and crude protein digestion in
cows. Animal Feed Science and Technology, 150(3–4), 187–196.
Doreau, M., & Ferlay, A. (1994). Digestion and utilisation of fatty acids by ruminants.
Animal Feed Science and Technology, 45(3–4), 379–396.
Dugan, M. E. R., Kramer, J. K. G., Robertson, W. M., Meadus, W. J., Aldai, N., & Rolland,
D.C. (2007). Comparing subcutaneous adipose tissue in beef and muskox with emphasis on trans 18:1 and conjugated linoleic acids. Lipids, 42(6), 509–518.
Elmore, J. S., Mottram, D. S., Enser, M., & Wood, J. D. (1999). Effect of the polyunsaturated
fatty acid composition of beef muscle on the profile of aroma volatiles. Journal of
Agricultural and Food Chemistry, 47(4), 1619–1625.
Folch, J., Lees, M., & Sloane Stanley, G. H. (1957). A simple method for the isolation and
purification of total lipids from animal tissues. The Journal of Biological Chemistry,
226(1), 497–509.
Fraser, M. D., Fychan, R., & Jones, R. (2000). Voluntary intake, digestibility and nitrogen utilization by sheep fed ensiled forage legumes. Grass and Forage Science, 55(3), 271–279.
Gómez-Cortés, P., Bach, A., Luna, P., Juárez, M., & de la Fuente, M. A. (2009). Effects of
extruded linseed supplementation on n−3 fatty acids and conjugated linoleic
acid in milk and cheese from ewes. Journal of Dairy Science, 92(9), 4122–4134.
Griinari, J. M., & Bauman, D. E. (1999). Biosynthesis of conjugated linoleic acid and its incorporation into meat and milk in ruminants. In M. P. Yurawecz, M. Mossoba, J. K. G.
Kramer, G. Nelson, & M. W. Pariza (Eds.), Advances in conjugated linoleic acid research, Vol. 1. (pp. 180–200)Champaign, IL (USA): AOCS Press.
Gunstone, F. D., & Harwood, J. L. (1994). Occurrence and characterization of oils and
fats. In F. D. Gunstone, J. L. Harwood, & F. B. Padley (Eds.), The lipid handbook
(pp. 101). New York: Chapman & Hall.
He, M. L., McAllister, T. A., Kastelic, J. P., Mir, P. S., Aalhus, J. L., Dugan, M. E. R., Aldai, N.,
& McKinnon, J. J. (2012). Feeding flaxseed in grass hay and barley silage diets to
beef cows increases alpha-linolenic acid and its biohydrogenation intermediates
in subcutaneous fat. Journal of Animal Science, 90(2), 592–604.
Hennessy, A. A., Ross, R. P., Devery, R., & Stanton, C. (2011). The health promoting properties of the conjugated isomers of α-linolenic acid. Lipids, 46(2), 105–119.
Huws, S. A., Lee, M. R. F., Muetzel, S. M., Scott, M. B., Wallace, R. J., & Scollan, N. D.
(2010). Forage type and fish oil cause shifts in rumen bacterial diversity. FEMS
Microbiology Ecology, 73(2), 396–407.
Ip, C., Singh, M., Thompson, H. J., & Scimeca, J. A. (1994). Conjugated linoleic acid suppresses mammary carcinogenesis and proliferative activity of the mammary gland
in the rat. Cancer Research, 54(5), 1212–1215.
Jacobs, A. A. A., van Baal, J., Smits, M. A., Taweel, H. Z. H., Hendriks, W. H., van Vuuren,
A.M., & Dijkstra, J. (2011). Effects of feeding rapeseed oil, soybean oil, or linseed oil
on stearoyl-CoA desaturase expression in the mammary gland of dairy cows. Journal
of Dairy Science, 94(2), 874–887.
Jacome-Sosa, M., Lu, J., Wang, Y., Ruth, M., Wright, D., Reaney, M., Shen, J., Field, C., Vine,
D., & Proctor, S. (2010). Increased hypolipidemic benefits of cis-9, trans-11 conjugated linoleic acid in combination with trans-11 vaccenic acid in a rodent model of
the metabolic syndrome, the JCR:LA-cp rat. Nutrition & Metabolism, 7(1), 1–10.
Jaudszus, A., Jahreis, G., Schlörmann, W., Fischer, J., Kramer, R., Degen, C., Rohrer, C., Roth,
A., Gabriel, H., Barz, D., & Gruen, M. (2012). Vaccenic acid-mediated reduction in
C. Mapiye et al. / Meat Science 95 (2013) 98–109
cytokine production is independent of c9, t11-CLA in human peripheral blood
mononuclear cells. Biochimica et Biophysica Acta — Molecular and Cell Biology of
Lipids, 1821(10), 1316–1322.
Jenkins, T. C. (1993). Lipid metabolism in the rumen. Journal of Dairy Science, 76(12),
3851–3863.
Jenkins, T. C., & Bridges, W. C., Jr. (2007). Protection of fatty acids against ruminal
biohydrogenation in cattle. European Journal of Lipid Science and Technology,
109(8), 778–789.
Jenkins, T. C., Wallace, R. J., Moate, P. J., & Mosley, E. E. (2008). Board-invited review:
Recent advances in biohydrogenation of unsaturated fatty acids within the
rumen microbial ecosystem. Journal of Animal Science, 86(2), 397–412.
Jeremiah, L. E., & Gibson, L. L. (2001). The influence of packaging and storage time on
the retail properties and case-life of retail-ready beef. Food Research International,
34(7), 621–631.
Juárez, M., Dugan, M. E. R., Aalhus, J. L., Aldai, N., Basarab, J. A., Baron, V. S., & McAllister,
T. A. (2011). Effects of vitamin E and flaxseed on rumen-derived fatty acid intermediates in beef intramuscular fat. Meat Science, 88(3), 434–440.
Kim, C. M., Kim, J. H., Oh, Y. K., Park, E. K., Ahn, G. C., Lee, G. Y., Lee, J. I., & Park, K. K.
(2009). Effects of flaxseed diets on performance, carcass characteristics and fatty
acid composition of Hanwoo steers. Asian-Australasian Journal of Animal Sciences,
22(8), 1151–1159.
Klont, R. E., Brocks, L., & Eikelenboom, G. (1998). Muscle fibre type and meat quality.
Meat Science, 49(Supplement 1(0)), S219–S229.
Knekt, P., Järvinen, R., Seppänen, R., Pukkala, E., & Aromaa, A. (1996). Intake of dairy
products and the risk of breast cancer. British Journal of Cancer, 73(5), 687–691.
Kong, Y., He, M., McAlister, T., Seviour, R., & Forster, R. (2010). Quantitative fluorescence in situ hybridization of microbial communities in the rumens of cattle fed
different diets. Applied and Environmental Microbiology, 76(20), 6933–6938.
Kramer, J. K. G., Hernandez, M., Cruz-Hernandez, C., Kraft, J., & Dugan, M. E. R. (2008).
Combining results of two GC separations partly achieves determination of all cis
and trans 16:1, 18:1, 18:2 and 18:3 except CLA isomers of milk fat as demonstrated
using ag-ion SPE fractionation. Lipids, 43(3), 259–273.
Krzywicki, K. (1979). Assessment of relative content of myoglobin, oxymyoglobin and
metmyoglobin at the surface of beef. Meat Science, 3(1), 1–10.
Larmond, E. (1977). Laboratory methods for sensory evaluation of foods. Ottawa, ON:
Agriculture Canada (Publ. 1637).
Lee, M. R. F., Evans, P. R., Nute, G. R., Richardson, R. I., & Scollan, N. D. (2009). A comparison between red clover silage and grass silage feeding on fatty acid composition,
meat stability and sensory quality of the M. Longissimus muscle of dairy cull
cows. Meat Science, 81(4), 738–744.
Lee, M. R. F., Harris, L. J., Dewhurst, R. J., Merry, R. J., & Scollan, N. D. (2003). The effect of
clover silages on long chain fatty acid rumen transformations and digestion in beef
steers. Animal Science, 76(3), 491–501.
Liu, Q., Lanari, M. C., & Schaefer, D. M. (1995). A review of dietary vitamin E supplementation for improvement of beef quality. Journal of Animal Science, 73(10), 3131–3140.
Lock, A. L., & Garnsworthy, P. C. (2002). Independent effects of dietary linoleic and
linolenic fatty acids on the conjugated linoleic acid content of cows' milk. Animal
Science, 74(1), 163–176.
Maia, M. R. G., Chaudhary, L. C., Figueres, L., & Wallace, R. J. (2007). Metabolism of polyunsaturated fatty acids and their toxicity to the microflora of the rumen. Antonie
Van Leeuwenhoek, 91(4), 303–314.
Mapiye, C., Turner, T. D., Rolland, D. C., Basarab, J. A., Baron, V. S., McAllister, T. A., Block,
H. C., Uttaro, B., Aalhus, J. L., & Dugan, M. E. R. (2013). Adipose tissue and muscle
fatty acid profiles of steers fed red clover silage with and without flaxseed. Livestock
Science, 151(1), 11–20.
Miquel, E., Alegrı́a, A., Barberá, R., Farré, R., & Clemente, G. (2004). Stability of tocopherols in adapted milk-based infant formulas during storage. International Dairy
Journal, 14(11), 1003–1011.
Mir, P. S., Ivan, M., He, M. L., Pink, B., Okine, E., Goonewardene, L., McAllister, T. A.,
Weselake, R., & Mir, Z. (2003). Dietary manipulation to increase conjugated linoleic
acids and other desirable fatty acids in beef: A review. Canadian Journal of Animal
Science, 83, 673–685.
Młynek, K., & Guliński, P. (2007). The effect of growth rate and age at slaughter on
dressing percentage and colour, pH48 and microstructure of longissimus dorsi
muscle in Black-and-White (BW) bulls vs commercial crossbreds of BW with
beef breeds. Animal Science Papers and Reports, 25(2), 65–71.
Molendi-Coste, O., Legry, V., & Leclercq, I. A. (2011). Why and how meet n−3 PUFA
dietary recommendations? Gastroenterology Research and Practice.
Nakamura, M. T., & Nara, T. Y. (2004). Structure, function, and dietary regulation of Δ6,
Δ5, and Δ9 desaturases. Annual Review of Nutrition, 24, 345–376.
Nassu, R. T., Dugan, M. E. R., He, M. L., McAllister, T. A., Aalhus, J. L., Aldai, N., & Kramer,
J. K. G. (2011). The effects of feeding flaxseed to beef cows given forage based
diets on fatty acids of longissimus thoracis muscle and backfat. Meat Science,
89(4), 469–477.
Noci, F., French, P., Monahan, F. J., & Moloney, A. P. (2007). The fatty acid composition
of muscle fat and subcutaneous adipose tissue of grazing heifers supplemented
with plant oil-enriched concentrates. Journal of Animal Science, 85(4), 1062–1073.
109
Purchas, R. W., & Aungsupakorn, R. (1993). Further investigations into the relationship
between ultimate pH and tenderness for beef samples from bulls and steers. Meat
Science, 34(2), 163–178.
Purchas, R. W., & Davies, H. L. (1974). Carcass and meat quality of Friesian steers fed on
either pasture or barley. Australian Journal of Agricultural Research, 25(1), 183–192.
Raes, K., De Smet, S., & Demeyer, D. (2004). Effect of dietary fatty acids on incorporation
of long chain polyunsaturated fatty acids and conjugated linoleic acid in lamb, beef
and pork meat: A review. Animal Feed Science and Technology, 113(1–4), 199–221.
Ran-Ressler, R. R., Khailova, L., Arganbright, K. M., Adkins-Rieck, C. K., Jouni, Z. E., Koren,
O., Ley, R. E., Brenna, J. T., & Dvorak, B. (2011). Branched chain fatty acids reduce
the incidence of necrotizing enterocolitis and alter gastrointestinal microbial ecology
in a neonatal rat model. PLoS One, 6(12).
Ritzenthaler, K. L., McGuire, M. K., Falen, R., Shultz, T. D., Dasgupta, N., & McGuire, M. A.
(2001). Estimation of conjugated linoleic acid intake by written dietary assessment
methodologies underestimates actual intake evaluated by food duplicate methodology. Journal of Nutrition, 131(5), 1548–1554.
Sarnklong, C., Coneja, J. W., Pellikaan, W., & Hendriks, W. H. (2010). Utilization of rice
straw and different treatments to improve its feed value for ruminants: A review.
Asian-Australasian Journal of Animal Sciences, 23(5), 680–692.
SAS (2009). SAS user's guide: Statistics. SAS for windows. Release 9.2. Cary NC: SAS Institute
Inc.
Scollan, N. D., Costa, P., Hallett, K., Nute, G. R., Wood, J. D., & Richardson, R. I. (2006). The
fatty acid composition of muscle fat and relationships to meat quality in Charolais
steers: Influence of level of red clover in the diet. Proceedings of the British Society of
Animal Science (pp. 23). : British Society of Animal Science0906562 52 X.
Shibata, K. (1966). Spectrophotometry of opaque biological materials. In D. Glick (Ed.),
Methods of biochemical analysis, Vol. 9. (pp. 217–234)New York: Interscience.
Shingfield, K. J., Bonnet, M., & Scollan, N. D. (2013). Recent developments in altering the fatty
acid composition of ruminant-derived foods. Animal, 1(Supplement 1), 132–162.
Shingfield, K. J., Salo-Väänänen, P., Pahkala, E., Toivonen, V., Jaakkola, S., Piironen, V., &
Huhtanen, P. (2005). Effect of forage conservation method, concentrate level and
propylene glycol on the fatty acid composition and vitamin content of cows'
milk. The Journal of Dairy Research, 72(03), 349–361.
Sofi, F., Buccioni, A., Cesari, F., Gori, A. M., Minieri, S., Mannini, L., Casini, A., Gensini, G.F.,
Abbate, R., & Antongiovanni, M. (2010). Effects of a dairy product (pecorino
cheese) naturally rich in cis-9, trans-11 conjugated linoleic acid on lipid, inflammatory
and haemorheological variables: A dietary intervention study. Nutrition, Metabolism,
and Cardiovascular Diseases, 20(2), 117–124.
Sukhija, P. S., & Palmquist, D. L. (1988). Rapid method for determination of total fatty
acid content and composition of feedstuffs and feces. Journal of Agricultural and
Food Chemistry, 36(6), 1202–1206.
Takahashi, K., Kim, O. H., & Yano, K. (1987). Calcium-induced weakening of Z-disks in
postmortem skeletal muscle. Journal of Biochemistry, 101(3), 767–773.
Turpeinen, A. M., Mutanen, M., Aro, A., Salminen, I., Basu, S., Palmquist, D. L., & Griinari,
J. M. (2002). Bioconversion of vaccenic acid to conjugated linoleic acid in humans.
The American Journal of Clinical Nutrition, 76(3), 504–510.
Van Ranst, G., Lee, M. R. F., & Fievez, V. (2011). Red clover polyphenol oxidase and lipid
metabolism. Animal, 5(04), 512–521.
Van Soest, P. J., Robertson, J. B., & Lewis, B. A. (1991). Methods for dietary fiber, neutral
detergent fiber, and nonstarch polysaccharides in relation to animal nutrition.
Journal of Dairy Science, 74(10), 3583–3597.
Vanhatalo, A., Kuoppala, K., Toivonen, V., & Shingfield, K. J. (2007). Effects of forage species
and stage of maturity on bovine milk fatty acid composition. European Journal of Lipid
Science and Technology, 109(8), 856–867.
Vlaeminck, B., Fievez, V., Cabrita, A. R. J., Fonseca, A. J. M., & Dewhurst, R. J. (2006). Factors
affecting odd- and branched-chain fatty acids in milk: A review. Animal Feed Science
and Technology, 131(3–4), 389–417.
Wang, Y., Jacome-Sosa, M. M., & Proctor, S. D. (2012). The role of ruminant trans fat as a
potential nutraceutical in the prevention of cardiovascular disease. Food Research
International, 46(2), 460–468.
Williamson, C. S., Foster, R. K., Stanner, S. A., & Buttriss, J. L. (2005). Red meat in the diet.
Nutrition Bulletin, 30(4), 323–355.
Wongtangtintharn, S., Oku, H., Iwasaki, H., & Toda, T. (2004). Effect of branched-chain
fatty acids on fatty acid biosynthesis of human breast cancer cells. Journal of Nutritional Science and Vitaminology, 50(2), 137–143.
Wood, J. D., Richardson, R. I., Nute, G. R., Fisher, A. V., Campo, M. M., Kasapidou, E.,
Sheard, P. R., & Enser, M. (2004). Effects of fatty acids on meat quality: A review.
Meat Science, 66(1), 21–32.
Yu, L. P., & Lee, Y. B. (1986). Effects of postmortem pH and temperature muscle structure
and meat tenderness. Journal of Food Science, 51(3), 774–780.
Zulyniak, M. A., Ralston, J. C., Tucker, A. J., MacKay, K. A., Hillyer, L. M., McNicholas, P. D.,
Graham, T. E., Robinson, L. E., Duncan, A. M., Ma, D. W. L., & Mutch, D. M. (2012).
Vaccenic acid in serum triglycerides is associated with markers of insulin resistance in men. Applied Physiology, Nutrition, and Metabolism, 37(5), 1003–1007.
Academia.edu no longer supports Internet Explorer.
To browse Academia.edu and the wider internet faster and more securely, please take a few seconds to upgrade your browser.
Effects of feeding flaxseed or sunflower-seed in high-forage diets on beef production, quality and fatty acid composition
Meat Science, 2013
By John Basarab
...Read more
Related Papers
Livestock Science, 2008
Download

animal, 2014
Download

Animal Feed Science and Technology, 2011
Download

Journal of Agricultural Science, 2017
Download
Meat Science, 2011
Download

Livestock Science, 2011
Download

Foods
Download
Download
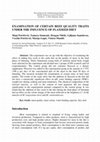
Italian Journal of Animal Science
Download

Meat Science, 2018
Download
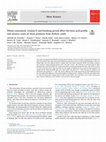


Download