Interdisciplinary Environmental Review, Vol. 11, No. 4, 2010
Study of physico-chemical quality of the industrial
waste water effluent from Gove industrial area of
Bhiwandi City of Maharashtra, India
P.U. Singare*
Department of Chemistry, Bhavan’s College,
Munshi Nagar, Andheri (West), Mumbai 400058, India
E-mail: pravinsingare@vsnl.net
*Corresponding author
R.S. Lokhande
Department of Chemistry, University of Mumbai,
Santacruz, Vidyanagari, Mumbai 400098, India
E-mail: rama.lokhande@yahoo.com
A.G. Jagtap
Department of Chemistry, Vani Junior College,
Mulund, Mumbai 400081, India
E-mail: asmi.jagtap@rediffmail.com
Abstract: This paper advocates water pollution study of Gove industrial area
of Maharashtra, India with special reference to the physico-chemical
characteristics of common industrial waste water effluent. The
physico-chemical parameters like temperature, pH, solid content, total
hardness, chloride content, dissolved oxygen (DO), biological oxygen demand
(BOD) and chemical oxygen demand (COD) were studied by collecting
samples bimonthly for 12 months. The authors point out that as India moves
towards stricter regulation of industrial effluents to control water pollution,
greater efforts are required to reduce the risk to public health as toxic pollutants
which are mainly colourless and odourless are released into the ecosystems.
Keywords: industrial pollution; physico-chemical characteristics; Gove
industrial area; Bhiwandi City; Maharashtra; India; dissolved oxygen; DO;
biological oxygen demand; BOD; chemical oxygen demand; COD; USPH
standard; ISI standard.
Reference to this paper should be made as follows: Singare, P.U.,
Lokhande, R.S. and Jagtap, A.G. (2010) ‘Study of physico-chemical quality of
the industrial waste water effluent from Gove industrial area of Bhiwandi City
of Maharashtra, India’, Interdisciplinary Environmental Review, Vol. 11,
No. 4, pp.263–273.
Biographical notes: Pravin U. Singare completed his Masters in Inorganic
Chemistry (1997) and PhD in Chemistry (1999), both from University of
Mumbai, India. He has worked at Sikkim Mining Corporation, Sikkim, India,
on a project related to the concentration of Cu/Pb/Zn sulphide ores. He is
presently a Senior Lecturer in Chemistry at Bhavan’s College, Andheri,
Copyright © 2010 Inderscience Enterprises Ltd.
263
264
P.U. Singare et al.
Mumbai. His research areas of interest are radioanalytical nuclear chemistry,
ion exchange techniques, studies on Ayurvedic Indian medicinal plants and
environmental analysis. He is a member of many scientific societies like ISAS,
NAARI and INS all from BARC, Mumbai, and the Indian Council of Chemists,
India.
Ram S. Lokhande completed his Masters in Physical Chemistry from Mumbai
University in 1976, PhD (Chemistry) from Advanced Study Centre in Nuclear
Chemistry, University of Pune in 1981. He is presently working as a Professor
of Chemistry and has many research papers published and presented at national
and international level. His research areas of interest are radioanalytical nuclear
chemistry, environmental chemistry, solvent extraction, and ion exchange
techniques. He is a member of many scientific societies like ISAS, NAARI and
INS all from BARC, Mumbai, and the Indian Council of Chemists, Agra, India.
Asmita G. Jagtap completed her Masters in Analytical Chemistry (2001) and
Bachelors in Education (BEd) (2003) both from University of Mumbai. She has
completed her Master of Philosophy (MPhil) in Chemistry (2009) from
Madurai Kamraj University. She is working as a Lecturer in Chemistry with
Vani Junior College, Mulund, Mumbai. At present, she is actively involved in
research related to environmental pollution monitoring in and around Mumbai
City.
1
Introduction
During the past few decades Indian industries have registered a quantum jump, which has
contributed to high economic growth but simultaneously it has also given rise to severe
environmental pollution. Consequently, the water quality is seriously affected which is
far lower in comparison to the international standards. Waste water from manufacturing
or chemical processing industries contributes to water pollution. Industrial waste water
usually contains specific and readily identifiable chemical compounds. It is found that
one-third of the total water pollution comes in the form of effluent discharge, solid wastes
and other hazardous wastes. Out of this, a large portion can be traced to the processing of
industrial chemicals and to the food products industry. The surface water is the main
source of industries for waste disposal. Untreated or allegedly treated effluents have
increase the level of surface water pollution up to 20 times the safe level in 22 critically
polluted areas of the country. It is found that almost all rivers are polluted in most of the
stretches by some industry or the other. Although all industries function under the strict
guidelines of the Central Pollution Control Board (CPCB) but still the environmental
situation is far from satisfactory. Different norms and guidelines are given for all the
industries depending upon their pollution potentials. Most major industries have
treatment facilities for industrial effluents. But this is not the case with small-scale
industries, which cannot afford enormous investments in pollution control equipment as
their profit margin is very slender. In fact, a number of large- and medium-sized
industries in the region covered by the Ganga Action Plan do not have adequate effluent
treatment facilities. As a result in India there are sufficient evidences available related
with the mismanagement of industrial wastes (Rajaram and Das, 2008). Most of these
defaulting industries are sugar mills, distilleries, leather processing industries, paper mill,
Study of physico-chemical quality of the industrial waste water effluent
265
agrochemical and pesticides manufacturing industries and pharmaceutical industries.
Consequently, at the end of each time period the pollution problem takes menacing
concern. The problem is still worse in the case of water pollution. Therefore in the
present investigation, we have carried out a systematic study of physico-chemical
characteristics of waste water effluent from Gove industrial area located at Bhiwandi City
of Maharashtra, India. The industrial belt has grown rapidly in last few years with
different types of industries like sugar mills, distilleries, leather processing industries,
paper mill, agrochemicals/pesticides manufacturing industries and pharmaceutical
industries. All the industrial waste water effluent is discharged in Ulhas River flowing
nearby which further find its outlet in Arabian Sea of Mumbai. The objective of the
present work is to throw light on the pollution level around the Gove industrial belt,
suggesting the need for regular scientific studies, which will help to gauge the extent of
pollution.
2
Materials and methods
2.1 Area of study
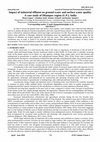
The Gove industrial area lies near Saravali Village of Bhiwandi City in Thane District. Its
total area is 23,672 square feet, coordinates are between latitude 19°.30’ N and longitude
73°.07’ E. A narrow stream of Ulhas River flowing by the industrial area, joins the
Arabian Sea at Mumbai. The area is situated on the Kalyan-Bhiwandi road at a distance
of about 53 km from Mumbai City. The Gove industrial area is under the jurisdiction of
Bhiwandi-Nizampur Municipal Corporation. The industrial area is linked to Mumbai and
other cities and town by major highways and railways. It is well connected with the rest
of the country by Mumbai-Agra National highway (NH3). The geographical location of
Gove industrial area is shown in Figure 1.
Figure 1
Geographical location of Gove industrial area (see online version for colours)
266
P.U. Singare et al.
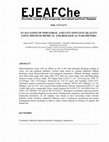
Figure 2 Common industrial waste water effluents from Gove industrial area (see online version
for colours)
2.2 Climatic conditions
The weather of Gove industrial area is typical humid and humidity is 74%. The average
rainfall recorded is from 1,500 mm to 2,000 mm. The temperature is between 31°C
(maximum) to 18°C (minimum). The rains are restricted for four monsoon months from
June to September.
2.3 Requirements
All the glassware, casserole and other pipettes were first cleaned with tape water
thoroughly and finally with de-ionised distilled water. The pipettes and burette were
rinsed with solution before final use. The chemicals and reagent were used for analysis
were of A.R. grade. The procedure for calculating the different parameters were
conducted in the laboratory.
2.4 Sample collection and preservation
Polythene bottles of 2.5 L and 2.0 L were used to collect the Grab water samples from
common industrial waste water effluent from Gove industrial area. The sampling location
is shown in Figure 2. The bottles were thoroughly cleaned with hydrochloric acid,
washed with tape water to render free of acid, washed with distilled water twice, again
rinsed with the water sample to be collected and then filled up the bottle with the sample
leaving only a small air gap at the top. The sample bottles were stoppard and sealed with
paraffin wax. The samples were collected bimonthly three times a day, during the period
Study of physico-chemical quality of the industrial waste water effluent
267
of January to December 2009. Water samples (500 mL) were filtered using Whatman
No. 41 (0.45 µm pore size) filter paper for estimation of dissolved metal content. Filtrate
(500 mL) was preserved with 2 mL nitric acid to prevent the precipitation of metals. The
samples were concentrated to tenfold on a water bath and subjected to nitric acid
digestion using the microwave-assisted technique, setting pressure at 30 bar and power at
700 Watts (Clesceri, 1998; Paar, 1998).
2.5 Physico-chemical study
The samples collected were analysed for pH, conductivity, alkalinity, salinity, hardness,
chemical oxygen demand (COD), dissolved oxygen (DO) and biochemical oxygen
demand (BOD). The techniques and methods followed for collection, preservation,
analysis and interpretation are those given by Rainwater and Thatcher (1960), Brown
et al. (1970), ICMR (1975), Hem (1985) and APHA (1995).
3
Results and discussion
The common industrial waste water effluent samples collected from Gove industrial area
of Bhiwandi City were analysed for their physico-chemical properties and the
experimental data is presented in Table 1.
Temperature is one of the most important ecological features. It controls behavioural
characteristics of organisms, solubility of gases and salts in water. The basis of all life
functions is complicated set of biochemical reactions that are influenced by physical
factors such as temperature. Disease resistance is also linked to temperature. Increase in
temperature also increases the rate of microbial activity. As the temperature of water
rises, the available quantity of DO decreases. Temperature increase may become barrier
to fish migration and in this way seriously affect on reproduction of species. The major
sources of thermal pollution are industrial cooling systems working in a manufacturing
plant or a power plant. In the present study, the temperature of waste water effluent varies
between 27.0°C to 31.0°C, with the average value of 28.9°C. The monthly variation in
temperature of waste water effluent collected is graphically represented in Figure 3.
pH is a measure of the acidity or alkalinity of water and is one of the stable
measurements. pH is a simple parameter but is extremely important, since most of the
chemical reactions in aquatic environment are controlled by any change in its value.
Anything either highly acidic or alkaline would kill marine life. Aquatic organisms are
sensitive to pH changes and biological treatment requires pH control or monitoring. The
toxicity of heavy metals also get enhanced at particular pH. Thus, pH is having primary
importance in deciding the quality of waste water effluent. Waters with pH value of about
ten are exceptional and may reflect contamination by strong base such as NaOH and
Ca(OH)2 (Langmuir, 1997). The range of desirable pH of water prescribed for drinking
purpose by ISI (1991) and WHO (1984) is 6.5 to 8.5. The pH values of waste water
effluents collected in the present investigation varied from 6.45 to 8.67, with an average
value of 7.65, which lies within the permissible limits. The monthly variation in pH
values of waste water effluent collected is graphically represented in Figure 3.
268
P.U. Singare et al.
Table1
Physico-chemical data of common waste water industrial effluent samples collected from
Gove industrial area
Study of physico-chemical quality of the industrial waste water effluent
269
Figure 3 Monthly variation in temperature, pH and DO of industrial waste water effluent
collected from Gove industrial area (see online version for colours)
Temperature
pH
DO
Physico-Chemical parameters
35
30
25
20
15
10
5
-November
December
-September
October
July-August
May-June
March-April
-January
February
0
Months
Figure 4 Monthly variation in TDS, total hardness, chloride content, BOD and COD values of
industrial waste water effluent collected from Gove industrial area (see online version
for colours)
TDS
Total Hardness
Chloride content
BOD
COD
Physico-Chemical Parameters (mg/L)
18000
15000
12000
9000
6000
3000
0
NovemberDecember
SeptemberOctober
July-August
May-June
March-April
JanuaryFebruary
Months
Total dissolved solids (TDS) content in water is a measure for salinity. A large number of
salts are found dissolved in natural waters, the common ones are carbonates,
bicarbonates, chlorides, sulphates, phosphates, and nitrates of calcium, magnesium,
sodium, potassium, iron, and manganese, etc. A high content of dissolved solid elements
270
P.U. Singare et al.
affects the density of water, influences osmoregulation of freshwater in organisms,
reduces solubility of gases (like oxygen) and utility, of water for drinking, irrigational,
and industrial purposes. In the present investigation, the TDS content in waste water
effluent lies in the range of 6,237 to 16,933 mg/L, with an average value of 10,125 mg/L.
Waters can be classified based on the concentration of TDS (ICMR,1975; Wilcox,1955)
as, desirable for drinking (up to 500 mg/L), permissible for drinking (up to 1,000 mg/L),
useful for irrigation (up to 2,000 mg/L), not useful for drinking and irrigation (above
3,000 mg/L). Based on the above classification the waste water effluent cannot be
considered safe even for irrigation purpose. The monthly variation in TDS content of
waste water effluent collected is graphically represented in Figure 4.
Hardness is the property which prevents the lathering of soap. The temporary
hardness is due to dissolved bicarbonates of Ca, Mg while permanent hardness is due to
chloride, sulphate and nitrates of Ca and Mg (Hem, 1985).The hard water have number of
adverse effects on industrial process and it affect the quality of fabrics, dyes, organic
matter, sugar, etc. In the present study, total hardness of waste water effluent lies between
302 mg/L to 382 mg/L, with an average value of 329 mg/L. This indicates that, the total
hardness content is above 300 mg/L, which is the maximum permissible limit set by ISI.
The monthly variation in total hardness content of waste water effluent collected is
graphically represented in Figure 4.
Chloride occurs in all natural waters in widely varying concentrations. Excessive
chloride in potable water is not particularly harmful and the criteria set for this anion are
based primarily on palatability and its potentially high corrosiveness (Bhujangaiah and
Nayak, 2005). Chloride in excess (> 250 mg/L) imparts a salty taste to water and people
who are not accustomed to high chlorides may be subjected to laxative effects. The
chloride content in the waste water effluent ranged between 990 and 1,793 mg/L, with an
average value of 1,377 mg/L. The results indicate that the chloride content is very much
above the acceptable limit of 200 mg/L set by WHO and 250 mg/L according to ISI. The
monthly variation in chloride content of waste water effluent collected is graphically
represented in Figure 4.
Oxygen is an important parameter which is essential for the metabolism of all aquatic
organisms that possess aerobic respiration. Concentration of DO indicates water quality
and its relation to the distribution and abundance of various algal species. Presence of DO
in water may be due to direct diffusion from air and photosynthetic activity of autotrophs.
Oxygen is measured in its dissolved form as DO. The addition of a variety of
biodegradable pollutants from industrial sources stimulates the growth of
microorganisms, which consume the DO. DO content in water is also lowered due to
inorganic fertilisers such as phosphates and nitrate which over stimulate algal growth. If
more oxygen is consumed than is produced, DO levels decline and some sensitive
animals may move away, weaken, or die. DO levels fluctuate seasonally and over a
24-hour period. They vary with water temperature and altitude. Cold water holds more
oxygen than warm water and water holds less oxygen at higher altitudes. Thermal
discharges, such as water used to cool machinery in a manufacturing plant or a power
plant, raise the temperature of water and lower its oxygen content. Aquatic animals are
most vulnerable to lowered DO levels in the early morning on hot summer days when
stream flows are low, water temperatures are high, and aquatic plants have not been
producing oxygen since sunset. Low DO levels can be the result of elevated temperature
and thus the inability of the water to hold the available oxygen. Low DO levels also
Study of physico-chemical quality of the industrial waste water effluent
271
indicate an excessive demand on the oxygen in the system. Some pollutants such as acid
mine drainage produce direct chemical demands on oxygen in the water for certain
oxidation-reduction reactions. Other pollutants such as sewage or agricultural runoff
result in the build-up of organic matter and the consumption of DO by microbial
decomposers as they break down the organic matter. The DO quickly erodes and pits
boilers-tubes; hence its determination is important. In the present study, the average DO
content was found to vary between 1.10 mg/L to 3.70 mg/L, with the average value of
1.95 mg/L, which is very much below the minimum DO content of 4.0 to 6.0 mg/L
according to USPH standard. The monthly variation in DO content of waste water
effluent collected is graphically represented in Figure 3. It is important here to note that
DO levels below 3 ppm are stressful to most aquatic organisms. Fish growth and activity
usually require 5–6 ppm of DO. Levels below 5 ppm will not support fish at all
(Banerjea, 1967). Decrease in DO may lead to changes in the composition of aquatic life,
such as fish deaths and reduced fishery.
BOD may be defined as the rate of removal of oxygen by microorganisms in aerobic
degradation of the dissolved organic matter in water over a 5-day period. Increases in
BOD can be due to animal and crop wastes and domestic sewage. BOD values have been
widely adopted as a measure of pollution effect. It is one of the most common measures
of pollutant organic material in water. It indicates the amount of putrescible organic
matter present in water. Sources of BOD include leaves and woody debris, dead plants
and animals, animal manure, effluents from pulp and paper mills, wastewater treatment
plants, feedlots, and food-processing plants, failing septic systems, and urban storm water
runoff. In the present study the average BOD values varies between minimum of
245 mg/L and maximum of 876 mg/L with average value of 651 mg/L. The values
obtained here are very much high than the maximum permitted BOD content of
< 100 to 300 mg/L according to UN Department of Technical Cooperation for
Development. The monthly variation in BOD content of waste water effluent collected is
graphically represented in Figure 4. It is important here to note that low BOD content is
an indicator of good quality water, while a high BOD indicates polluted water. BOD
directly affects the amount of DO in rivers and streams. The greater the BOD, the more
rapidly oxygen is depleted in the stream. This means less oxygen is available to higher
forms of aquatic life. The consequences of high BOD are the same as those for low DO:
aquatic organisms become stressed, suffocate, and die.
All organic compounds with few exceptions can be oxidised by the action of strong
oxidising agents under acidic condition. The COD determination is a measure of the
oxygen equivalent of that portion of the organic matter in a sample that is susceptible to
oxidation by a strong chemical oxidant. During COD determination; oxygen demand
value is useful in specifying toxic condition and presence of biologically resistant
substances. It is an important, rapidly measured parameter for industrial waste water
studies and control of waste treatments. COD test is used to measure the load of organic
pollutants in the industrial waste water. The COD and BOD values both are a measure of
the relative oxygen-depletion effect of a waste contaminant. Both have been widely
adopted as a measure of pollution effect. COD is also one of the most common measures
of pollutant organic material in water. COD is similar in function to BOD, in that both
measure the amount of organic compounds in water.In the present investigation the COD
values varies between 452 mg/L to 4,200 mg/L with average value of 1,981 mg/L, which
272
P.U. Singare et al.
is very much higher than maximum allowed limit of 4.0 mg/L according to USPH
Standard. The monthly variation in COD content of waste water effluent collected is
graphically represented in Figure 4.
4
Conclusions
Around the world as countries are struggling to arrive at an effective regulatory regime to
control the discharge of industrial effluents into their ecosystems, Indian economy holds
a double edged sword of economic growth and ecosystem collapse. The present
experimental data indicates high level of pollution at Gove industrial area of Bhiwandi
City of Maharashtra, India. The experimental data suggests a need to implement common
objectives, compatible policies and programmes for improvement in the industrial waste
water treatment methods. It also suggests a need of consistent, internationally recognised
data driven strategy to assess the quality of waste water effluent and generation of
international standards for evaluation of contamination levels. The existing situation if
mishandled can cause irreparable ecological harm in the long-term well masked by shortterm economic prosperity.
Acknowledgements
The authors are grateful to the editorial board of Interdisciplinary Environmental Review
(IER) for their valuable suggestions; all errors remain to the authors.
References
American Public Health Association (APHA) (1995) Standard Methods for Estimation of Water
and Wastewater, 19th ed., American Water Works Association, Water Environment
Federation, Washington.
Banerjea, S.M. (1967) ‘Water quality and soil conditions of fish ponds in some States of India in
relation to fish production’, Indian J. Fish., Vol.14, Nos.1/2, pp.115–144.
Bhujangaiah, N.S. and Nayak, P.V. (2005) ‘Study of ground water quality in and around Shimoga
City, Karnataka’, J. Ind. Coun. Chem., Vol. 22, No. 1, pp.42–47.
Brown, E., Skougstad, M.W. and Fishman, M.J. (1970) ‘Methods for collection and analysis of
water samples for dissolved minerals and gases’, Techniques of Water Resources
Investigations of the US Geological Survey, Vol. 160, Book 5, Chapter A1.
Clesceri, L.S. (1998) ‘Standard methods for the examination of water and waste water’, in
Greenbergy, A.E. and Eaton, A.D. (Eds.): Collection and Preservation of Samples and Metals,
pp.1-27–1-35; 3-1–3-21, APHA, AWWA, WEF, Washington DC.
Hem, J.D. (1985) Study and Interpretation of Chemical Characteristics of Natural Water,
3rd ed., US Geological Survey, Washington.
Indian Council of Medical Research (ICMR) (1975) Manual of Standards of Quality for Drinking
Water Supplies.
Indian Standard Institute (ISI) (1991) Drinking Water Specification.
Langmuir, D. (1997) Aqueous Environmental Chemistry, Prentice-Hall, Inc., New Jersey.
Paar, A. (1998) Microwave Sample Preparation System – Instruction Handbook, pp.128, Anton,
Paar GmbH, Austria.
Study of physico-chemical quality of the industrial waste water effluent
273
Rainwater, F.H. and Thatcher, L.L. (1960) ‘Methods for collection and analysis of water samples’,
US Geol. Surv. Water Supply Papers, 1454, pp.1–301.
Rajaram, T. and Das, A. (2008) ‘Water pollution by industrial effluents in India: discharge
scenarios and case for participatory ecosystem specific local regulation’, Futures, Vol. 40,
No. 1, pp.56–69.
Wilcox, L.V. (1955) Classification and Use of Irrigation Waters, US Dept. of Agricultural Science,
p.966.
World Health Organization (WHO) (1984) Guidelines for Drinking Water Quality. Health Criteria
and Other Supporting Information, Vol. 1, WHO, Geneva.
Keep reading this paper — and 50 million others — with a free Academia account
Used by leading Academics

Maria Niklińska
Jagiellonian University

Roger Saint-Fort
Mount Royal University

Richard Smardon
SUNY: College of Environmental Science and Forestry

Praveen Saptarshi
Savitribai Phule Pune University