Quaternary Geochronology 4 (2009) 378–390
Contents lists available at ScienceDirect
Quaternary Geochronology
journal homepage: www.elsevier.com/locate/quageo
Review
Radiocarbon: A chronological tool for the recent past
Quan Hua*
Australian Nuclear Science and Technology Organisation (ANSTO), PMB 1, Menai, New South Wales 2234, Australia
a r t i c l e i n f o
a b s t r a c t
Article history:
Received 2 April 2007
Received in revised form
3 March 2009
Accepted 6 March 2009
Available online 2 April 2009
The past few hundred years have seen large fluctuations in atmospheric 14C concentration. In part, these
have been the result of natural factors, including the climatic changes of the Little Ice Age, and the Spörer
and Maunder solar activity minima. In addition, however, changes in human activity since the middle of
the 19th century have released 14C-free CO2 to the atmosphere. Moreover, between c. 1955 and c. 1963,
atmospheric nuclear weapon testing resulted in a dramatic increase in the concentration of 14C in the
atmosphere. This was followed by a significant decrease in atmospheric 14C as restrictions on nuclear
weapon testing began to take effect and as rapid exchange occurred between the atmosphere and other
carbon reservoirs. The large fluctuations in atmospheric 14C that occurred prior to 1955 mean that
a single radiocarbon date may yield an imprecise calibrated age consisting of several possible age ranges.
This difficulty may be overcome by obtaining a series of 14C dates from a sequence and either wigglematching these dates to a radiocarbon calibration curve or using additional information on dated
materials and their surrounding environment to narrow the calibrated age ranges associated with each
14
C date. For the period since 1955 (the bomb-pulse period), significant differences in atmospheric 14C
levels between consecutive years offer the possibility of dating recent samples with a resolution of from
one to a few years. These approaches to dating the recent past are illustrated using examples from peats,
lake and salt marsh sediments, tree rings, marine organisms and speleothems.
Ó 2009 Elsevier Ltd. All rights reserved.
Keywords:
Radiocarbon dating
Chronology
Recent past
Carbon-14 wiggle-matching
Bomb-pulse carbon-14 dating
1. Introduction
The past few centuries have been characterised by dramatic and
significant environmental changes. Sub-millennial scale climatic
variations have resulted in a shift from the Little Ice Age, which
began around the 14th century and may have continued to the mid19th century, to the warm episode of the last half century. Human
activity has also contributed to changes in the Earth’s environment
via land clearing, urbanisation and industrialisation, especially
since 1850. Studies of these changes require a precise and accurate
chronological framework, to which radiocarbon dating can
contribute. Sixty years after the discovery of radiocarbon dating by
W.F. Libby (1946), the method provides one of the most reliable and
well-established means of dating the Holocene and Late Pleistocene. This is indicated by the worldwide existence of over 150
radiocarbon laboratories (Anon., 2008) that deliver tens of thousands of radiocarbon dates every year (Geyh, 2005). After a short
description of basic radiocarbon dating, this paper discusses the
features, potential and limitations of the method for dating the past
few hundred years. Examples of the use of the technique in
* Tel.: þ61 2 9717 3671; fax: þ61 2 9717 9265.
E-mail address: qhx@ansto.gov.au
1871-1014/$ – see front matter Ó 2009 Elsevier Ltd. All rights reserved.
doi:10.1016/j.quageo.2009.03.006
constructing chronologies of recent environmental archives and
dating recent materials are presented.
2. Radiocarbon dating method
2.1. Principles
Carbon has three natural isotopes: 12C and 13C, with relative
abundances of w98.9% and w1.1%, and 14C or radiocarbon, which
occurs only in minute amounts (w1.2 � 10�10% in the troposphere,
for example) (Olsson, 1968). Carbon-12 and 13C are stable isotopes,
while 14C is radioactive. Radiocarbon is produced continuously in
the atmosphere by the interaction of the secondary neutron flux
from cosmic rays with atmospheric 14N, following the reaction
14
N þ n (neutron) / 14C þ p (proton). About 55% of 14C is formed in
the lower stratosphere and 45% in the upper troposphere (Gäggeler,
1995). Following its production, 14C is oxidised to produce 14CO2,
which is quickly dispersed throughout the atmosphere. The 14C is
then transferred to other carbon reservoirs, such as the biosphere
and oceans, via photosynthesis and air-sea exchange of CO2
respectively. Living organisms take up radiocarbon through the
food chain and via metabolic processes. This provides a supply of
14
C that compensates for the decay of the existing 14C in the
organism, establishing an equilibrium between the 14C
�Q. Hua / Quaternary Geochronology 4 (2009) 378–390
379
concentration in living organisms and that of the atmosphere.
When an organism dies, this supply is cut off and the 14C concentration of the organism starts to decrease by radioactive decay at
a rate given by the radiocarbon half-life. This rate is independent of
other physical and environmental factors. The time t elapsed since
the organism was originally formed can be determined from:
bones (Hedges and van Klinken, 1992), pollen extracted from peats
and lake sediments (Brown et al., 1989, 1992), macrofossils from
lake sediments (Goslar et al., 2000; Kitagawa and van der Plicht,
2000), foraminifera from marine sediments (Broecker et al., 1990;
Hughen et al., 2000) and specific skeletal components of carbonate
sediments (Woodroffe et al., 1999, 2007).
�
�
T1=2
NðtÞ
t ¼ �
ln
No
ln 2
2.4. Radiocarbon conventional ages
(1)
where T1/2 is the radiocarbon half-life, No is the original 14C
concentration in the organism and N(t) is its residual 14C concentration at time t.
2.2. Contamination
In general, any organism containing carbon and that once lived
in equilibrium with atmospheric 14C can be dated by the radiocarbon method. Typical material for radiocarbon dating includes
wood, charcoal and bones. Before samples are processed for dating,
any contaminants (carbon-containing materials that do not belong
to the original sample) must be removed, otherwise incorrect ages
may be determined. According to Hedges (1992), the removal of
contamination, known as the pretreatment step, can be carried out
using two strategies. The first involves the physical and chemical
removal of contaminants such as soils and sediments from the
surrounding environment, roots and rootlets that may have penetrated from higher up the sequence, dissolved carbonates carried by
groundwater, and humic acids derived from decomposed organic
materials in the upper part of the sequence (Olsson, 1979; Mook
and Streurman, 1983). This approach is usually employed in the case
of samples of charcoal and wood. The second strategy involves the
extraction of a specific contamination-free component from the
sample, such as collagen from bones (Longin, 1971; Hedges and van
Klinken, 1992) and alpha-cellulose from woods (Head, 1979; Hoper
et al., 1998; Hua et al., 2004a; Anchukaitis et al., 2008).
2.3. Measurement methods
Two different methods have been used for the measurement of
14
C concentration in a sample: decay counting and accelerator mass
spectrometry (AMS). Since 14C is radioactive, emitting b� particles
with a maximum energy of about 156 keV, 14C can be measured by
detecting these particles. This decay counting or radiometric
method involves measuring 14C by either gas proportional or liquid
scintillation counters (Taylor, 1987). In the case of gas proportional
counters, pretreated samples are converted to CO2, while liquid
scintillation counters employ benzene synthesised from the
samples. By contrast, rather than counting the b� particles resulting
from 14C decay, whose rate is controlled by the long 5730 year halflife of 14C (Godwin, 1962), the AMS method counts 14C atoms
directly (relative to those of the stable carbon isotopes 13C and 12C
in the samples). Compared to the radiometric method, AMS has
advantages in terms of measurement time (from tens of minutes to
a few hours for AMS compared to a few days for the radiometric
method) and the quantity of material required for dating (0.1–2 mg
of carbon for AMS compared to 0.5–2 g or more of carbon for the
radiometric method) (Tuniz et al., 1998; Jull and Burr, 2006). For
AMS, pretreated samples are converted to CO2 and then graphite.
After three decades of development, samples containing as little as
10–20 mg of carbon can now be reliably analysed by AMS (Hua et al.,
2004b; de Jong et al., 2004; Santos et al., 2007; Smith et al., 2007;
Petrenko et al., 2008). The ability to analyse small samples using
AMS techniques has opened up opportunities for radiocarbon
dating of new materials such as specific amino acids extracted from
Radiocarbon ages are reported in years before present (BP),
where ‘present’ is conventionally defined as AD 1950. In radiocarbon age calculations, the atmospheric 14C concentration in 1950,
a hypothetical value, is conventionally set at 100 percent Modern
Carbon (pMC) (Stuiver and Polach, 1977) or 1 fraction modern
carbon (F) (Donahue et al., 1990; McNichol et al., 2001; Reimer
et al., 2004a). As isotopic fractionation (differentiation against
heavier isotopes) occurs in nature, for example during photosynthesis and air-sea exchange of CO2, different carbon materials have
different d13C values (Hoefs, 1987). In addition, the depletion in 14C
relative to 12C as a result of fractionation is approximately twice the
depletion in 13C relative to 12C (Craig, 1954). Measured 14C
concentrations must therefore be corrected for isotopic fractionation using d13C. Conventionally, this is achieved by the normalisation of measured 14C values from measured d13C to d13C ¼ �25&
PDB (an average d13C value for C3 plants) before age calculations are
performed.
To simplify the calculation of radiocarbon ages, atmospheric 14C
concentration is assumed to be constant through time, with the
implication that all living terrestrial materials have an initial 14C
concentration of F ¼ 1. From equation (1), the conventional radiocarbon age of a sample S is defined as:
t ¼ �
T1=2
lnðFS Þ
ln 2
(2)
or
t ¼ �8033 lnðFS Þ
(3)
14
where FS is the C concentration in sample S in fraction modern
carbon after correction to d13C ¼ �25& PDB. This value is determined by measuring sample S against 14C standard reference
materials such as oxalic acid I (Olsson, 1970), oxalic acid II (Stuiver,
1983) or ANU-sucrose (Polach, 1979). T1/2 is the Libby half-life of
radiocarbon of 5568 years. This half-life is approximately 3%
shorter than the correct half-life of 5730 � 40 years (Godwin, 1962).
The discrepancy between the two half-lives is corrected during the
radiocarbon calibration process.
Ages up to about 50 000 years (w9 to 10 half-lives of 14C) can be
determined by radiocarbon dating.
2.5. Calibration
It is well known that the 14C concentration of the atmosphere
has not been constant in the past (Reimer et al., 2004b). Variations
in atmospheric 14C concentrations are mainly due to variations in
the rate of radiocarbon production in the atmosphere, caused by
changes in the Earth’s magnetic field, variability in solar activity
and changes in the carbon cycle (Taylor, 1987; Damon and Sonett,
1991). Long-term (103–104 years) fluctuations in atmospheric 14C
are the result of changes in the Earth’s magnetic field. Short- and
medium-term (101–102 years) variations in atmospheric 14C are
mainly due to variability in solar activity, although centennial-scale
variability may also be due to changes in geomagnetic field intensity (St-Onge et al., 2003). The result is that radiocarbon and
calendar ages are not identical, and the former ages have to be
�380
Q. Hua / Quaternary Geochronology 4 (2009) 378–390
converted to the latter using a calibration curve, which describes
the atmospheric 14C concentration in the past measured in
precisely and independently dated materials. The current internationally-ratified calibration curve IntCal04 covers the past 26 000
calendar years (cal) BP (Reimer et al., 2004b). This curve is based on
dendrochronologically-dated tree rings for the period 0–12 400 cal
BP. For the remaining period 12 400–26 000 cal BP, the curve is
derived from independently dated marine samples such as foraminifera and corals, with an assumption of a constant marine
reservoir effect for each sampling site. Beyond the IntCal04 timescale, there are several published age calibration data sets. These
are derived from independently dated materials such as corals
(Fairbanks et al., 2005), foraminifera in marine sediments (Hughen
et al., 2006), speleothems (Beck et al., 2001) and terrestrial
macrofossils in varved sediments (Kitagawa and van der Plicht,
2000). However, these data sets are not in good agreement beyond
26 000 cal BP (van der Plicht et al., 2004) either because the
archives from which the data sets are derived have their own
problems and/or because the data sets are based on a simple
assumption of a constant radiocarbon reservoir effect through time
(van der Plicht, 2002).
Calibration of 14C ages is usually undertaken using a computer
program. Several calibration programs are available on-line. These
include CALIB (http://radiocarbon.pa.qub.ac.uk/), OxCal (http://c14.
arch.ox.ac.uk/embed.php%3FFile¼oxcal.html) and CalPal (http://
www.calpal.de/). Additional calibration programs can be found on
the Radiocarbon journal website at http://www.radiocarbon.org/
Info/index.html.
2.6. Reservoir effects
The deep ocean has a much lower 14C content than that of the
atmosphere. This is because deep ocean waters experience long
periods when they are not in contact with the atmosphere (the
residence time of carbon in the deep ocean is w800 years
(Broecker, 2000)). During this time the 14C content of deep ocean
waters is depleted by radioactive decay. As a result, materials
drawing carbon from deep ocean reservoirs may have lower initial
14
C concentrations than contemporaneous materials of terrestrial
origin. This may result in their appearing older than contemporaneous terrestrial materials. In the case of the surface ocean, by
contrast, interaction with both the atmosphere and the deep ocean
means that surface waters have 14C concentrations that are intermediate between these two reservoirs. Organisms that live in the
surface ocean, such as shells, corals and planktonic foraminifera,
therefore appear younger than contemporaneous deep ocean
materials, but older than contemporaneous terrestrial samples. The
offset between surface ocean and terrestrial samples is known as
the marine reservoir age (R). To calibrate a radiocarbon date for
a surface ocean sample, the IntCal04 curve can be used with
a known value of R. Alternatively, the current internationally-ratified marine calibration curve, Marine04 (Hughen et al., 2004), can
be used, with a known value of regional offset from the global
marine model age for that sample, defined as DR. The latter method
is generally preferred and an on-line database of DR for different
regions is available (Reimer and Reimer, 2001). For age calibration,
the DR and R of a location are usually assumed to be constant
through time (Stuiver et al., 1986). However, recent studies have
reported variations of several hundred to a couple of thousand
years in these values during the Late-glacial (for the southwest
Pacific (Sikes et al., 2000), the Mediterranean (Siani et al., 2001),
northern and equatorial Atlantic (Kromer et al., 2004; Bondevik
et al., 2006; Cao et al., 2007; Sarnthein et al., 2007), and northern
and tropical Pacific (Sarnthein et al., 2007)) and the Holocene (for
the tropical Pacific (Yu et al., 2007; McGregor et al., 2008)). These
variations are due to changes in ocean circulation and the carbon
cycles associated with climatic changes. Temporal variations in DR
and R values should therefore be considered when calibrating 14C
ages of marine samples from these regions.
Aquatic plant fragments, freshwater shells and lake sediments
are also influenced by reservoir effects. These materials can appear
older than contemporaneous terrestrial samples because a portion
of the carbon in lakes comes from depleted 14C-carbon sources,
such as dissolved inorganic carbon from groundwater and
carbonates from limestone (Deevey et al., 1954). This reservoir age
lies between several hundred to more than a thousand years
(Colman et al., 2000; Zoppi et al., 2001) and can vary significantly
with time (Geyh et al., 1998). Radiocarbon dates from these materials must therefore be corrected for any reservoir effect before
being calibrated using the IntCal04 curve.
3. Radiocarbon dating of the recent past: features, potential
and limitations
During the past few hundred years the carbon cycle has experienced both human disturbance and natural variation. The natural
variations are largely a product of climatic change (for example, the
Little Ice Age from approximately the 14th to the mid-19th centuries) and changes in solar activity (for example, the Spörer,
Maunder and Dalton minima). Disturbances due to human activities include anthropogenic CO2 perturbation resulting from the
combustion of fossil fuel, changes in land use since the middle 19th
century and 14C disturbances due to atmospheric nuclear explosions beginning in 1945. These variations and disturbances have led
to changes in atmospheric 14C concentration through time.
3.1. Radiocarbon dating during the period before the onset
of bomb 14C
Natural short- and medium-term variations in atmospheric 14C
are largely attributable to solar variability, especially to changes in
the magnetic field strength of the solar wind. These alter the
magnitude of deflection (the shielding effect) of galactic cosmic
rays travelling towards the Earth, resulting in variations in
secondary neutron flux and in the production rate of 14C in the
atmosphere (Stuiver and Quay, 1980). As a result, during intervals of
high solar activity, shielding of the Earth’s atmosphere from cosmic
rays increases, which causes a decrease in 14C production. By
contrast, during periods of low solar activity, the shielding effect
decreases, leading to an increase in 14C production. Climatic change
also contributes to short- and medium-term variations in atmospheric 14C via the redistribution of 14C between carbon reservoirs
(mainly the atmosphere and oceans) due to changes in air–sea
exchange of CO2, variations in deep water formation and changes in
the ocean’s thermohaline circulation (THC) (Stocker and Wright,
1996; Broecker, 1997; Broecker et al., 1999; Clark et al., 2002). A
weaker THC results in higher atmospheric 14C as less 14C from the
surface ocean/atmosphere is carried away to the deep ocean, while
a stronger THC results in lower atmospheric 14C.
The centuries before the first appearance of bomb 14C in the
mid-20th century are characterised by large fluctuations in atmospheric 14C concentration. These are depicted in Fig. 1. Increases in
atmospheric 14C, which are centred on AD 1500, 1700 and 1815, are
largely the product of the Spörer, Maunder and Dalton solar activity
minima respectively, although a small portion of these increases
may be attributed to changes in the carbon cycle associated with
climatic change during the LIA (Stuiver and Quay, 1980; Damon and
Sonett, 1991; Bard et al., 1997). The large decrease in atmospheric
14
C after c. AD 1900 is mainly due to the continuous release of
14
C-free CO2 to the atmosphere as a consequence of the combustion
�381
Q. Hua / Quaternary Geochronology 4 (2009) 378–390
a
Year (AD)
1500
1600
1700
IntCal04 calibration curve
Gaussian distribution of uncalibrated 14C age
Probability distribution of calibrated ages
600
1800
1900
500
Radiocarbon Age (BP)
Radiocarbon Age (BP)
1400
600
500
400
300
400
300
200
100
150 ± 40 BP
0
200
100
1400
1500
1600
1700
1800
1900
Year (AD)
b
Fig. 2. Calibration of a single radiocarbon date of 150 � 40 years BP using the IntCal04
calibration curve (shown at a 1s range). The calibrated age of this sample encompasses
five possible age ranges from AD 1660 to 1950 (indicated by the grey boxes).
20
0
S
M
D
-10
-20
LIA
-30
1400
1500
1600
1700
1800
1900
Year (AD)
Fig. 1. Atmospheric 14C in the period AD 1400–1950. (a) The IntCal04 curve (Reimer
et al., 2004b) plotted at a 1s range. (b) Atmospheric D14C, derived from the IntCal04
data, plotted at a 1s range. D14C is the age- and fractionation-corrected deviation from
the hypothetical value of atmospheric 14C in 1950 (Stuiver and Polach, 1977).
S ¼ Spörer minimum, M ¼ Maunder minimum, D ¼ Dalton minimum and LIA ¼ the
Little Ice Age.
of fossil fuels since AD 1850. This is known as the Suess effect
(Suess, 1955). It is worth noting that the combustion of fossil fuels
in the period c. AD 1850–1900 was too small to cause an obvious
decrease in atmospheric 14C (Marland et al., 2008). These 14C
variations result in large fluctuations (wiggles) in the IntCal04
curve for recent periods, particularly from AD 1650 to 1950 (Fig. 1a).
Any attempt to determine the calibrated age of a sample with a 14C
age of few hundred years may thus yield several possible age
ranges. As an illustration, a single sample with a conventional
radiocarbon age of 150 � 40 years BP is shown in Fig. 2. The calibrated age of this sample contains five possible age ranges from AD
1660 to 1950, indicated by grey boxes. Even if the precision of the
age were improved, the range of calibrated ages would not change.
This provides a limit to the capacity of radiocarbon methods for
dating the recent past when only a single sample is dated. In other
words, the existence of large wiggles in the calibration curve during
the last few centuries markedly decreases the precision of single
radiocarbon dates.
In order to avoid this problem and to obtain more precise calibrated ages, two approaches have been applied, both using a series
of 14C dates instead of a single date. The first approach is known as
14
C wiggle-matching. This is illustrated in Fig. 3. A series of samples,
each separated by known time-spans (ti), is dated by radiocarbon.
These radiocarbon dates form a block of wiggles that can be
compared with those in the radiocarbon calibration curve. This
block of 14C dates is shifted along the x-axis. When the total
difference between these radiocarbon dates and the calibration
curve reaches a minimum, the best fit of the two data sets is
approached and a more precise calibrated age associated with each
single date in the series is obtained (Pearson, 1986; Bronk Ramsey
et al., 2001; Geyh, 2005). Radiocarbon wiggle-matching between
a series of 14C dates and a radiocarbon calibration curve can be
performed using the OxCal calibration program (Bronk Ramsey,
2001). The 14C wiggle-matching method has been used to date peat
profiles on the assumption that the peat accumulated in a piecewise linear fashion (Blaauw and Christen, 2005; Yeloff et al., 2006).
The second approach also uses multiple 14C dates in sequence, but
additional information on dated materials and their surrounding
environment (for example, changes in peat composition) is
required to narrow the calibrated age ranges associated with each
14
C date (Turetsky et al., 2004; Goslar et al., 2005; Yeloff et al.,
2006). In this way, more precise calibrated ages can be achieved.
Examples of these approaches are illustrated in Section 4.
There are small differences in the natural atmospheric 14C
concentration between the Northern and Southern Hemispheres.
These are known as inter-hemispheric 14C offsets. The Southern
Hemisphere has a larger surface ocean area than the Northern
Hemisphere (w60% compared to w40%) with greater wind velocities. As a result, more 14C in the southern troposphere is transported to the oceans through air-sea exchange of CO2 and more
600
Radiocarbon Age (BP)
∆14C (o/oo)
10
500
400
300
200
100
t1
0
1400
1500
1600
1700
t2
t3
1800
t4
1900
Year (AD)
Fig. 3. Radiocarbon dating by the wiggle-matching method. The solid dots represent
a series of radiocarbon dates separately by known time intervals (ti, with i ¼ 1–4). The
error bars are 1s. The dates form a block of wiggles (dashed grey lines) that may be
moved along the x-axis to achieve the best fit with the 1s range of the IntCal04 curve
(solid black lines).
�Q. Hua / Quaternary Geochronology 4 (2009) 378–390
3.2. Bomb-pulse radiocarbon dating
As a result of hundreds of atmospheric nuclear detonations
almost entirely in the Northern Hemisphere in the late 1950s and
early 1960s, there was a dramatic increase in the concentration of
14
C in the atmosphere. Atmospheric 14C reached a maximum in the
Northern Hemisphere in AD 1963–1964, almost double its prebomb level (Fig. 5). Since then, atmospheric 14C concentrations
have decreased due to rapid exchange between the atmosphere
and other carbon reservoirs (mainly the biosphere and oceans).
Although several atmospheric nuclear bomb tests were carried out
in the period AD 1945–1951, these were too small to increase
atmospheric 14C (Hua et al., 1999) and the take-off in atmospheric
14
C began only in AD 1955 with the injection of moderate amounts
of 14C into the atmosphere in association with atmospheric nuclear
bomb tests during AD 1952–1954. For the period since AD 1955,
significant differences in atmospheric 14C levels between consecutive years offer the possibility of dating recent terrestrial samples
with a resolution of from one to a few years. Bomb-pulse 14C dating,
which is based on the 14C concentration in materials at the time of
their formation, therefore differs from conventional radiocarbon
dating, which is based on the residual 14C concentration in dated
samples due to radioactive decay. For the bomb period, measured
14
C concentration is usually reported in pMC or F rather than as
radiocarbon ages, and a bomb 14C curve is employed to convert the
measured pMC or F values to calendar years. A simple illustration of
bomb-pulse 14C dating is shown in Fig. 5, in which a sample S with
a 14C concentration of FS possesses two possible calendar age ranges
T1 and T2.
Hua and Barbetti (2004) recently reviewed all available atmospheric 14C data for the bomb period from AD 1955 onwards and
provided a comprehensive compilation of tropospheric bomb 14C
concentration for use in bomb-pulse 14C dating. They compiled four
zonal data sets of tropospheric bomb 14C data at (mostly) monthly
700
400
350
C Age (BP)
600
500
300
250
200
14
Radiocarbon Age (BP)
14
C-depleted CO2 from the oceans is transported to the southern
troposphere. Natural 14C levels in the southern troposphere are
therefore usually lower than those in the northern troposphere,
and the radiocarbon ages of terrestrial materials in the Southern
Hemisphere for a particular period of time are usually older than
those in the Northern Hemisphere. The calibration curves for the
northern (IntCal04) (Reimer et al., 2004b) and southern (SHCal04)
(McCormac et al., 2004) temperate regions for the past few
hundred years are shown in Fig. 4. For the period AD 1500–1920,
the SHCal04 radiocarbon ages are older than their IntCal04 counterparts with a difference varying from 3 to 63 14C years. However,
for the period from AD 1920 to 1955, the SHCal04 radiocarbon ages
are almost equal to or younger than their Northern Hemisphere
counterparts, with a maximum 14C offset of 35 years in AD 1940.
This is due to a weaker dilution effect of 14C-free CO2 from the
combustion of fossil fuels in the southern troposphere compared to
that in the northern troposphere (the primary source of this
anthropogenic CO2 is in the Northern Hemisphere) (McCormac
et al., 1998; Stuiver and Braziunas, 1998). There is currently no
radiocarbon calibration curve that may be applied to tropical
regions. A decadal 14C data set derived from dendrochronologicallydated tree rings from northern Thailand for the period AD 1620–
1780 (Hua et al., 2004a) is shown in the inset diagram of Fig. 4 in
comparison with IntCal04 and SHCal04. The Thai data differ little
from IntCal04 for the period of steep decrease in 14C age (AD 1630–
1710), but are similar to SHCal04 for the period AD 1720–1780. A
simple calibration data set for the tropics based on average values
of IntCal04 and SHCal04 may therefore not be ideal, especially for
the use of radiocarbon to reconstruct high-precision tropical
chronologies.
150
400
100
1600
1650
300
1700
1750
1800
Year (AD)
200
IntCal04
SHCal04
N. Thailand (17°N, 102°E)
100
1400
1500
1600
1700
1800
1900
Year (AD)
Fig. 4. Radiocarbon calibration curves for the period AD 1400–1950. IntCal04 and
SHCal04 are representative of northern and southern temperate regions respectively.
In the inset diagram these records are compared with decadal 14C data from tropical
northern Thailand. The error bars for the Thai data are 1s.
resolution (three in the Northern Hemisphere and one in the
Southern Hemisphere), which are depicted in Fig. 6. Significant
differences in 14C between the four zones are evident for the early
bomb period from the late 1950s to the late 1960s. As almost all the
sources of bomb 14C were located in the Northern Hemisphere, the
distribution of bomb 14C during this period reflects the major zones
of atmospheric circulation and their boundaries as excess 14C was
transferred southwards from the northern high-latitudes (Hua and
Barbetti, 2004, 2007). Since AD 1980, the atmospheric 14C level of
the Southern Hemisphere has been slightly higher than that of the
Northern Hemisphere. This is a result of greater contamination by
14
C-free anthropogenic CO2 in the Northern Hemisphere. Several
calibration programs have been devised for bomb-pulse 14C dating.
These include CALIBomb (http://radiocarbon.pa.qub.ac.uk/)
(Stuiver and Reimer, 1993) and OxCal v4.0 (http://c14.arch.ox.ac.uk/
embed.php%3FFile¼oxcal.html) (Bronk Ramsey, 2001). The bombpulse 14C method has been used to date recent skeletons for
forensic studies (Wild et al., 1998), to establish the age of drugs and
wines (Zoppi et al., 2004), and to date human cells and teeth for
biological studies (Spalding et al., 2005; Bhardwaj et al., 2006).
Further applications of this dating method are described in the next
section.
2.0
Fraction modern carbon (F)
382
Bomb curve for Northern Hemisphere
zone 1
F value measured in sample S
Probability distribution of calibrated
dates
1.8
1.6
Fs
1.4
1.2
1.0
1950
T1
1960
T2
1970
1980
1990
2000
Year (AD)
Fig. 5. Atmospheric 14C in Northern Hemisphere zone 1 for the period AD 1955–2000
(Hua and Barbetti, 2004). For an F value measured in a terrestrial sample S (FS), bomb
14
C delivers two possible calendar dates (T1 and T2), indicated by the grey boxes.
�383
Q. Hua / Quaternary Geochronology 4 (2009) 378–390
4. Examples of radiocarbon dating of the recent past
4.1. Dating of peat profiles
The radiocarbon dating of recent peat profiles has been undertaken by a number of investigators (Gallagher et al., 2001; Goodsite
et al., 2001; Mauquoy et al., 2002; Blaauw et al., 2003; Donders
et al., 2004; Charman and Garnett, 2005; van der Linden and van
Geel, 2006). A comprehensive review of dating recent peats was
carried out by Turetsky et al. (2004), who discussed several dating
methods, including 14C and the use of chronostratigraphic age
markers. They concluded that radiocarbon dating of recent peat
profiles may offer accurate and precise results at decadal-scale
resolution for the few hundred years before the onset of bomb 14C
and at 1–2 year resolution during the bomb period. Here, two
examples of radiocarbon dating of recent peats using different age–
depth models are presented.
Yeloff et al. (2006) radiocarbon-dated a number of peat profiles
in northwest Europe. For each core a series of radiocarbon dates on
terrestrial plant remains, composed of seeds and Sphagnum stems
and branches, were obtained at 1 cm intervals. The authors used
two different age models based on Bayesian statistics to estimate
peat accumulation rates: 14C wiggle-matching using the Bpeat
Fraction modern carbon (F)
a
program (Blaauw and Christen, 2005) and multiple dates from
a stratigraphic sequence using BCal (Buck et al., 1999). Bpeat
assumes piece-wise linear accumulation of peat deposits, while
BCal uses constraints in the chronological ordering of dates (deeper
samples are older than shallower samples) to reduce the calibrated
age ranges of individual 14C dates. The authors dated five northern
European ombrotrophic peat bogs. The accumulation rates at each
site derived using the two methods were generally similar. A
comparison of the rates estimated using the two methods for the
top part (30–50 cm depth) of a peat core from Lille Vildmose
(Denmark) is shown in Fig. 7.
Goslar et al. (2005) dated a number of peat profiles in Europe
spanning the past 400 years. At each site, high sampling resolution
was achieved by collecting materials at 3–5 mm intervals. In most
cases Sphagnum was used for 14C analysis. The maximum values of
bomb 14C in peat profiles varied between sites, and in all cases were
lower than the atmospheric bomb peak value. This implies that the
peat sections contain a mixture of 14C assimilated over a period
longer than the resolution of atmospheric records. This period was
estimated for each site and taken into account when an age–depth
model was built. Goslar et al. used multiple dates from a stratigraphic sequence and lithological information (accumulation rates
may change when lithological conditions change) to constrain their
2.0
NH zone 1
NH zone 2
NH zone 3
SH zone
1.8
1.6
1.4
1.2
1.0
1950 1955 1960 1965 1970 1975 1980 1985 1990 1995 2000
Year (AD)
b
Fig. 6. (a) Regional tropospheric 14C curves for the period AD 1955–2001 for four different zones (Northern Hemispheric zones 1–3 and Southern Hemispheric zone). (b) The four
zones into which the tropospheric 14C data have been grouped (Hua and Barbetti, 2004).
�384
Q. Hua / Quaternary Geochronology 4 (2009) 378–390
cal BP
500
30
400
300
200
200
100
0
200
100
100
b
d
100
80
Sphagnum
Cuspidatum
300
Sphagnum
magellanicum
400
Sphagnum section
Cuspidata
500
60
Sphagnum tenellum
300
Monocots undiff.
cal BP
14
C Age (BP)
400
20
Depth (cm)
35
40
45
50
a
c
Fig. 7. Age–depth models for the top part (30–50 cm depth) of a peat core from Lille Vildmose in Denmark. (a) The age–depth model based on Bpeat wiggle-matching. The dark
solid line indicates the best fit with the IntCal04 curve. The grey bars indicate 95% confidence intervals. (b) The section of the IntCal04 calibration curve corresponding to the period
during which the peat was deposited. (c) The age–depth model based on BCal (solid line). The hollow histograms represent the probability distributions of individual calibrated ages
calculated using CALIB 5.0. The solid histograms depict the possible calibrated age ranges of individual samples determined by BCal. (d) The main plant macrofossil components in
the peat sequence expressed as percentages. The reduction in the accumulation rate above 40 cm inferred by the BCal age model coincides with a change in peat composition from
Sphagnum section Cuspidata/Sphagnum cupsidatum to Sphagnum magellanicum (Yeloff et al., 2006).
age–depth model. Fig. 8 illustrates an age–depth model for peat
core Mauntschas-03 from southeast Switzerland and its evolution
after three stages of 14C dating. The results show that the denser the
sequence of 14C dates, the more accurate the age–depth model.
Although many studies have reported good results from the 14C
dating of peats, the method is not free of problems. Charman and
Garnett (2005) dated two peat profiles from Butterburn Flow in
England. They found that many of the ages were older than
expected and that the oldest ages occurred at the top of the profiles.
This may have been because the most recent peat samples had been
affected by inputs of older carbon from industrial emissions such as
coal burning and the fallout of particulates. These contaminants
may have included spheroidal carbonaceous particles, which would
not have been removed completely during sample pretreatment as
a result of their bonding to Sphagnum leaves (they may be retained
within the pores on the cells: see Charman and Garnett (2005) and
references therein). This implies that peats from areas close to
industrial activity should not be used for radiocarbon dating.
4.2. Dating of lake and salt marsh sediments
Accurate radiocarbon dating of lake and salt marsh sediments is
not simple due to the presence in such deposits of organic and
inorganic carbon materials from various sources (McGeehin et al.,
2004). Dating is complicated by reservoir effects (in the case of
aquatic plant macrofossils and inorganic materials) and by the
reworking of older material into recent sediments. In order to
determine which materials from modern lake sediments are most
suitable for 14C dating, Davidson et al. (2004) dated a range of
organic materials from a core from Sky Lake, Mississippi, USA. They
found twigs (representing 1–2 years of growth) of local plant
species to be more reliable for 14C dating than either fine
(>250 mm) organic debris or wood fragments (from large branches
or tree trunks). The 14C content of the twigs showed a clear bomb
signal that was always higher than that of either the fine organic
debris or the wood fragments at the same depths (Fig. 9a). They
therefore used twigs to date two cores from the same lake (Fig. 9b).
The results showed a good match between the 14C content of the
twigs and that in nearby tree rings for the bomb period. Prior to
this, there was a generally decreasing trend in 14C concentration
with depth. Although a few data points from one of the cores did
not match the bomb curve very well and variations are evident in
the pre-bomb data, perhaps the result of minor bioturbation or the
occasional influx of reworked materials from the surrounding
forest (Davidson et al., 2004), this method shows considerable
promise for dating recent lake sediments.
Marshall et al. (2007) constructed a chronology of deposition for
a 76 cm sequence of salt marsh sediments from Poole Harbour in
southern England. They radiocarbon-dated fragments of grass
stem, which lay horizontally in the clayey sediment matrix. This
sampling strategy was used to minimise the chance of younger
roots being selected for dating. As grass stems are fragile, the use of
these samples for dating also minimised the possibility that the
materials had been reworked. The 14C values of the grass fragments
from the top 26.5 cm of the sequence followed both the rising and
the falling limbs of the pulse in bomb 14C. Chronological ordering
(deeper samples are older than shallower samples) and independent time markers (obtained from the analysis of pollen and
spheroidal carbonaceous particles) were used as constraints to
eliminate unlikely calibrated age ranges of individual 14C ages,
allowing the construction of a reliable chronology of deposition.
Another approach to dating lake sediments involves the direct
analysis of the deposit. McGeehin et al. (2004) extracted humin
(<63 mm) from two lake sediment cores from Grenada Lake, northcentral Mississippi, USA. Humin samples were oxidised to CO2
using a stepped-combustion method, with samples combusted at
400� C and then 900� C. In all cases, the bomb 14C values of the low
temperature (400� C) fractions were much higher than those of the
high temperature (900� C) fractions, indicating an improvement in
dating of sediment by combusting at low temperature. The authors
argued that the combustion of sediments at low temperature could
reduce the contribution of reworked carbon bound to clay minerals.
�Q. Hua / Quaternary Geochronology 4 (2009) 378–390
385
However, the bomb 14C values of the low temperature fractions
were still significantly lower than those of the atmosphere, indicating a reservoir effect problem in direct dating of sediments.
4.3. Dating of tree rings
Bomb radiocarbon has been used to validate the annual nature
of distinct growth zones or rings in some species of tropical and
temperate trees and mangroves (Worbes and Junk, 1989; Fichtler
et al., 2003; Menezes et al., 2003; Biondi et al., 2007). The 14C
concentration in wood reflects the atmospheric 14C at the time it
was formed. By measuring 14C concentrations in the individual
growth rings of a tree and comparing them with a suitable atmospheric bomb curve, the dates of their growth may be determined.
Comparing these growth years with those estimated from ring
counts makes it possible to establish whether the tree produces
annual rings. As shown in Fig. 5, each value of 14C for the period
after AD 1955 gives two possible (calendar) time windows: one on
the rising limb and the other on the falling limb of the bomb curve.
To overcome this problem, at least two single growth rings in each
tree need to be analysed. The most suitable period for this kind of
application is from AD 1958 to 1970, when the differences in
atmospheric 14C between consecutive years are highest and the
bomb 14C method delivers the greatest temporal resolution
(Fig. 6a). Alpha-cellulose extracted from wood should be used for
14
C analysis in order to obtain a reliable determination of 14C
concentration in single growth rings (Hua et al., 1999). An example
of this kind of application is shown in Fig. 10. This compares the 14C
concentration in the rings of a dendrochronologically-dated specimen of Triplochiton scleroxylon from Cameroon and an atmospheric
14
C record from the Southern Hemisphere. The good agreement
between the two data sets indicates that T. scleroxylon has produced
annual rings for the past 50 years (Worbes et al., 2003). If the
annual nature of growth rings is validated for the bomb period, it
may be reasonably assumed that this is also true for earlier times
(Menezes et al., 2003).
Bomb 14C is also a useful tool to complement the standard
techniques of dendrochronology in species in which annual rings
are not always clearly defined. Hua et al. (2003) determined the 14C
content of 27 consecutive annual rings of a section of Pinus radiata
(DRF 021) from Armidale, northern New South Wales, Australia.
Some 14C values of single rings from DRF 021 (based on ring counts)
were not in agreement with atmospheric 14C records at similar
latitudes, suggesting the possibility of two false rings and thus two
mis-identified rings in the preliminary count for this section. This
possibility was supported by a better ring-width correlation
between the revised DFR 021 count and other P. radiata chronologies in the study region.
For the pre-bomb period, precise dating of single tree rings is
problematic because of the large fluctuations in atmospheric 14C
over the past few hundred years (see Section 3.1). The 14C wigglematching method has successfully been used to date precisely
Holocene floating tree-ring sequences that cannot be cross-dated
Fig. 8. Age–depth modelling of peat core Mauntschass-03 from southeast Switzerland
showing the effect of the increase in the density of 14C dating (Goslar et al., 2005). The
probability distributions of the calibrated ages of individual samples down the
sequence are shown with grey silhouettes. The small rectangle in the upper right-hand
corner of each figure represents the date of collection of the section (depth ¼ 0 cm).
The arrow in the lower left-hand corner of each figure represents the depth of a sample
whose calendar age lies beyond the range of the diagram. The smooth lines passing
through the maxima of the probability distributions represent the most probable age–
depth curves. The dashed lines represent the uncertainties of each age–depth model.
The vertical bars on the right-hand side show changes in peat accumulation rate, as
inferred from the lithology of the sequence. Stage 1 (top panel): seven samples were
dated. These yielded two possible age–depth curves. Stage 2 (middle panel): 10
samples were dated. These produced a single age–depth curve. Stage 3 (bottom panel):
12 samples were dated. These generated an age–depth model with much lower
uncertainty.
�386
a
Q. Hua / Quaternary Geochronology 4 (2009) 378–390
different periods: AD 100–250 (a plateau in the calibration curve),
AD 900–1100 (a part of the calibration curve characterised by
a steep decrease in 14C age) and 1750–1650 BC (a portion of the
calibration curve dominated by large wiggles). They reported that
5–10 radiocarbon dates on 10-ring samples at precisions of 25–30
14
C years were sufficient to achieve a precision of less than 25 years
(95% confidence level) for the wiggle-matching method. This
method may therefore be applied to the precise dating of tree rings
for the pre-bomb period.
0
20
Depth (cm)
40
60
80
100
120
140
Wood fragments
Fine organic debris
Twigs
160
180
0.8
1.0
1.2
1.4
1.6
4.4. Estimation of the ages of marine samples
1.8
Fraction modern carbon (F)
0
2000
1990
1980
1970
1960
1950
20
Depth (cm)
40
Year (AD)
b
60
80
100
120
140
Core 3 twigs
Core 4 twigs
Tree rings
160
180
0.8
1.0
1.2
1.4
1.6
1.8
Fraction modern carbon (F)
Fig. 9. (a) The downcore variation in the 14C concentration in wood fragments, fine
organic debris and twigs from Core 3, Sky Lake, Mississippi, USA. (b) The 14C
concentration in twigs from Cores 3 and 4, Sky Lake, Mississippi, USA compared with
that in nearby tree rings of known age. The error bars (1s) associated with the 14C data
are equal to or smaller than the size of the data symbols (Davidson et al., 2004).
by standard dendrochronological techniques (van der Plicht et al.,
1995; Kromer et al., 2001; Barbetti et al., 2004; Galimberti et al.,
2004; Kuzmin et al., 2004; Nakamura et al., 2007). Dating precision
using the 14C wiggle-matching method depends upon the shape of
the radiocarbon calibration curve at the period concerned, the
number of 14C dates available and the precisions associated with
the 14C dates. Galimberti et al. (2004) investigated cases at three
When atmospheric 14C concentration increased in the mid1950s as a result of atmospheric nuclear weapon tests, 14C levels in
the surface ocean also increased. This is because excess radiocarbon
from the atmosphere was incorporated in the upper ocean by the
air-sea exchange of CO2. However, the distribution of bomb 14C in
the surface ocean differs from the simple zonal distribution of
atmospheric 14C illustrated in Fig. 6. This is because levels of 14C in
the surface ocean are mainly controlled by local and regional
patterns of ocean circulation. These include horizontal advection
and vertical movements such as ocean upwelling (Druffel, 1997;
Gagan et al., 2000; Hua et al., 2005; Grottoli and Eakin, 2007). The
latter process may bring 14C-depleted waters from the deeper
ocean to the surface, producing areas of lower surface ocean 14C
levels. As a result, 14C levels in the surface ocean have local and
regional characteristics such as those depicted in Fig. 11 for the
Pacific Ocean. In addition, due to the dampening effect of the
oceans, the magnitude of increases in 14C in the surface ocean after
the mid-1950s was much smaller than that in the atmosphere (the
surface waters of the Pacific Ocean experienced an increase of
w0.12 to 0.24 F from pre-bomb to maximum bomb values (Fig. 11)
compared with an increase of w0.6 to 2 F in the troposphere
(Fig. 6)). Surface ocean 14C also increased more slowly than atmospheric 14C, with the oceanic 14C reaching its maximum w10 years
later than atmospheric 14C (Druffel and Suess, 1983; Nydal and
Gislefoss, 1996). This occurred because excess 14C in the atmosphere after the atmospheric 14C bomb peak (AD 1963–1965)
continued to be transferred to the oceans. These issues lead to
difficulties in accurately dating marine samples using bomb 14C.
Nevertheless, bomb 14C may be used to estimate the ages of marine
1.18
Fraction modern carbon (F)
Fraction modern carbon (F)
1.8
Wellington, New Zealand 42°S, 175°E
Triplochiton scleroxylon
1.6
1.4
1.2
1.10
1.06
1.02
1960
1970
1980
1990
2000
Year (AD)
Fig. 10. The 14C concentration of ring-count dated growth rings of Triplochiton scleroxylon from Cameroon (Worbes et al., 2003) plotted on the atmospheric 14C curve
from Wellington, New Zealand for the period AD 1957–1992 (Manning and Melhuish,
1994).
Okinawa 26°N, 128°E
Hawaiian Is. 24°N, 166°W
Tarawa 1°N, 172°E
Panama 8°N, 82°W
Fiji 18°S, 179°E
Heron Is. 23°S, 152°E
0.98
0.94
0.90
1950
1.0
1950
1.14
1955
1960
1965
1970
1975
1980
1985
Year (AD)
Fig. 11. The concentration of 14C in the surface waters of the Pacific Ocean for the
period AD 1950–1984 recorded in corals. The data are from Konishi et al. (1982) for
Okinawa, Druffel (1987) and Druffel et al. (2001) for Hawaii and Panama, Toggweiler
et al. (1991) for Tarawa and Fiji, and Druffel and Griffin (1995) for Heron Island. The
error bars are 1s. The chronologies of these corals are based on counting growth bands
backwards from the dates of collection.
�387
Q. Hua / Quaternary Geochronology 4 (2009) 378–390
4.5. Time markers for speleothems
Time series of 14C in modern speleothems have been reported by
Genty et al. (1998) and Genty and Massault (1999). The authors
used annually laminated stalagmites from two caves in Belgium
and France for 14C measurements. Their results are illustrated in
Fig. 13. The two records show a clear increase in 14C resulting from
Fraction modern carbon (F)
1.15
1.10
1.05
1.00
0.95
Pagrus auratus ototliths, New Zealand
Centroberyx affinis otoliths, NSW, Australia
0.90
1945
1955
1965
1975
1985
1.16
Fraction modern carbon (F)
materials formed after AD 1960. Such estimates are most reliable
for materials formed in the period from c. AD 1960 to the mid1970s, when there was a significant increase in surface ocean 14C.
Kalish (1995) and Kalish et al. (1996) measured the 14C content
of fish otoliths and used a ‘regional’ surface ocean 14C bomb curve
to estimate fish birth dates and consequently fish ages. An example
of this approach is shown in Fig. 12. The birth dates of specimens of
Centroberyx affinis caught off the coast of New South Wales
(Australia) were first established by counting annual increments
visible in otolith thin sections. These dates were then checked by
comparing the 14C content of the first annual otolith increment
with a surface ocean 14C bomb curve. The curve was constructed
from 14C values measured in otoliths of known age from the species
Pagrus auratus taken off the coast of New Zealand, on the
assumption that the 14C levels of surface waters in the two regions
were similar. Kalish (1995) reported that 13 out of 16 presumed
birth dates for C. affinis fell within the 95% confidence limits of the
‘bomb-14C calibration curves’ based on the New Zealand P. auratus
data. This method has also been successfully applied to validate
shark ages by analysing 14C in growth bands of shark vertebrae
(Campana et al., 2002; Ardizzone et al., 2006).
Another application of this dating method was reported by
Frantz et al. (2000). They estimated growth rates for the rhodolith
Lithothamnium crassiusculum, a free-living calcareous red alga from
the southern Gulf of California, by measuring a dense series of
samples from the rhodolith for 14C and matching them with
a surface ocean 14C bomb curve for the Galapagos, which is located
not far from the southern Gulf of California. Using this method the
authors reported an average growth rate of 0.6 mm a�1 for the
rhodolith, suggesting that large L. crassiusculum with radii in excess
of 6 cm may live over 100 years. As rhodoliths occupy extensive
areas of the world’s oceans, ranging from polar deeps to tropical
shallows, they may have the potential to provide proxies for past
ocean conditions (Frantz et al., 2000).
Han-stm5, Han-sur-Lesse cave
Fau-stm14, La Faurie
1.12
1.08
1.04
1.00
0.96
0.92
0.88
1940
1950
1960
1970
1980
1990
2000
Year (AD)
Fig. 13. The pattern of bomb 14C in annually laminated stalagmites from the caves of
Han-sur-Lesse, Belgium (Genty et al., 1998) and La Faurie, France (Genty and Massault,
1999). The stalagmites were dated by counting annual layers (represented by a couplet
composed of a white porous lamination and a dark compact lamination). The horizontal error bars encompass the one to two years of laminae sampled for each 14C
analysis. The vertical error bars associated with the 14C data are 1s.
the input of excess 14C from atmospheric nuclear bomb tests.
However, the magnitude of the increase is smaller than that found
in the atmosphere and differs between the two cave systems.
Possible sources of the carbon in speleothems include (1) limestone
carbon containing no measurable 14C and (2) soil CO2 derived from
plant root respiration, whose 14C concentration is similar to that of
the atmosphere, and from organic matter decomposition with
a turnover time varying from decades to thousands of years (Genty
et al., 1998). The maximum value of bomb 14C in a particular speleothem is therefore dependent on the contribution of dead carbon
from limestone, and on the proportion and 14C content of soil
organic matter incorporated into the speleothem. To quantify the
total dead carbon in a speleothem from the two sources, the Dead
Carbon Fraction (DCF) is usually calculated:
DCF ¼
�
�
Fspel
1�
Fatm
(4)
where Fspel and Fatm are the measured 14C concentration in a speleothem and the contemporaneous atmospheric 14C concentration
respectively, both expressed as fraction modern carbon. The higher
the DCF, the lower the maximum value of bomb 14C found in the
speleothem.
Although the bomb 14C profiles in the speleothems show
different maxima in the two cave systems (Fig. 13), the timing of
their onset is no more than 1–2 years after the start of the rise in
atmospheric 14C in 1955 (Genty and Massault, 1999). This feature
can be used as a time marker for modern speleothems, especially
when they cannot be precisely dated by the Th/U method due to
low uranium concentration (<1 mg g�1) and insufficient 230Th. This
method has successfully been applied to help to build chronologies
for young speleothems from Gibraltar (Mattey et al., 2008) and
from New South Wales in Australia (Hodge et al., 2007).
1995
Birthdate (Year AD)
Fig. 12. The 14C concentrations of the first annual increment of Centroberyx affinis
otoliths from New South Wales, Australia plotted against their otolith-count derived
birth dates (Kalish, 1995). These are compared with the 14C concentrations of Pagrus
auratus otoliths of known age from New Zealand (Kalish, 1993). The horizontal error
bars associated with the presumed birth dates are 1s. The vertical error bars associated
with the 14C data are 1s.
5. Summary
Over the last few hundred years, atmospheric 14C has been
characterised by large fluctuations caused by variations in solar
activity (the Spörer, Maunder and Dalton minima, for example) and
climatic changes (such as those of the Little Ice Age). The injection
of 14C-free anthropogenic CO2 into the atmosphere since the
�388
Q. Hua / Quaternary Geochronology 4 (2009) 378–390
Industrial Revolution and the dramatic increase in atmospheric 14C
due to atmospheric nuclear detonations starting in AD 1955 have
also had massive impacts on 14C levels. The large fluctuations in
atmospheric 14C that took place before the onset of bomb 14C mean
that a single 14C date may possess several possible calibrated age
ranges, making the 14C dating method imprecise for that period.
This problem may be overcome by measuring a series of 14C dates
from a sequence and locating their most likely positions on a calibration curve using either the 14C wiggle-matching method or
additional information on dated materials and their surrounding
environment. For the period from 1955 onwards, atmospheric 14C
levels differ significantly from year to year, offering the possibility
of dating modern terrestrial samples with a resolution of from one
to a few years.
The method of analysing a series of 14C dates from a sequence
has been successfully applied to the precise dating of recent peat
profiles. The most reliable components of the peats for dating are
the leaves and twigs of Sphagnum. However, recent peats from
regions close to industrial activity may not be suitable for radiocarbon dating as spheroidal carbonaceous particles from industrial
sources attached to Sphagnum leaves may not be completely
removed during sample pretreatment (Charman and Garnett,
2005). The method of analysing multiple 14C dates from a sequence
has also been used for dating recent lake and salt marsh sediments
from the pre- and post-bomb periods. Accurate radiocarbon dating
of such sediments is not simple due to the presence of organic and
inorganic carbon from various sources (McGeehin et al., 2004). The
most reliable materials for dating young sediments are short-lived
macrofossils of local species, such as small twigs and grass stems
(Davidson et al., 2004; Marshall et al., 2007). Direct dating of lake
and salt marsh sediments is still problematic because of reservoir
effects (McGeehin et al., 2004). Given the potentially complex array
of carbon found in modern organic and inorganic sediments, it is
helpful if alternative dating methods such as 137Cs, 210Pb and 241Am
are used to corroborate the 14C chronologies (Gallagher et al., 2001;
Davidson et al., 2004; McGeehin et al., 2004; Turetsky et al., 2004;
Marshall et al., 2007).
Bomb 14C has successfully been used to validate the annual
nature of distinct growth zones or rings of some species of tropical
and temperate trees and mangroves (Worbes and Junk, 1989;
Fichtler et al., 2003; Menezes et al., 2003; Biondi et al., 2007). This
provides a useful complement to the standard techniques of
dendrochronology in species where annual rings are not always
clearly defined (Hua et al., 2003). Precise dating of tree rings for the
pre-bomb period may be achieved by obtaining a series of 14C dates
and applying the wiggle-matching method. Bomb 14C has also been
used to estimate the ages of modern marine materials. It has been
employed, for example, to verify fish birth dates (Kalish, 1995;
Kalish et al., 1996; Campana et al., 2002; Ardizzone et al., 2006) and
to determine the growth rates of young rhodoliths (Frantz et al.,
2000). For young speleothems, which cannot be precisely dated by
the Th/U method due to low uranium concentration (<1 mg g�1)
and insufficient 230Th, the timing of the onset of bomb 14C may be
used as a time marker (Hodge et al., 2007; Mattey et al., 2008). In
addition, if the DCF of a speleothem is almost constant over time,
which can be indicated by its d13C values (Genty et al., 2001),
a series of 14C dates from a sequence can potentially be employed to
construct a reasonable age–depth model for the speleothem for the
pre-bomb period.
Acknowledgements
The author would like to thank Dan Yeloff and Tomasz Goslar for
their generous provision of Figs 7 and 8 respectively. Stephen Gale
and two anonymous reviewers provided critical and constructive
comments, which greatly improved the manuscript.
Editorial handling by: S.J. Gale
References
Anchukaitis, K.J., Evans, M.N., Lange, T., Smith, D.R., Leavitt, S.W., Schrag, D.P., 2008.
Consequences of a rapid cellulose extraction technique for oxygen isotope and
radiocarbon analyses. Analytical Chemistry 80, 2035–2041.
Anon., 2008. List of laboratories. Radiocarbon 50, 479–503.
Ardizzone, D., Cailliet, G.M., Natanson, L.J., Andrews, A.H., Kerr, L.A., Brown, T.A.,
2006. Application of bomb radiocarbon chronologies to shortfin mako (Isurus
oxyrinchus) age validation. Environmental Biology of Fishes 77, 355–366.
Barbetti, M., Hua, Q., Zoppi, U., Fink, D., Zhao, Y., Thomson, B., 2004. Radiocarbon
variations from the southern hemisphere, 10,350–9700 cal BP. Nuclear Instruments and Methods in Physics Research B 223–224, 366–370.
Bard, E., Raisbeck, G.M., Yiou, F., Jouzel, J., 1997. Solar modulation of cosmogenic
nuclide production over the last millennium: comparison between 14C and 10Be
records. Earth and Planetary Science Letters 150, 453–462.
Beck, J.W., Richards, D.A., Edwards, R.L., Silverman, B.W., Smart, P.L., Donahue, D.J.,
Hererra-Osterheld, S., Burr, G.S., Calsoyas, L., Jull, A.J.T., Biddulph, D., 2001.
Extremely large variations of atmospheric 14C concentration during the last
glacial period. Science 292, 2453–2458.
Bhardwaj, R.D., Curtis, M.A., Spalding, K.L., Buchholz, B.A., Fink, D., Björk-Eriksson, T.,
Nordborg, C., Gage, F.H., Druid, H., Eriksson, P.S., Frisén, J., 2006. Neocortical
neurogenesis in humans is restricted to development. Proceedings of the
National Academy of Sciences of the United States of America 103, 12 564–
12 568.
Biondi, F., Strachan, S.D.J., Mensing, S., Piovesan, G., 2007. Radiocarbon analysis
confirms the annual nature of sagebrush growth rings. Radiocarbon 49, 1231–
1240.
Blaauw, M., Christen, J.A., 2005. Radiocarbon peat chronologies and environmental
change. Journal of the Royal Statistical Society Series C Applied Statistics 54,
805–816.
Blaauw, M., Heuvelink, G.B.M., Mauquoy, D., van der Plicht, J., van Geel, B., 2003. A
numerical approach to 14C wiggle-match dating of organic deposits: best fits
and confidence intervals. Quaternary Science Reviews 22, 1485–1500.
Bondevik, S., Mangerud, J., Birks, H.H., Gulliksen, S., Reimer, P., 2006. Changes in
North Atlantic radiocarbon reservoir ages during the Allerød and Younger
Dryas. Science 312, 1514–1517.
Broecker, W.S., 1997. Thermohaline circulation, the Achilles Heel of our climate
system: will man-made CO2 upset the current balance? Science 278, 1582–
1588.
Broecker, W.S., 2000. Was a change in thermohaline circulation responsible for the
Little Ice Age? Proceedings of the National Academy of Sciences of the United
States of America 97, 1339–1342.
Broecker, W.S., Klas, M., Clark, E., Trumbore, S., Bonani, G., Wölfli, W., Ivy, S., 1990.
Accelerator mass spectrometric radiocarbon measurements on foraminifera
shells from deep-sea cores. Radiocarbon 32, 119–133.
Broecker, W.S., Sutherland, S., Peng, T.-H., 1999. A possible 20th-century slowdown
of Southern Ocean deep water formation. Science 286, 1132–1135.
Bronk Ramsey, C., 2001. Development of the radiocarbon program. Radiocarbon 43,
355–363.
Bronk Ramsey, C., van der Plitch, J., Weninger, B., 2001. ‘Wiggle matching’ radiocarbon dates. Radiocarbon 43, 381–389.
Brown, T.A., Farwell, G.W., Grootes, P.M., Schmidt, F.H., 1992. Radiocarbon AMS
dating of pollen extracted from peat samples. Radiocarbon 34, 550–556.
Brown, T.A., Nelson, D.E., Mathewes, R.W., Vogel, J.S., Southon, J.R., 1989. Radiocarbon dating of pollen by accelerator mass spectrometry. Quaternary Research
32, 205–212.
Buck, C.E., Christen, J.A., James, G.N., 1999. BCal: an on-line Bayesian radiocarbon
calibration tool. Internet Archaeology 7. http://intarch.ac.uk/journal/issue7/
buck.
Campana, S.E., Natanson, L.J., Myklevoll, S., 2002. Bomb dating and age determination of large pelagic sharks. Canadian Journal of Fisheries and Aquatic
Sciences 59, 450–455.
Cao, L., Fairbanks, R.G., Mortlock, R.A., Risk, M.J., 2007. Radiocarbon reservoir age of
high latitude North Atlantic surface water during the last deglacial. Quaternary
Science Reviews 26, 732–742.
Charman, D.J., Garnett, M.H., 2005. Chronologies for recent peat deposits using
wiggle-matched radiocarbon ages: problems with old carbon contamination.
Radiocarbon 47, 135–145.
Clark, P.U., Pisias, N.G., Stocker, T.F., Weaver, A.J., 2002. The role of the thermohaline
circulation in abrupt climate change. Nature 415, 863–869.
Colman, S.M., King, J.W., Jones, G.A., Reynolds, R.L., Bothner, M.H., 2000. Holocene
and recent sediment accumulation rates in southern Lake Michigan. Quaternary
Science Reviews 19, 1563–1580.
Craig, H., 1954. Carbon 13 in plants and the relationships between carbon 13 and
carbon 14 variations in nature. The Journal of Geology 62, 115–149.
Damon, P.E., Sonett, C.P., 1991. Solar and terrestrial components of the atmospheric
14
C variation spectrum. In: Sonett, C.P., Giampapa, M.S., Matthews, M.S. (Eds.),
The Sun in Time. University of Arizona Press, Tucson, pp. 360–388.
�Q. Hua / Quaternary Geochronology 4 (2009) 378–390
Davidson, G.R., Carnley, M., Lange, T., Galicki, S.J., Douglas, A., 2004. Changes in
sediment accumulation rate in an oxbow lake following late 19th century
clearing of land for agricultural use: a 210Pb, 137Cs, and 14C study in Mississippi,
USA. Radiocarbon 46, 755–764.
Deevey, E.S., Gross, M.S., Hutchinson, G.E., Kraybill, H.L., 1954. The natural C14
contents of materials from hard-water lakes. Proceedings of the National
Academy of Sciences of the United States of America 40, 285–288.
Donahue, D.J., Linick, T.W., Jull, A.J.T., 1990. Isotope-ratio and background corrections for accelerator mass spectrometry radiocarbon measurement. Radiocarbon 32, 135–142.
Donders, T.H., Wagner, F., van der Borg, K., de Jong, A.F.M., Visscher, H., 2004. A
novel approach for developing high-resolution sub-fossil peat chronologies
with 14C dating. Radiocarbon 46, 455–463.
Druffel, E.R.M., 1987. Bomb radiocarbon in the Pacific: annual and seasonal timescale variations. Journal of Marine Research 45, 667–698.
Druffel, E.R.M., 1997. Geochemistry of corals: proxies of past ocean chemistry, ocean
circulation, and climate. Proceedings of the National Academy of Sciences of the
United States of America 94, 8354–8361.
Druffel, E.R.M., Griffin, S., 1995. Regional variability of surface ocean radiocarbon
from southern Great Barrier Reef corals. Radiocarbon 37, 517–524.
Druffel, E.R.M., Suess, H.E., 1983. On the radiocarbon record in banded corals:
exchange parameters and net transport of 14CO2 between atmosphere and
surface ocean. Journal of Geophysical Research 88, 1271–1280.
Druffel, E.R.M., Griffin, S., Guilderson, T.P., Kashgarian, M., Southon, J.R., Schrag, D.P.,
2001. Changes of subtropical North Pacific radiocarbon and correlation with
climate variability. Radiocarbon 43, 15–25.
Fairbanks, R.G., Mortlock, R.A., Chiu, T.-C., Cao, L., Kaplan, A., Guilderson, T.P.,
Fairbanks, T.W., Bloom, A.L., Grootes, P.M., Nadeau, M.-J., 2005. Radiocarbon
calibration curve spanning 0 to 50,000 years BP based on paired
230
Th/234U/238U and 14C dates on pristine corals. Quaternary Science Reviews
24, 1781–1796.
Fichtler, E., Clark, D.A., Worbes, M., 2003. Age and long-term growth of trees in an
old-growth tropical rain forest, based on analyses of tree rings and 14C. Biotropica 35, 306–317.
Frantz, B.R., Kashgarian, M., Coale, K.H., Foster, M.S., 2000. Growth rate and
potential climate record from a rhodolith using 14C accelerator mass spectrometry. Limnology and Oceanography 45, 1773–1777.
Gagan, M.K., Ayliffe, L.K., Beck, J.W., Cole, J.E., Druffel, E.R.M., Dunbar, R.B.,
Schrag, D.P., 2000. New views of tropical paleoclimates from corals. Quaternary
Science Reviews 19, 45–64.
Gäggeler, H.W., 1995. Radioactivity in the atmosphere. Radiochimica Acta 70/71,
345–353.
Galimberti, M., Bronk Ramsey, C., Manning, S.W., 2004. Wiggle-match dating of
tree-ring sequences. Radiocarbon 46, 917–924.
Gallagher, D., McGee, E.J., Mitchell, P.I., 2001. A recent history of 14C, 137Cs, 210Pb, and
241
Am accumulation at two Irish peat bog sites: an east versus west coast
comparison. Radiocarbon 43, 517–525.
Genty, D., Massault, M., 1999. Carbon transfer dynamics from bomb-14C and d13C
time series of a laminated stalagmite from SW Francedmodelling and
comparison with other stalagmite records. Geochimica et Cosmochimica Acta
63, 1537–1548.
Genty, D., Baker, A., Massault, M., Proctor, C., Gilmour, M., Pons-Branchu, E.,
Hamelin, B., 2001. Dead carbon in stalagmites: carbonate bedrock paleodissolution vs. ageing of soil organic matter: implications for 13C variations in
speleothems. Geochimica et Cosmochimica Acta 65, 3443–3457.
Genty, D., Vokal, B., Obelic, B., Massault, M., 1998. Bomb 14C time history recorded in
two modern stalagmitesdimportance for soil organic matter dynamics and
bomb 14C distribution over continents. Earth and Planetary Science Letters 160,
795–809.
Geyh, M.A., 2005. 14C dating – still a challenge for users? Zeitschrift für Geomorphologie Supplement 139, 63–86.
Geyh, M.A., Schotterer, U., Grosjean, M., 1998. Temporal changes of the 14C reservoir
effect in lakes. Radiocarbon 40, 921–931.
Godwin, H., 1962. Half-life of radiocarbon. Nature 195, 984.
Goodsite, M.E., Rom, W., Heinemeier, J., Lange, T., Ooi, S., Appleby, P.G., Shotyk, W.,
van der Knapp, W.O., Lohse, C., Hansen, T.S., 2001. High-resolution AMS 14C
dating of post-bomb peat archives of atmospheric pollutants. Radiocarbon 43,
495–515.
Goslar, T., Arnold, M., Tisnerat-Laborde, N., Czernik, J., Wieckowski,
˛
K., 2000. Variations of Younger Dryas atmospheric radiocarbon explicable without ocean
circulation changes. Nature 403, 877–880.
Goslar, T., van der Knaap, W.O., Hicks, S., Andrič, M., Czernik, J., Goslar, E.,
Räsänen, S., Hyötylä, H., 2005. Radiocarbon dating of modern peat profiles: preand post-bomb 14C variations in the construction of age–depth models.
Radiocarbon 47, 115–134.
Grottoli, A.G., Eakin, C.M., 2007. A review of modern coral d18O and D14C proxy
records. Earth-Science Reviews 81, 67–91.
Head, M.J., 1979. Structure and Chemical Properties of Fresh and Degraded Wood:
Their Effects on Radiocarbon Activity Measurements. Unpublished M.Sc. Thesis,
Australian National University, Canberra.
Hedges, R.E.M., 1992. Sample treatment strategies in radiocarbon dating. In:
Taylor, R.E., Long, A., Kra, R.S. (Eds.), Radiocarbon After Four Decades: an
Interdisciplinary Perspective. Springer, New York, pp. 165–183.
Hedges, R.E.M., van Klinken, G.J., 1992. A review of current approaches in the
pretreatment of bone for radiocarbon dating by AMS. Radiocarbon 34, 279–291.
389
Hodge, E., McDonald, J., Treble, P.C., Levchenko, V.A., Drysdale, R.N., Waring, C.,
Hua, Q., Fischer, M.J., 2007. Radiocarbon bomb pulse chronologies for young
speleothems and implications for rainfall records in southeast Australia.
Quaternary International 167–168 (Suppl. 1), 170.
Hoefs, J., 1987. Stable Isotope Geochemistry, 3rd ed. Springer, Berlin, 241 pp.
Hoper, S.T., McCormac, F.G., Hogg, A.G., Higham, T.F.G., Head, M.J., 1998. Evaluation
of wood pretreatments on oak and cedar. Radiocarbon 40, 45–50.
Hua, Q., Barbetti, M., 2004. Review of tropospheric bomb 14C data for carbon cycle
modeling and age calibration purposes. Radiocarbon 46, 1273–1298.
Hua, Q., Barbetti, M., 2007. Influence of atmospheric circulation on regional 14CO2
differences. Journal of Geophysical Research 112, D19102, doi:10.1029/
2006JD007898.
Hua, Q., Barbetti, M., Worbes, M., Head, J., Levchenko, V.A., 1999. Review of
radiocarbon data from atmospheric and tree ring samples for the period 1945–
1997 AD. IAWA (International Association of Wood Anatomists) Journal 20,
261–283.
Hua, Q., Barbetti, M., Zoppi, U., Chapman, D.M., Thomson, B., 2003. Bomb radiocarbon in tree rings from northern New South Wales, Australia: implications for
dendrochronology, atmospheric transport, and air-sea exchange of CO2.
Radiocarbon 45, 431–447.
Hua, Q., Barbetti, M., Zoppi, U., Fink, D., Watanasak, M., Jacobsen, G.E., 2004a.
Radiocarbon in tropical tree rings during the Little Ice Age. Nuclear Instruments
and Methods in Physics Research B 223–224, 489–494.
Hua, Q., Woodroffe, C.D., Smithers, S.G., Barbetti, M., Fink, D., 2005. Radiocarbon in
corals from the Cocos (Keeling) Islands and implications for Indian Ocean
circulation. Geophysical Research Letters 32, L21602, doi:10.1029/
2005GL023882.
Hua, Q., Zoppi, U., Williams, A.A., Smith, A.M., 2004b. Small-mass AMS radiocarbon
analysis at ANTARES. Nuclear Instruments and Methods in Physics Research B
223–224, 284–292.
Hughen, K.A., Baillie, M.G.L., Bard, E., Bayliss, A., Beck, J.W., Bertrand, C.J.H.,
Blackwell, P.G., Buck, C.E., Burr, G.S., Cutler, K.B., Damon, P.E., Edwards, R.L.,
Fairbanks, R.G., Friedrich, M., Guilderson, T.P., Kromer, B., McCormac, F.G.,
Manning, S., Bronk Ramsey, C., Reimer, P.J., Reimer, R.W., Remmele, S.,
Southon, J.R., Stuiver, M., Talamo, S., Taylor, F.W., van der Plicht, J.,
Weyhenmeyer, C.E., 2004. Marine04 marine radiocarbon age calibration, 0–
26 cal kyr BP. Radiocarbon 46, 1059–1086.
Hughen, K.A., Southon, J.R., Lehman, S., Bertrand, C., Turnbull, J., 2006. Marinederived 14C calibration and activity record for the past 50,000 years updated
from the Cariaco Basin. Quaternary Science Reviews 25, 3216–3227.
Hughen, K.A., Southon, J.R., Lehman, S.J., Overpeck, J.T., 2000. Synchronous radiocarbon and climate shifts during the last deglaciation. Science 290, 1951–1954.
de Jong, A.F.M., Alderliesten, C., van der Borg, K., van der Veen, C., van de
Wal, R.S.W., 2004. Radiocarbon analysis of the EPICA Dome C ice core: no in situ
14
C from the firn observed. Nuclear Instruments and Methods in Physics
Research B 223–224, 516–520.
Jull, A.J.T., Burr, G.S., 2006. Accelerator mass spectrometry: is the future bigger or
smaller? Earth and Planetary Science Letters 243, 305–325.
Kalish, J.M., 1993. Pre- and post-bomb radiocarbon in fish otoliths. Earth and
Planetary Science Letters 114, 549–554.
Kalish, J.M., 1995. Application of the bomb radiocarbon chronometer to the validation of redfish Centroberyx affinis age. Canadian Journal of Fisheries and
Aquatic Sciences 52, 1399–1405.
Kalish, J.M., Johnston, J.M., Gunn, J.S., Clear, N.P., 1996. Use of the bomb radiocarbon
chronometer to determine age of southern bluefin tuna Thunnus maccoyii.
Marine Ecology Progress Series 143, 1–8.
Kitagawa, H., van der Plicht, J., 2000. Atmospheric radiocarbon calibration beyond
11,900 cal BP from Lake Suigetsu laminated sediments. Radiocarbon 42, 370–
381.
Konishi, K., Tanaka, T., Sakanoue, M., 1982. Secular variation of radiocarbon
concentration in seawater: sclerochronological approach. In: Gomez, E.D.,
Birkeland, C.E., Buddemeier, R.W., Johannes, R.E., Marsh, J.A., Tsuda, R.T. (Eds.),
Proceedings of the Fourth International Coral Reef Symposium, vol. 1. Marine
Sciences Center, University of the Philippines, Manila, pp. 181–185.
Kromer, B., Friedrich, M., Hughen, K.A., Kaiser, F., Remmele, S., Schaub, M.,
Talamo, S., 2004. Late Glacial 14C ages from a floating, 1382-ring pine chronology. Radiocarbon 46, 1203–1209.
Kromer, B., Manning, S.W., Kuniholm, P.I., Newton, M.W., Spurk, M., Levin, I., 2001.
Regional 14CO2 offsets in the troposphere: magnitude, mechanisms, and
consequences. Science 294, 2529–2532.
Kuzmin, Y.V., Slusarenko, I.Y., Hajdas, I., Bonani, G., Christen, J.A., 2004. The
comparison of 14C wiggle-matching results for the ‘floating’ tree-ring chronology of the Ulandryk-4 burial ground (Altai Mountains, Siberia). Radiocarbon
46, 943–948.
Libby, W.F., 1946. Atmospheric helium three and radiocarbon from cosmic radiation.
Physical Review 69, 671–672.
van der Linden, M., van Geel, B., 2006. Late Holocene climate change and human
impact recorded in a south Swedish ombrotrophic peat bog. Palaeogeography,
Palaeoclimatology, Palaeoecology 240, 649–667.
Longin, R., 1971. New method of collagen extraction for radiocarbon dating. Nature
230, 241–242.
Manning, M.R., Melhuish, W.H., 1994. Atmospheric d14C record from Wellington. In:
Boden, T.A., Kaiser, D.P., Sepanski, R.J., Stoss, F.W. (Eds.), Trends 93: a Compendium of Data on Global Change. Carbon Dioxide Information Analysis Center,
Oak Ridge National Laboratory, Oak Ridge, pp. 193–202.
�390
Q. Hua / Quaternary Geochronology 4 (2009) 378–390
Marland, G., Boden, T.A., Andres, R.J., 2008. Global, regional, and national CO2
emissions. In: Trends: a Compendium of Data on Global Change. Carbon
Dioxide Information Analysis Center, Oak Ridge National Laboratory, Oak Ridge.
http://cdiac.ornl.gov/trends/emis/tre_glob.html.
Marshall, W.A., Gehrels, W.R., Garnett, M.H., Freeman, S.P.H.T., Maden, C., Xu, S.,
2007. The use of ‘bomb spike’ calibration and high-precision AMS 14C analyses
to date salt-marsh sediments deposited during the past three centuries.
Quaternary Research 68, 325–337.
Mattey, D., Lowry, D., Duffet, J., Fisher, R., Hodge, E., Frisia, S., 2008. A 53 year
seasonally resolved oxygen and carbon isotope record from a modern Gibraltar
speleothem: reconstructed drip water and relationship to local precipitation.
Earth and Planetary Science Letters 269, 80–95.
Mauquoy, D., van Geel, B., Blaauw, M., van der Plicht, J., 2002. Evidence from
northwest European bogs shows ‘Little Ice Age’ climatic changes driven by
variations in solar activity. The Holocene 12, 1–6.
McCormac, F.G., Hogg, A.G., Higham, T.F.G., Lynch-Stieglitz, J., Broecker, W.S.,
Baillie, M.G.L., Palmer, J., Xiong, L., Pilcher, J.R., Brown, D., Hoper, S.T., 1998.
Temporal variation in the interhemispheric 14C offset. Geophysical Research
Letters 25, 1321–1324.
McCormac, F.G., Hogg, A.G., Blackwell, P.G., Buck, C.E., Higham, T.F.G., Reimer, P.J.,
2004. SHCal04 Southern Hemisphere calibration 0–11.0 cal kyr BP. Radiocarbon
46, 1087–1092.
McGeehin, J., Burr, G.S., Hodgins, G., Bennett, S.J., Robbins, J.A., Morehead, N.,
Markewich, H., 2004. Stepped-combustion 14C dating of bomb carbon in lake
sediment. Radiocarbon 46, 893–900.
McGregor, H.V., Gagan, M.K., McCulloch, M.T., Hodge, E., Mortimer, G., 2008. MidHolocene variability in the marine 14C reservoir age for northern coastal Papua
New Guinea. Quaternary Geochronology 3, 213–225.
McNichol, A.P., Jull, A.J.T., Burr, G.S., 2001. Converting AMS data to radiocarbon
values: considerations and conventions. Radiocarbon 43, 313–320.
Menezes, M., Berger, U., Worbes, M., 2003. Annual growth rings and long-term
growth patterns of mangrove trees from the Bragança peninsula, north Brazil.
Wetlands Ecology and Management 11, 233–242.
Mook, W.G., Streurman, H.J., 1983. Physical and chemical aspects of radiocarbon
dating. In: Mook, W.G., Waterbolk, H.T. (Eds.), Proceedings of the First International Symposium, 14C and Archaeology, 1981, Groningen. PACT (Journal of
the European Study Group on Physical, Chemical, Biological and Mathematical
Techniques Applied to Archaeology), vol. 8, pp. 31–55.
Nakamura, T., Okuno, M., Kimura, K., Mitsutani, T., Moriwaki, H., Ishizuka, Y.,
Kim, K.H., Jing, B.L., Oda, H., Minami, M., Takada, H., 2007. Application of 14C
wiggle-matching to support dendrochronological analysis in Japan. Tree-Ring
Research 63, 37–46.
Nydal, R., Gislefoss, J.S., 1996. Further application of bomb 14C as a tracer in the
atmosphere and ocean. Radiocarbon 38, 389–406.
Olsson, I.U., 1968. Modern aspects of radiocarbon datings. Earth-Science Reviews 4,
203–218.
Olsson, I.U., 1970. The use of oxalic acid as a standard. In: Olsson, I.U. (Ed.),
Radiocarbon Variations and Absolute Chronology. Almqvist & Wiksell, Stockholm and John Wiley, New York, p. 17.
Olsson, I.U., 1979. The importance of the pretreatment of wood and charcoal
samples. In: Berger, R., Suess, H.E. (Eds.), Radiocarbon Dating. University of
California Press, Berkeley, pp. 135–146.
Pearson, G.W., 1986. Precise calendrical dating of known growth-period samples
using a ‘curve fitting’ technique. Radiocarbon 28, 292–299.
Petrenko, V.V., Smith, A.M., Brailsford, G., Riedel, K., Hua, Q., Lowe, D.C.,
Severinghaus, J.P., Levchenko, V.A., Bromley, A., Moss, R., Mühle, J., Brook, E.J.,
2008. A new method for analyzing 14C of methane in ancient air extracted from
glacial ice. Radiocarbon 50, 53–73.
van der Plicht, J., 2002. Calibration of the 14C time scale: towards the complete
dating range. Netherlands Journal of Geosciences 81, 85–96.
van der Plicht, J., Beck, J.W., Bard, E., Baillie, M.G.L., Blackwell, P.G., Buck, C.E.,
Friedrich, M., Guilderson, T.P., Hughen, K.A., Kromer, B., McCormac, F.G., Bronk
Ramsey, C., Reimer, P.J., Reimer, R.W., Remmele, S., Richards, D.A., Southon, J.R.,
Stuiver, M., Weyhenmeyer, C.E., 2004. NotCal04dcomparison/calibration 14C
records 26–50 cal kyr BP. Radiocarbon 46, 1225–1238.
van der Plicht, J., Jansma, E., Kars, H., 1995. The ‘‘Amsterdam Castle’’: a case study of
wiggle matching and the proper calibration curve. Radiocarbon 37, 965–968.
Polach, H.A., 1979. Correlation of 14C activity of NBS oxalic acid with Arizona 1850
wood and ANU sucrose standards. In: Berger, R., Suess, H.E. (Eds.), Radiocarbon
Dating. University of California Press, Berkeley, pp. 115–124.
Reimer, P.J., Reimer, R.W., 2001. A marine reservoir correction database and on-line
interface. Radiocarbon 43, 461–463.
Reimer, P.J., Baillie, M.G.L., Bard, E., Bayliss, A., Beck, J.W., Bertrand, C.J.H.,
Blackwell, P.G., Buck, C.E., Burr, G.S., Cutler, K.B., Damon, P.E., Edwards, R.L.,
Fairbanks, R.G., Friedrich, M., Guilderson, T.P., Hogg, A.G., Hughen, K.A.,
Kromer, B., McCormac, F.G., Manning, S., Bronk Ramsey, C., Reimer, R.W.,
Remmele, S., Southon, J.R., Stuiver, M., Talamo, S., Taylor, F.W., van der Plicht, J.,
Weyhenmeyer, C.E., 2004b. IntCal04 terrestrial radiocarbon age calibration,
0–26 cal kyr BP. Radiocarbon 46, 1029–1058.
Reimer, P.J., Brown, T.A., Reimer, R.W., 2004a. Discussion: reporting and calibration
of post-bomb 14C data. Radiocarbon 46, 1299–1304.
Santos, G.M., Southon, J.R., Griffin, S., Beaupre, S.R., Druffel, E.R.M., 2007. Ultra
small-mass AMS 14C sample preparation and analyses at KCCAMS/UCI Facility.
Nuclear Instruments and Methods in Physics Research B 259, 293–302.
Sarnthein, M., Grootes, P.M., Kennett, J.P., Nadeau, M.-J., 2007. 14C reservoir ages show
deglacial changes in ocean currents and carbon cycle. In: Schmittner, A.,
Chiang, J.C.H., Hemming, S.R. (Eds.), Ocean Circulation: Mechanisms and
ImpactsdPast and Future Changes of Meridional Overturning. Geophysical
Monograph 173. American Geophysical Union, Washington, D.C., pp. 175–196.
Siani, G., Paterne, M., Michel, E., Sulpizio, R., Sbrana, A., Arnold, M., Haddad, G., 2001.
Mediterranean sea surface radiocarbon reservoir age changes since the Last
Glacial Maximum. Science 294, 1917–1920.
Sikes, E.L., Samson, C.R., Guilderson, T.P., Howard, W.R., 2000. Old radiocarbon ages
in the southwest Pacific Ocean during the last glacial period and deglaciation.
Nature 405, 555–559.
Smith, A.M., Petrenko, V.V., Hua, Q., Southon, J.R., Brailsford, G., 2007. The effect of
N2O, catalyst, and means of water vapor removal on the graphitization of small
CO2 samples. Radiocarbon 49, 245–254.
Spalding, K.L., Buchholz, B.A., Bergman, L.-E., Druid, H., Frisén, J., 2005. Age written
in teeth by nuclear tests. Nature 437, 333–334.
Stocker, T.F., Wright, D.G., 1996. Rapid changes in ocean circulation and atmospheric
radiocarbon. Paleoceanography 11, 773–795.
St-Onge, G., Stoner, J.S., Hillaire-Marcel, C., 2003. Holocene paleomagnetic records
from the St. Lawrence Estuary, eastern Canada: centennial-to millennial-scale
geomagnetic modulation of cosmogenic isotopes. Earth and Planetary Science
Letters 209, 113–130.
Stuiver, M., 1983. International agreements and the use of the new oxalic acid
standard. Radiocarbon 25, 793–795.
Stuiver, M., Braziunas, T.F., 1998. Anthropogenic and solar components of hemispheric 14C. Geophysical Research Letters 25, 329–332.
Stuiver, M., Polach, H.A., 1977. Discussion: reporting of 14C data. Radiocarbon 19,
355–363.
Stuiver, M., Quay, P.D., 1980. Changes in atmospheric carbon-14 attributed to
a variable sun. Science 207, 11–19.
Stuiver, M., Reimer, P.J., 1993. Extended 14C database and revised CALIB 3.0 14C age
calibration program. Radiocarbon 35, 215–230.
Stuiver, M., Pearson, G.W., Braziunas, T., 1986. Radiocarbon age calibration of marine
samples back to 9000 cal yr BP. Radiocarbon 28, 980–1021.
Suess, H.E., 1955. Radiocarbon concentration in modern wood. Science 122, 415–417.
Taylor, R.E., 1987. Radiocarbon Dating an Archaeological Perspective. Academic
Press, London, 212 pp.
Toggweiler, J.R., Dixon, K., Broecker, W.S., 1991. The Peru upwelling and the ventilation of the South Pacific thermocline. Journal of Geophysical Research 96,
20 467–20 497.
Tuniz, C., Bird, J.R., Fink, D., Herzog, G.F., 1998. Accelerator Mass Spectrometry:
Ultrasensitive Analysis for Global Science. CRC Press, Boca Raton, 371 pp.
Turetsky, M.R., Manning, S.W., Wieder, R.K., 2004. Dating recent peat deposits.
Wetlands 24, 324–356.
Wild, E., Golser, R., Hille, P., Kutschera, W., Priller, A., Puchegger, S., Rom, W.,
Steier, P., Vycudilik, W., 1998. First 14C results from archaeological and forensic
studies at the Vienna Environmental Research Accelerator. Radiocarbon 40,
273–281.
Woodroffe, C.D., McLean, R.F., Smithers, S.G., Lawson, E.M., 1999. Atoll reef-island
formation and response to sea-level change: West Island, Cocos (Keeling)
Islands. Marine Geology 160, 85–104.
Woodroffe, C.D., Samosorn, B., Hua, Q., Hart, D.E., 2007. Incremental accretion of
a sandy reef island over the past 3000 years indicated by component-specific
radiocarbon dating. Geophysical Research Letters 34, L03602, doi:10.1029/
2006GL028875.
Worbes, M., Junk, W.J., 1989. Dating tropical trees by means of 14C from bomb tests.
Ecology 70, 503–507.
Worbes, M., Staschel, R., Roloff, A., Junk, W.J., 2003. Tree ring analysis reveals age
structure, dynamics and wood production of a natural forest stand in
Cameroon. Forest Ecology and Management 173, 105–123.
Yeloff, D., Bennett, K.D., Blaauw, M., Mauquoy, D., Sillasoo, Ü., van der Plicht, J., van
Geel, B., 2006. High precision 14C dating of Holocene peat deposits: a comparison of Bayesian calibration and wiggle-matching approaches. Quaternary
Geochronology 1, 222–235.
Yu, K.-F., Zhao, J.-X., Hodge, E., Hua, Q., Barbetti, M.F., Fink, D., 2007. Paired U-series
and radiocarbon dating of Holocene corals from the South China Sea: evidence
for large temporal variability in 14C marine reservoir ages. Quaternary International 167–168 (Suppl. 1), 468.
Zoppi, U., Albani, A., Ammerman, A.J., Hua, Q., Lawson, E.M., Serandrei Barbero, R.,
2001. Preliminary estimate of the reservoir age in the Lagoon of Venice.
Radiocarbon 43, 489–494.
Zoppi, U., Skopec, Z., Skopec, J., Jones, G., Fink, D., Hua, Q., Jacobsen, G.E., Tuniz, C.,
Williams, A.A., 2004. Forensic applications of 14C bomb-pulse dating. Nuclear
Instruments and Methods in Physics Research B 223–224, 770–775.
�
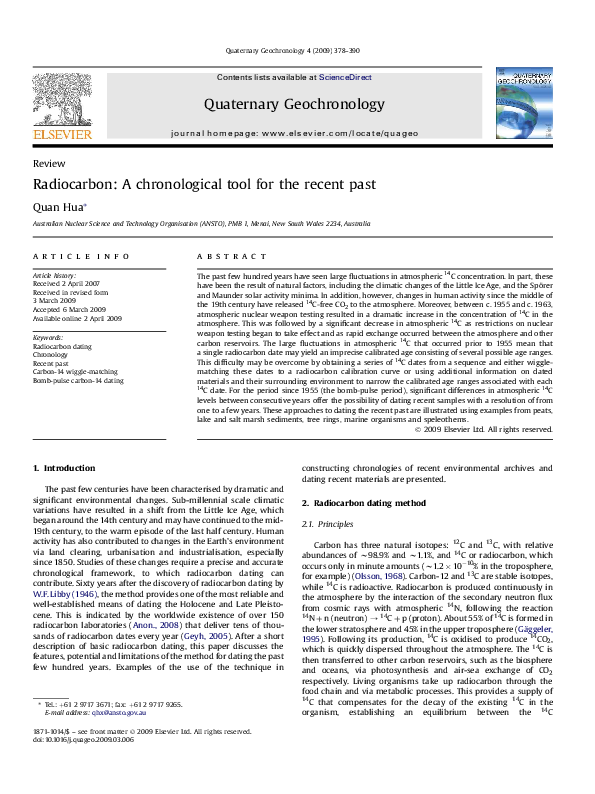
 Quan Hua