J. LIQ. CHROM. & REL. TECHNOL., 24(3), 401–414 (2001)
VALIDATION OF A SOLID PHASE
EXTRACTION PROCEDURE
FOR THE GC-MS IDENTIFICATION
AND QUANTITATION OF COCAINE
AND THREE METABOLITES IN BLOOD,
URINE, AND MILK
Imad K. Abukhalaf,1,2,∗ Bryan A. Parks,1
Natalia A. Silvestrov,1 Daniel A. von Deutsch,3
Ashraf Mozayani,3 and Hassan Y. Aboul-Enein4
1
2
Department of Pharmacology & Toxicology and the
Clinical Research Center, Morehouse School of Medicine,
Atlanta, GA 30310, USA
3
Joseph A. Jachymczyk Forensic Center, Houston,
TX 77033, USA
4
Pharmaceutical Analysis Laboratory, Biological and
Medical Research Department (MBC-03)
King Faisal Specialist Hospital and Research Centre,
Riyadh, Saudi Arabia
ABSTRACT
A simple and widely used solid-phase extraction procedure
(United Chemical Technologies Method Handbook) was applied
for the GC-MS identification and quantitation of cocaine (COC),
benzoylecgonine (BE), cocaethylene (COCE), and m-hydroxybenzoylecgonine (HBE) in blood, urine, and milk. The method
401
C 2001 by Marcel Dekker, Inc.
Copyright
www.dekker.com
402
ABUKHALAF ET AL.
which utilizes BSTFA as a derivatizing agent yielded abundant
diagnostic ions with high m/z values.
Linear quantitative response curves were generated for the
analytes of interest over a concentration range of 5–1000 ng/mL.
Linear regression analyses of the standard curve in the three specimen types exhibited correlation coefficients ranging from 0.997 to
1.000. The LOD values for COC, COCE, and derivatives of BE,
and HBE in the three specimen types ranged from 2.5 to 5.0 ng/mL.
The LOQ values, however, ranged from 5.0 to 10.0 ng/mL.
Intra-assay and inter-assay precision studies reflected a high level
of reliability and reproducibility of the method. The applicability of
the method for the detection and quantitation of COC, BE, COCE,
and HBE was demonstrated successfully in human blood and urine
samples, as well as blood samples obtained from cocaine-treated
(subcutaneously) rats.
INTRODUCTION
Cocaine (COC) is one of the most potent of the naturally-occurring central
nervous system stimulants. It has been widely utilized in medicine as a local
anesthetic (especially in opthalmological procedures) and increasingly by drug
abusers for its stimulant properties. During the 1980s and 90s, cocaine abuse
increased to epidemic proportions across the United States, and continues to be a
major public concern.
Cocaine is rapidly metabolized in man by the hydrolysis of one or both of its
ester linkages. At slightly basic pH, the drug is readily hydrolyzed to its primary
metabolite benzoylecgonine (BE) (1–6). BE, in turn, is converted to ecgonine (E)
by enzymatic hydrolysis, to m-hydroxybenzoylecgonine (HBE) by hydroxylation,
and to benzoylnorecgonine (BNE) by N-methylation (1–6). In blood, cocaine is
also hydrolyzed to ecgonine methyl ester (EME) by cholinesterase (1–6). Cocaethylene (COCE) is a neurologically active compound that provides the same
degree of euphoria as COC, but for longer periods of time (7).
As reported by Hearn et al. (8) and others (9,10), COCE is a unique metabolite that occurs in blood as a result of concurrent use of cocaine and ethanol. Varying
amounts of other metabolic products of cocaine, such as the active metabolite norcocaine (NCOC), and meta- hydroxycocaine (HCOC) have also been detected
(11).
Because of the adverse health consequences and legal implications of cocaine
abuse, it has become increasingly more important for analytical toxicologists to
continue to improve upon the methods for the detection and quantitation of cocaine
and its metabolites in biological specimens, to provide evidence of cocaine use
COCAINE AND THREE METABOLITES
403
and abuse. A number of methods for the detection and quantitation of cocaine in
blood, urine, meconium, and hair, are documented in the literature.
These methods range from thin layer chromatography (TLC) to high performance liquid chromatography (HPLC) and gas chromatography-mass spectrometry (GC-MS) (12–19). The Gas Chromatograph-Mass Spectrometer is readily
available in most pharmaceutical and toxicology laboratories, and its main advantage over other instrumentation used in the laboratories, is that it provides
appropriate sensitivity, specificity, and selectivity for the analytes of interest.
This manuscript describes the validation and applicability of a simple and
widely used solid-phase extraction procedure (20) for the extraction and GC-MS
quantitation of COC, BE, HBE, and COCE in blood, urine, and milk, utilizing only
one milliliter of sample. The applicability of the method to quantitate COC, BE,
HBE, and COCE was demonstrated successfully in human whole blood specimens,
human urine samples, as well as blood samples obtained from rats treated with
cocaine subcutaneously.
To our knowledge, this manuscript is the first to describe method parameters
and validation for testing COC, BE, HBE, and COCE in milk specimens.
EXPERIMENTAL
Materials
The COC, BE, HBE, and COCE standard materials and deuterated analogs
were purchased from Radian Corporation (Austin, TX). Clean Screen extraction columns were purchased from World Wide Monitoring (Bristol, PA). bis
(Trimethylsilyl) trifluoroacetamide, containing 1% trimethylchlorosilane, was purchased from Pierce Chemical Company (Rockford, IL). Monobasic and dibasic
potassium phosphate, hydrochloric acid, methanol, dichloromethane, isopropanol,
ammonium hydroxide, and ethyl acetate were purchased from Fisher Scientific
(Suwanee, GA) and were of analytical grade or the highest purity available.
Autosampler vials (12 × 32 mm; clear crimp-top) with 100 µL limited
volume inserts were purchased from Alltech Associates Inc. (Deerfield, IL). Water
used in this study met Type II water criteria (21) and was filtered through Nanopure
System (Barnstead, Dubuque, IA).
Methods
Extraction and Derivatization
Extraction and derivatization procedures were conducted essentially as
described (20). Samples (1 mL) were spiked with 50 ng of deuterated (D3 ) internal
404
ABUKHALAF ET AL.
standards, corresponding to the analytes of interest. Then, 4 mL of deionized water
were added, and blood samples were centrifuged at 2000 rpm for 10 min. Pellets
were discarded and 2 mL of 100 mM potassium phosphate buffer was added to all
specimen types and the pH was adjusted to 6–6.5.
The samples were then loaded on the extraction columns which had been
pre-equilibrated by sequential treatment with 2 mL of methanol, 2 mL of deionized
water, and 3 mL of 100 mM potassium phosphate buffer. After the samples passed
through the bed of the columns, the columns were sequentially washed with 2 mL
deionized water, 2 mL of 100 mM HCl, and 3 mL of methanol.
COC, BE, HBE, and COCE were eluted with 3 mL of freshly prepared elution
mixture composed of dichloromethane, isopropyl alcohol, and ammonium hydroxide (78/20/2,v/v/v). Eluates were dried at room temperature under a continuous
stream of nitrogen. To ensure complete removal of water, 0.5 mL dichloromethane
was added to the residue and evaporated to dryness.
The analyte mixture was derivatized by the addition of 50 µL ethyl acetate
and 50 µL BSTFA containing 1% TMCS. After 30 min incubation at 65◦ C, samples
(2 µL) were injected onto the autosampler of an HP 5890 gas chromatograph (GC)
equipped with a 5972 mass selective detector (MS) [Hewlett Packard (currently
Agilent Technologies), Palo Alto, CA].
For the construction of standard curves, blank blood, urine, and milk samples
were spiked with 50 ng internal standards and increasing concentrations of analytes
(5, 50, 100, 500, and 1000 ng/mL).
GC-MS Run Conditions
Samples (2 µL) were injected from the autosample vials into the GC-MS.
The analytes were resolved with an HP 1MS capillary column crosslinked with 1%
phenylmethylsilicone (15 m × 0.25 mm with 0.25··m film thickness) using inlet
pressure programming. The electron multiplier was operated at 200 V above the
tune value. The carrier gas used was ultra high purity helium (99.99%). Splitless
injection was used, and the splitless valve remained closed for 1 min and the initial
inlet pressure was 25 psi.
The column head pressure was held for 0.5 min, then decreased to 16 psi at
a rate of 25 psi/min, and, finally, maintained at this pressure for the duration of the
analysis time. This resulted in a flow rate of 1.1 mL/min during the run. Injector
temperature was 280◦ C. The initial oven temperature was 150◦ C and was held for
1 min; the temperature was programmed to increase at 15◦ C/min to 215◦ C, and
then increased to 300◦ C at 35◦ C/min, and held there for 2 min.
The transfer line temperature was held at 280◦ C. Selected ion monitoring
(SIM) mode was used in all runs. The entire run time was less than 8.0 min.
COCAINE AND THREE METABOLITES
405
Selection of Ions
The quantitation and qualifier ions for this study were selected by examining
the full scan mass spectra after injecting approximately 100 ng of each analyte and
its deuterated analog or their TMS derivatives, as appropriate, into the HP 5970
MSD. The mass spectra of the analytes and their deuterated analogs were compared
and ion pairs were selected.
Selections were based on the following criteria with decreasing order of
importance: (A) The corresponding ion from the analog must not occur in the
analyte, and the corresponding ion from the analyte must not occur in the analog. (B) The most abundant ions were selected. (C) The largest m/z ions were
selected. Once the most abundant ions were selected for each analyte, their exact
masses were determined periodically to ensure that the target ions remained the
same.
RESULTS AND DISCUSSION
Solid-phase extraction has several advantages over liquid-liquid extraction.
These advantages are: decreased solvent volumes, resulting in decreased solvent
disposal costs; reduced operator time; high percent recovery of analytes; and low
limits of detection and quantitation for the analytes (22). Additionally, solid-phase
extraction yields clean extracts and minimizes the appearance of endogenous
peaks, thereby increasing analyte selectivity (23).
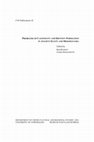
The major ion peaks selected are shown in Table 1, and they are in agreement
with previous reports (2,20). As shown in Figure 1, COC, BE, HBE, and COCE
are easily separated under the above-described GC-MS conditions. The retention
times for the four analytes ranged from 5.74 to 7.12 min (Table 1). The calibration
curves obtained for each analyte were constructed using linear regression analysis
(24). For COC, BE, and COCE in blood, urine, and milk, linearity was achieved
Table 1. Retention Times and Quantitative and Qualitative Ions Monitored for COC,
COCE, and Derivatized BE and HBE
Analyte
COC
TMS-BE
TMS-HBE
COCE
Retention Time
(min)
Quantitative Ion
(m/z)
Qualitative Ion
(m/z)
Qualitative Ion
(m/z)
5.74
6.08
7.12
5.99
182
240
240
196
198
256
210
82
303
361
449
317
406
ABUKHALAF ET AL.
Figure 1. GC-MS Total Ion Chromatogram of 500 ng/mL COC, BE, HBE, and COCE.
over a concentration range of 5 to 1000 ng/mL, whereas linearity for HBE in all
specimen types (blood, urine, and milk) ranged from 10 to 1000 ng/mL.
The data, upon the analysis of the corresponding regression lines (24), exhibited correlation coefficients ranging from 0.999 to 1.0 for blood, 0.998 to 0.999
for urine, and 0.997 to 0.999 for milk (Table 2). The formulas of the lines for each
analyte in the three specimen types are also shown in Table 2. The limits of detection (LOD) and limits of quantitation (LOQ) for each analyte in each specimen
type were determined experimentally (N = 5).
COCAINE AND THREE METABOLITES
407
Table 2. Analysis of the Regression Line for Analytes in Blood, Urine, and Milk
Analyte
COC
Category
Blood
Urine
Milk
RR∗
1.70 × AR¶ +
4.86 × 10⁻²
0.999
5–1000
0.954 × AR +
1.39 × 10⁻²
0.999
5–1000
1.12 × AR +
8.09 × 10⁻³
0.999
5–1000
0.85 × AR +
8.69 × 10⁻²
0.999
5–1000
1.08 × AR +
5.01 × 10⁻²
0.998
5–1000
1.04 × AR +
6.23 × 10⁻²
0.999
5–1000
1.70 × AR +
4.9 × 10⁻²
1.000
10–1000
2.62 × AR +
9 × 10⁻²
0.999
10–1000
2.41 × AR +
9.8 × 10⁻¹
0.997
10–1000
0.896 × AR +
3.1 × 10⁻²
1.000
5–1000
1.08 × AR +
1.97 × 10⁻²
0.999
5–1000
8.0 × AR +
1.39 × 10⁻²
0.999
5–1000
r2∗∗
Linearity
(ng/mL)
TMS-BE
RR
r2
Linearity
(ng/mL)
TMS-HBE
RR
r2
Linearity
(ng/mL)
COCE
RR
r2
Linearity
(ng/mL)
∗
RR = Response Ratio; Area of Analyte/Area of Internal Standard.
AR = Amount Ratio; Concentration of Analyte/Concentration of Internal Standard.
∗∗ 2
r = correlation coefficient.
For LOQ, blank specimens were spiked with a series of decreasing concentrations of analytes and a constant concentration (50 ng/mL) of their corresponding
internal standards. LOD was defined as the concentration corresponding to a signal
to noise ratio of 3. LOQ was defined as the lowest quantitated concentration that
was within 20% of the target concentration. As shown in Table 3, the LOD values
obtained for COC, BE, HBE, and COCE extracted from blood were 2.5, 2.5, 4.0,
and 2.5 ng/mL, respectively. These values were comparable to those obtained for
the same analytes extracted from urine or milk.
The LOQ values obtained for COC, BE, HBE, and COCE extracted from
blood were 5.0, 5.0, 8.0, and 5.0 ng/mL, respectively. Similarly, LOQ values obtained for COC, BE, HBE, and COCE extracted from urine or milk ranged from
5.0 to 10 ng/mL (Table 3).
Table 4 illustrates the extraction efficiency of various analytes at three concentrations (10, 500, and 1000 ng/mL) in blood, urine, and milk. These three
concentration points represent the low, middle, and high portions of the standard
408
ABUKHALAF ET AL.
Table 3. Limits of Detection and Quantitation, and Percent Recovery of
Analytes in Blood, Urine, and Milk
Blood∗∗
Analyte
COC
TMS-BE
TMS-HBE
COCE
Urine∗∗
Milk∗∗
LOD*
LOQ
LOD
LOQ
LOD
LOQ
2.5
2.5
4.0
2.5
5.0
5.0
8.0
5.0
2.5
2.5
5.0
2.5
5.0
5.0
10.0
5.0
2.5
2.5
5.0
2.5
5.0
5.0
10.0
5.0
∗∗
n = 5.
LOD = Limit of Detection, defined as the concentration of analyte at which
mean signal to noise ratio is 3:1.
LOQ = Limit of Quantitation, defined as the lowest standard that was
within 20% of the target concentration concentration of the analyte.
∗
curve. With the exception of HBE, extraction efficiencies (recoveries) of all analytes from the three biological matrices (blood, urine, and milk) were comparable
(Table 4). At a low concentration (10 ng/mL), percent recoveries for COC, BE,
and COCE ranged from 90.9 to 94.1%, whereas recoveries for HBE in the three
matrices ranged from 80.4 to 86.6% (Table 4). At 500 ng/mL, the highest percent
recovery achieved was for COC (98.2%), and the lowest recovery was for HBE
(81.2%). At a concentration of 1000 ng/mL, recoveries of COC, BE, and COCE
ranged from 92.7 to 97.8%, whereas recoveries for HBE ranged from 82.6 to 87.8%
(Table 4).
Generally, recoveries of HBE from blood, urine, and milk at the three concentration levels (10, 500, and 1000 ng/mL) were less than those observed with
the other analytes (Table 4). This suggests that HBE either did not extract as
efficiently as the other analytes, or underwent stereochemical configuration with
Table 4. Percent Recoveries of Analytes in at Three Concentrations (ng/mL) in
Blood, Urine, and Milk
Blood∗
Analyte
COC
TMS-BE
TMS-HBE
COCE
∗
Milk∗
10
500
1000
10
500
1000
10
500
1000
92.8
94.1
82.8
92.1
98.2
97.6
83.5
94.0
96.6
97.8
87.8
94.8
91.9
93.5
80.4
93.3
96.1
95.6
81.2
97.1
97.2
96.1
82.6
94.6
90.9
93.3
86.6
91.9
95.8
NA
87.9
93.2
96.4
93.5
84.8
92.7
n = 5.
NA = Not Analyzed.
Urine∗
COCAINE AND THREE METABOLITES
409
a different spatial configuration. Whether HBE was converted from the metahydroxy configuration to para-hydroxy configuration, or not, is currently under
intensive investigation in our laboratory. Preliminary data (not shown) suggest that
conversion of the meta-hydroxy configuration of HBE to para-hydroxy configuration (para-HBE) did not occur during the extraction or the GC-MS run conditions
for there was no evidence for the occurrence of the m/z 82, usually abundant in
the para-HBE mass spectrum (2).
Intra- and inter-assay precision of the analytical procedure in blood, urine,
and milk, as represented by percent correlation of variance (% C.V.), is illustrated
in Table 5 (A,B,C). Precision was determined experimentally (n = 5) by spiking
negative blood, urine, and milk samples with COC, BE, HBE, and COCE at concentrations of 10, 500, and 1000 ng/mL. For all the analytes, at concentrations
of 500 and 1000 ng/mL, intra-assay precision (% C.V.) values were less than 10
(Table 5 A,B,C). At a concentration near the limit of quantitation (10 ng/mL),
% C.V. values reflected a greater variation of precision for COC, BE, HBE, and
COCE which ranged between 2.3 to 14.1 (Table 5 A,B,C).
Inter-assay precision of the method was determined experimentally in a
manner similar to that of intra-assay precision. Spiked blood, urine, and milk
samples were analyzed on a daily basis for two weeks. With the exception of
HBE, inter-assay precision ranged from 2.6 to 12.
Table 5. Intra- and Inter-Assay Precision for Cocaine (COC), Cocaethylene (COCE),
Derivatized Benzoylecgonine (TMS-BE), and Derivatized m-Hydroxybenzoylecgonine
(TMS-HBE) in (A) Blood, (B) Urine, and (C) Milk
Target Conc.
(ng/mL)
A. Blood
10
Analyte
COC
TMS-BE
TMS-HBE
COCE
Intra-Assay
(mean conc)*
9.3
9.4
8.8
9.6
Precision
(% C.V.)
2.3
2.8
14.1
7.4
Inter-Assay
(mean conc.)*
9.1
9.2
7.9
9.3
Precision
(% C.V.)
5.5
4.3
18.3
8.7
500
COC
TMS-BE
TMS-HBE
COCE
491
488
416
470
2.2
2.1
9.8
4.3
472
465
381
411
3.1
2.6
11.6
6.7
1000
COC
TMS-BE
TMS-HBE
COCE
966
978
878
948
3.4
5.2
9.9
4.6
921
908
816
919
7.4
8.8
12.9
7.1
(continued)
410
ABUKHALAF ET AL.
Table 5. Continued
Target Conc.
(ng/mL)
Analyte
Intra-Assay
(mean conc)*
Precision
(% C.V.)
Inter-Assay
(mean conc.)*
Precision
(% C.V.)
COC
TMS-BE
TMS-HBE
COCE
9.2
NA
8.0
9.3
4.3
—
12.3
6.7
9.1
NA
7.6
8.9
8.9
—
14.9
12.0
500
COC
TMS-BE
TMS-HBE
COCE
481
478
406
NA
4.1
4.9
8.8
—
448
449
373
NA
7.9
8.3
13.1
—
1000
COC
TMS-BE
TMS-HBE
COCE
972
961
826
946
4.2
4.7
9.3
5.2
921
908
781
889
9.9
9.8
12.5
6.4
B. Urine
10
C. Milk
10
COC
TMS-BE
TMS-HBE
COCE
8.7
9.3
9.0
9.5
5.1
4.7
12.4
6.1
9.0
9.1
7.9
8.6
8.9
7.6
15.7
9.8
500
COC
TMS-BE
TMS-HBE
COCE
479
481
440
466
5.3
6.1
9.0
4.5
427
428
383
461
8.4
9.3
10.8
9.7
1000
COC
TMS-BE
TMS-HBE
COCE
964
935
848
927
5.1
5.2
9.7
6.0
NA
931
801
902
—
7.8
11.2
10.0
∗
n = 5.
NA = Not Analyzed.
The coefficients of variation (% CV) for HBE in all specimen types were
higher than those obtained for COC, BE, and COCE (Table 5). This may be due to
the lower abundance of the quantitation ion of TMS-HBE and the relatively lower
recovery. The higher % C.V. values observed with the 10.0 ng/mL samples are
because this concentration is near the limit of quantitation where greater variation
should be expected.
The applicability of this validated method was tested on human and rat
blood samples, as well as on human urine samples obtained from alcohol and/or
COCAINE AND THREE METABOLITES
411
Table 6. Analysis of Rat Blood for COC, BE, HBE, and COCE
Specimen I.D.
Analyte
Concentration (ng/mL)
1
COCE
BE
HBE
COC
<LOQ∗
0.00
0.00
34.8
2
COCE
BE
HBE
COC
3
COCE
BE
HBE
COC
<LOQ∗
0.00
0.00
31
4
COCE
BE
HBE
COC
<LOQ∗
0.00
0.00
20.0
∗
11.4
113.6
0.00
28
<LOQ = the concentration was less than the limit of quantitation.
cocaine-abusing individuals. Unfortunately, we were unable to obtain human milk
samples from cocaine-abusing nursing mothers. As shown in Table 6, four control
rat blood samples obtained from rats not treated with cocaine did not reveal any
presence of cocaine analytes.
On the other hand, analysis of samples obtained from rats treated with cocaine (10 µg/kg) subcutaneously revealed the presence of COC and BE. Because
the rats were not administered alcohol concomitantly with cocaine, cocaethylene,
a metabolite produced as a result of a concomitant administration of cocaine and
alcohol (7), was not detected. HBE was detected in rat blood samples spiked with
the compound. The reason for the absence of HBE in samples obtained from
cocaine-treated rats may have been due to the fact that blood samples were drawn
one week (longer than the half-lives of most cocaine metabolites including HBE)
after cocaine treatment. Another possibility is the possible inability of rats to form
HBE.
Comprehensive literature searches conducted at the time of submitting this
manuscript failed to produce any literature on the presence of HBE in rats.
As shown in Table 7, all five human urine samples tested contained all four
cocaine analytes in various concentrations. The corresponding blood samples,
however, contained BE and traces of HBE. This was not surprising for COC’s
half-life is significantly shorter than BE.
412
ABUKHALAF ET AL.
Table 7. Analysis of Human Blood and Urine Samples for COC, BE, HBE, and COCE
Specimen I.D.
Analyte
Blood
Concentration
(ng/mL)
Urine
Concentration
(ng/mL)
COCE
BE
OH-BE
COC
COCE
18.4
921
218
1930
49
2
BE
OH-BE
COC
COCE
714
78
557
171
998
13
719
21
3
BE
OH-BE
COC
COCE
391
30
57
7
433
2.9∗
44
13
4
BE
OH-BE
COC
COCE
914
111
257
34
2013
17
57
66
5
BE
OH-BE
COC
502
49
53
871
152
128
1
∗
11.1
801
0.4∗
1272
210
= less than the limit of quantitation.
Oyler et al. (2) have shown that both the p- and m-HBE are excreted in adult
urine. The presence of HBE in adult urine and blood (trace amounts) indicates
that our data further supports Oyler et al. (2) findings that p- and m-HBE are not
unique fetal metabolites of COC as initially reported by other investigators (25).
In conclusion, a practical and reliable analytical method for the detection
and quantitation of COC, BE, HBE, and COCE is validated. The applicability of
the method to extract COC, BE, HBE, and COCE from blood, urine, and milk
specimens was demonstrated successfully. The method can be utilized for the
detection of these cocaine analytes in a research setting, as well as in forensic drug
testing laboratories.
ACKNOWLEDGMENTS
The authors wish to thank Dr. Mohammad Bayorh for providing rat blood
samples, and Dr. Robert Oster for conducting the statistical analyses. This work
COCAINE AND THREE METABOLITES
413
was partially supported by a NIH grant P20 RR11104-05 and by a Morehouse
School of Medicine Faculty Development award. Bryan Parks current address is
the Department of Chemistry, University of Georgia, Athens, GA 30602.
REFERENCES
1. Jufer, R.A.; Walsh, S.L.; Cone, E.J. J. Anal. Toxicol. 1998, 22, 435–444.
2. Oyler, J.; Darwin, W.D.; Preston, K.L.; Suess, P.; Cone, E.J. J. Anal. Toxicol.
1996, 20, 453–462.
3. Baselt, R.C.; Cravey, R.H. Cocaine. In Disposition of Toxic Drugs and Chemicals in Man; Chemical Toxicology Institute: Foster City, 1995; 186–190.
4. Jatlow, P. Yale J. Biol. Med. 1988, 61, 105–113.
5. Stewart, D.J.; Inaba, T.; Lucassen, M.; Kalow, W. Clin. Pharmacol. Ther.
1979, 25, 464–468.
6. Zhang, J.Y.; Foltz, R.L. J. Anal. Toxicol. 1990, 14, 201–205.
7. Hearn, W.L.; Rose, S.; Wagner, J.; Ciarleglio, A.; Mash, S. Pharm. Biochem.
Behav. 1991, 39, 531–533.
8. Hearn, W.L.; Flynn, D.D.; Hime, G.W.; Rose, S.; Cofino, J.C.; ManteroAtienza, E.; Wetli, C.V.; Mash, D.C. J. Neurochem. 1991, 56, 698–701.
9. Jatlow, P.; Elsworth, J.D.; Bradberry, C.W.; Winger, G.; Taylor, J.R.; Russell,
R.; Roth, R.H. Life Sci. 1991, 48, 1787–1794.
10. Boyer, C.S.; Petersen, D.R. J. Pharmacol. Exp. Ther. 1992, 260, 939–946.
11. Steele, B.W.; Bandstra, E.S.; Wu, N.-C.; Hime, G.W.; Hearn, W.L. J. Anal.
Toxicol. 1993, 17, 353–358.
12. Bailey, D.N. Am. J. Clin. Pathol. 1994, 101, 342–345.
13. Kogan, M.J.; Pierson, D.J.; Durkin, M.M.; Wilson, N.J. J. Chromatogr. 1989,
490, 236–242.
14. Jenkins, A.J.; Goldberger, B.A. J. Forensic Sci. 1997, 42, 824–827.
15. Ferrara, S.D.; Tedeschi, L.; Frison, G.; Brusini, G.; Castagna, F.; Bernardelli,
B.; Soregaroli, D. J. Anal. Toxicol. 1994, 18, 278–291.
16. Glass, R.L.; Johnson, E.L. J. Liquid Chromatogr. 1993, 16, 3543–3555.
17. Tagliaro, F.; Valentini, R.; Manetto, G.; Crivellente, F.; Carli, G.; Marigo, M.
Forensic Sci. Int. 2000, 107, 121–128.
18. Girod, C.; Staub, C. Forensic Sci. Int. 2000, 107, 261–271.
19. Abusada, G.M.; Abukhalaf, I.K.; Alford, D.D.; Vinzon-Bautista, I.;
Pramanik, A.K.; Ansari, N.A.; Manno, J.E.; Manno, B.R. J. Anal. Toxicol.
1993, 17, 353–358.
20. Clean Screen Extraction-Columns. Applications Manual. Worldwide Monitoring: Bristol, PA, 1997.
21. Preparation and Testing of Reagent Water in the Clinical Laboratory, 2nd Ed.;
National Committee for Laboratory Standards, NCCLS Document C3-A2:
Villanova, PA, 1991; Vol. 11, No. 13.
414
ABUKHALAF ET AL.
22. Pocci, R.; Dixit, V.; Dixit, V.M. J. Anal. Toxicol. 1992, 16, 45–47.
23. Lillsunde, P.; Korte, T. J. Anal. Toxicol. 1991, 17, 71–81.
24. Tallarida, R.J.; Murray, R.B. Manual of Pharmacologic Calculations with
Computer Programs, 2nd Ed.; Springer-Verlag: New York, NY, 1987.
25. Steele, B.W.; Bandstra, E.S.; Wu, N.-C.; Hime, G.W.; Hearn, W.L. J. Anal.
Toxicol. 1993, 17, 348–352.
Received August 2, 2000
Accepted August 30, 2000
Manuscript 5359
Copyright of Journal of Liquid Chromatography & Related Technologies is the property of Taylor & Francis
Ltd and its content may not be copied or emailed to multiple sites or posted to a listserv without the copyright
holder's express written permission. However, users may print, download, or email articles for individual use.
Keep reading this paper — and 50 million others — with a free Academia account
Used by leading Academics

Yucel Kadioglu
Ataturk University

Rgo Araujo
UFBA - Federal University of Bahia

Tobias Takas Shumba
Harare Polytechnic

Bruno Boulanger
Université de Liège