CHAOS 20, 045107 共2010兲
On the role of subthreshold currents in the Huber–Braun cold receptor
model
Christian Finke,1,a兲 Jan A. Freund,1 Epaminondas Rosa, Jr.,2 Hans A. Braun,3
and Ulrike Feudel1
1
ICBM, University of Oldenburg, Carl-von-Ossietzky-Strasse 9-11, 26111 Oldenburg, Germany
Department of Physics, Illinois State University, 312B Moulton Hall, Bloomington/Normal, Illinois 61790,
USA
3
Institute of Physiology, University of Marburg, Deutschhausstrasse 1-3, 35037 Marburg, Germany
2
共Received 31 August 2010; accepted 28 November 2010; published online 30 December 2010兲
We study the role of the strength of subthreshold currents in a four-dimensional Hodgkin–Huxleytype model of mammalian cold receptors. Since a total diminution of subthreshold activity corresponds to a decomposition of the model into a slow, subthreshold, and a fast, spiking subsystem, we
first elucidate their respective dynamics separately and draw conclusions about their role for the
generation of different spiking patterns. These results motivate a numerical bifurcation analysis of
the effect of varying the strength of subthreshold currents, which is done by varying a suitable
control parameter. We work out the key mechanisms which can be attributed to subthreshold
activity and furthermore elucidate the dynamical backbone of different activity patterns generated
by this model. © 2010 American Institute of Physics. 关doi:10.1063/1.3527989兴
Modeling the generation of neuronal signals like action
potentials is a central concern in modern theoretical neuroscience. Physiologically realistic models consider—in a
simplified and statistical way—the ionic mechanisms that
underlie action potential generation. This approach, introduced by Hodgkin and Huxley in 1952 upon describing the squid giant axon, still remains the basis for
mechanism-based neuronal modeling. The encoding of
signals which are to be propagated along the nerve is a
matter of the intervals between subsequent spikes and
their respective statistics. Even though action potentials
are basically peaks of electric potential rising above a
certain threshold, the emergence of different patterns—
pacemakerlike firing, chaotic firing, or groups of action
potentials followed by longer periods of silence, for
instance—is largely due to activity below this threshold.
To elucidate the role of these subthreshold oscillations in
a mammalian cold receptor model is the aim of this study.
The model used here features a physiologically motivated
mathematical implementation of slow subthreshold ionic
currents which facilitate subthreshold oscillations as a
highly relevant constituent of the model’s dynamics. We
study how temperature affects the activity of the subthreshold currents and show that a feedback loop between the spike-generating currents and the subthreshold
currents is responsible for the complicated dynamics of
the model. A stability analysis of equilibria further elucidates the impact of the subthreshold subsystem on the
spike-generating subsystem. Having established the effects of temperature variation on subthreshold oscillations, we therefore vary a particular parameter to perform a bifurcation analysis on the variation of the
strength of subthreshold currents. These findings elucidate the onset and extinction of spiking at the far ends of
a兲
Electronic mail: christian.finke@uni-oldenburg.de.
1054-1500/2010/20共4兲/045107/11/$30.00
the parameter range and reveal how the strength of subthreshold currents has an impact on the dynamical state,
i.e., the firing pattern, of the whole model.
I. INTRODUCTION
A central tool in today’s theoretical neuroscience research are mathematical models of neuronal spike
propagation.1–3 Most models that stem from an experimental
approach are based on the Hodgkin–Huxley 共HH兲
mechanism,4 but with often profound simplifications.5,6 The
advantages over the original model are then the achievement
of a reduced number of variables that can be handled theoretically and at the same time perform effectively in numerical simulations. However, these advantages usually come at
the price of a substantial loss of flexibility of these models
in describing certain regime transitions or neuronal firing
patterns.
A key mechanism responsible for the occurrence of different firing regimes has been found to be the occurrence of
slow, subthreshold membrane potential oscillations.7,8 This
mechanism is functionally connected to slow, subthreshold
currents.9–13 These currents activate below the activation
threshold of the currents which are responsible for the generation of spikes. While simplified Hodgkin–Huxley-type
models such as the Morris–Lecar model are able to exhibit
subthreshold oscillations in a certain range of control parameters, these oscillations are not rooted in a functional implementation of subthreshold currents in the model but rather
constitute a certain dynamical regime of their own.14 For a
physiologically functional modeling of many classes of neurons of the peripheral and central nervous system 共PNS and
CNS兲, the introduction of slow, subthreshold currents seems
a necessity to mimick the observed features of subthreshold
membrane potential oscillations.
20, 045107-1
© 2010 American Institute of Physics
Downloaded 24 Jan 2011 to 137.248.201.151. Redistribution subject to AIP license or copyright; see http://chaos.aip.org/about/rights_and_permissions
045107-2
Finke et al.
Chaos 20, 045107 共2010兲
eter of subthreshold activity is self-evident. The caveat here
is that while it is certainly desirable to make the highly nonlinear temperature dependence of the model accessible to
bifurcation analysis, one should still try to keep the analysis
elementary enough to relate its interpretation to basic physiological features of the model. This shall be done in this
work by studying the effect of variations of a control parameter  which had been introduced in Ref. 16 to measure the
strength of the impact of the subthreshold currents. Our goal
is therefore to reach conclusions about the subthresholdrelated mechanisms behind temperature scaling of the model
in the physiologically highly relevant pacemaker and chaotic
firing regimes through a bifurcation analysis of the effects of
scaling this parameter . Our main concern here is the development of a mathematical understanding of the impact of
subthreshold currents on the dynamics of neuronal impulse
patterns.
This paper is organized as follows. Section II gives a
thorough description of the model, including the effects of a
spiking-subthreshold decomposition and an analysis of the
dynamics of the spiking and the subthreshold subsystem
alone. We also study the drive-response principle between
the two subsystems and its implications. We then proceed to
analyze the dynamics of the model in terms of bifurcation
theory in Sec. III, making use of a parameter controlling the
intensity of impact of the subthreshold subsystem. Finally, a
summary is given in Sec. IV.
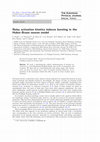
FIG. 1. Major activity patterns of the cold receptor model. The abscissa
shows interspike intervals. From top to bottom: 共a兲 chaotic firing, 共b兲 periodic bursting, and 共c兲 tonic firing
II. THE MODEL
In this work we study the Huber–Braun model which
had been developed in 1998 and is best described in Refs. 15
and 16. It provides four quantities, each of which represents
a physiological and—in principle—experimentally accessible variable. Even though it had been developed to mimick
signal transduction in cold receptors, it has been found that
the variety of possible different firing regimes and their respective transitions as well as other effects such as inherent
subthreshold oscillations in a physiologically relevant parameter range are unparalleled. This model has been used in
a variety of contexts, as, e.g., to study noise effects17,18 and
synchronization.19 However, a theoretical description of the
basic mechanisms underlying model’s activity has not been
available so far.
Since the model allows for a decomposition into a fast
spiking system and a system generating slow, subthreshold
oscillations, the interplay of these two systems seems to be
the key factor for the flexibility of the model. The primary
innovation, compared to the Hodgkin–Huxley model, is the
introduction of two slow currents that activate way below the
activation threshold of the spike generator. Understanding
the dynamics that lead to the emergence of the different firing patterns is basically the question of understanding the
model features that originate in the dynamics of subthreshold
activity. Since the temperature dependence of the model
most profoundly affects the slow currents, an analysis of the
bifurcations associated to temperature as the control param-
We study a HH-type model which had originally been
developed to simulate the impulse activity of peripheral cold
receptors in response to temperature changes.15,16 In agreement with the experimental observation, this model exhibits
an enormous variety of different impulse patterns depending
on temperature or input currents. The major activity patterns
are illustrated in Fig. 1.
From low to high temperatures, a cold receptor’s activity
changes from pacemakerlike spike generation via chaotic impulse patterns 关Fig. 1共a兲兴 to burst discharges 关Fig. 1共b兲兴.20
With further increasing temperature again a tonic firing pattern of single spikes appears 关Fig. 1共c兲兴.
Besides the spiking behavior shown in Fig. 1, the model
exhibits also subthreshold oscillations. This means that the
membrane potential oscillates between two spiking events
with a much lower frequency than the mean spiking frequency 共cf. Fig. 2兲.
The different patterns mentioned above can be seen in
many other neurons in the peripheral and central nervous
system 共PNS and CNS兲. However, none of the other neurons,
to our knowledge, is able to generate all of these patterns as
cold receptors do in response to their physiological adequate
stimulus. For example, thalamocortical and hypothalamic
neurons exhibit tonic-to-bursting transitions21,22 but are missing the tonic firing activity with subthreshold oscillations. By
contrast, transitions from subthreshold oscillations to tonic
firing can be recorded in other CNS structures such as the
entorhinal cortex and the amygdala23 as well as in peripheral
sensory afferents from warm receptors24 and shark
Downloaded 24 Jan 2011 to 137.248.201.151. Redistribution subject to AIP license or copyright; see http://chaos.aip.org/about/rights_and_permissions
045107-3
On the role of subthreshold currents
FIG. 2. Time series of the membrane voltage at 10 ° C showing subthreshold oscillations between spiking events.
electroreceptors.25 These neurons, however, do not show the
transitions from pacemaker-like tonic firing to burst discharges.
Altogether, cold receptors appear to be the most flexible
single-neuron pattern generators which are even more remarkable as they consist of nothing more than free nerve
endings without any specialized structures and without any
synaptic connections.26 Hence, the variety of dynamics arises
from the intrinsic membrane properties of the receptive
endings.
These particular conditions have also been considered in
the cold receptor model which, therefore, has become a frequently used tool, partly with slight modifications, to examine general aspects of impulse pattern variability and to
evaluate the underlying dynamics27–30 or their implications
for neuronal synchronization.19,31–33 The most detailed description of the model and its physiological background can
be found in Ref. 15. A summary is given in the remainder of
this section since this model constitutes the basis of our
study.
A. Model structure and equations
The original HH model examines the emergence of an
action potential depending on sodium and potassium currents. However, the cold receptor model focuses on the
mechanism of impulse generation taking into account subthreshold currents.34 Therefore, in addition to the spikegenerating sodium and potassium currents 共INa and IK兲, two
more currents 共INap and IK共Ca兲兲 were included which activate
the opening of the ion channels below the threshold of spike
generation and have significantly slower activation kinetics
than the spike-generating currents. While this activation is
starting at about ⫺40 mV for the fast currents, the opening of
channels for the slow currents is ignited already at about
⫺90 mV—way below the opening threshold of the fast currents. This is illustrated in Fig. 3. These slower activating
currents are therefore called subthreshold currents. They
should not be confused with the subthreshold oscillations
mentioned above which refer to slow low amplitude oscillations of the membrane potential.
Chaos 20, 045107 共2010兲
FIG. 3. Sigmoidal activation curves for the fast currents 共dashed line兲 and
the slow currents 共solid line兲. The abscissa shows the opening probability of
the respective ion channels averaged over a membrane area of 1 cm2. The
slow currents activate already around ⫺90 mV, while the fast currents only
activate at a much higher voltage of about ⫺50 mV.
INap stands for a persistent, i.e., noninactivating Nacurrent and IK共Ca兲 is modeled as a simplified version of a
Ca-dependent K-current with voltage dependent activation of
the Ca-currents 共for details, see Refs. 15 and 16兲. These subthreshold currents generate slow potential oscillations. Slow
depolarization occurs due to the persistent Na-current which,
in turn, activates a slow repolarizing current.
To formulate the model in more general terms, we introduce the following subscripts for the activation variables and
parameters of the diverse ion currents: d refers to the fast
depolarizing spike current INa, r refers to the fast repolarizing
spike current IK, sd refers to the slow depolarizing spike
current INap, and sr refers to the slow repolarizing spike current IK共Ca兲.
The time evolution of the membrane potential is then
given by
CM
dV
= − Il − Id − Ir −  · 共Isd + Isr兲 − Iext ,
dt
共1兲
where C M is the membrane capacitance, V is the membrane
voltage, and Ii 共i = l , d , r , sd, sr, ext兲 are the ion currents. An
externally applied current is modeled by Iext. Compared to
previous analyses of this model, we have introduced a scalar
factor  which accounts for the strength of the subthreshold
currents. The introduction of this factor enables us to scale
the impact of the subthreshold currents in order to figure out
their role in the emergence of different impulse patterns.
To take into account the passive diffusion of unspecified
ions which is always present, the model contains a leak current Il which has no activation kinetics and solely depends on
the membrane voltage.
To model the other currents, simplifications compared to
the conventional HH-approach have been made in several
parts. First of all, the ion channel activation and inactivation
probabilities in the steady state are not separately calculated
but relate the voltage dependent ion currents directly to the
membrane potential in form of a sigmoid function. Asymp-
Downloaded 24 Jan 2011 to 137.248.201.151. Redistribution subject to AIP license or copyright; see http://chaos.aip.org/about/rights_and_permissions
045107-4
Finke et al.
Chaos 20, 045107 共2010兲
totically for large numbers of ion channels, this approach
reflects the approximately Gaussian probability distribution
of ion channel activation. This is justified since the model is
normalized to a membrane surface area of 1 cm2, and the
number of ion channels on this area is large enough to obey
good statistics. Thus, the voltage dependences of Id, Ir, and
Isd are given by sigmoid activation functions,
ai⬁ =
1
1 + exp共− si共V共t兲 − V0i兲兲
for i = d,r,sd,
共2兲
where V0i are half-activation potentials and si the slopes of
the steady state activation curves.
The currents Id, Ir, Isd, and Isr are calculated through the
equation
Ii = giai共V共t兲 − Vi兲
for i = d,r,sd,sr,
共3兲
with Vi being the equilibrium potentials, gi the maximum
conductances, and ai the activation variables. The parameter
is used for the temperature scaling of the ion currents.
The time-dependent activation variables ar, related to the
fast repolarizing current, and asd, related to the slow depolarizing current, evolve like
dai
= 共ai⬁ − ai兲
dt i
for i = r,sd.
共4a兲
By contrast, the fast depolarizing current activates instantaneously since the Na-current activates much faster than
any other current in the model,
ad = ad⬁ .
共4b兲
Activation of the slow repolarizing current is modeled as
a simplified version of a Ca-dependent K-current. It comprises the voltage dependent Ca-currents and the changes of
Ca-concentrations with subsequent alterations of the
K-current in one equation which directly couples the slow
repolarizing current to the slow depolarizing current,
dasr
= 共Isd − kasr兲,
dt
sr
共4c兲
with as a coupling constant and k as a relaxation factor.
Recall that the strength of the subthreshold currents  had
been introduced as a factor in front of Isd in differential equation 共1兲 for the membrane voltage and is therefore appearing
also in this equation.
Alteration of any control parameter can lead to significant changes of the dynamics which will be demonstrated
here with temperature variation. The temperature enters the
model via a scaling of the time constants of current activation using a Q10 law which follows from the van‘t Hoff rule
for the temperature dependence of reaction rates. According
to experimental data from different types of neurons and ion
channels,35 we have a Q10 of 3.0 for the activation variables.
Minor temperature dependences of the maximum conductances with a Q10 of only 1.3 are also considered.
FIG. 4. Bifurcation diagram of the Huber–Braun model. The temporal intervals between two successive spiking events 共interspike intervals兲 are plotted vs the temperature. The intervals were recorded during a simulated time
of 4 min 共after discarding 1 min of transient behavior兲 per temperature
value. Interspike intervals correspond to the Poincaré return time for a surface of section at V = −20 mV.
Accordingly, the temperature dependences are given by
= 3.0共T−T0兲/10 °C ,
共5a兲
= 1.3共T−T0兲/10 °C .
共5b兲
The other parameter values are the following:
共1兲 equilibrium potentials: Vsd = Vd = 50 mV, Vsr = Vr
= −90 mV, Vl = −60 mV;
共2兲 ionic conductances: gl = 0.1, gd = 1.5, gr = 2.0, gsd = 0.25,
gsr = 0.4 共in mS/ cm2兲;
共3兲 membrane capacitance: CM = 1 F / cm2; gives a passive
time constant M = C M / gl = 10 ms;
共4兲 activation time constants: r = 2 ms, sd = 10 ms,
sr = 20 ms;
共5兲 slope of steady state activation: sd = sr = 0.25, ssd = 0.09;
共6兲 half
activation
potentials:
V0d = V0r = −25 mV,
V0sd = −40 mV;
共7兲 coupling and relaxation constants for Isr : = 0.012,
k = 0.17;
共8兲 reference temperature: T0 = 25 ° C.
The whole variety of different spike patterns obtained
for this model is illustrated in Fig. 4, which shows the longterm dynamics of the system in terms of interspike intervals
depending on temperature variation. We observe a perioddoubling cascade into chaos. Intervals of chaotic motion are
immersed with periodic windows. The most prominent feature is the emergence of a homoclinic bifurcation, in which
interspike intervals tend to infinity.
As already mentioned, the model had originally been
developed with regard to cold receptor transduction, i.e., it
referred to specific types of ion channels. However, it can
also account for similar activity patterns in many other neurons. The relevant dynamics do not depend on specific types
of ion channels but arise from their interactions which are
reflected in the model’s structure.
Downloaded 24 Jan 2011 to 137.248.201.151. Redistribution subject to AIP license or copyright; see http://chaos.aip.org/about/rights_and_permissions
045107-5
On the role of subthreshold currents
Chaos 20, 045107 共2010兲
FIG. 5. Excitability of the spiking subsystem: Nullclines of the spiking
subsystem, a trajectory of the excited spiking system after a perturbation
共line with arrows indicating the direction of forward time兲, and the trajectory
of the full system 共dotted line兲. The ellipsis marks the position of the stable
equilibrium. The diagram shows the situation at T = 0 ° C without an applied
current. The nullclines do not depend on the temperature.
From a more general point of view, the model consists of
two potentially oscillating subsystems, the spike-generator
and a subthreshold oscillator. These are operating at different
time scales and are activated at different voltage levels. The
interplay of these two subsystems is the essential determinant for the system’s dynamics.
FIG. 6. Bifurcations of the equilibrium state of the spiking subsystem
C M 共dV / dt兲 = −Id − Ir − Il − Iext. The bifurcation parameter is the strength of an
externally applied current Iext. The equilibrium changes stability at two parameter values through subcritical Hopf bifurcations. Between the Hopf bifurcations, the system is oscillating. Between the turning points 共TP, bold
circles兲, the oscillations are stable.
B. Equilibrium bifurcations
We now take a more detailed look at the two subsystems
of the model, characterized by their respective time scales of
activation. First, it is notable that the spiking subsystem,
CM
dV
= − Id − Ir − Il ,
dt
共6兲
is resting on a stable equilibrium at V = −59.912 mV across
the whole temperature range. This value is set by the equilibrium potential of the leak current. The system is excitable,
i.e., a particular perturbation will cause the membrane potential to exhibit a spike and to return afterward into the stable
equilibrium state, which is illustrated in Fig. 5. However,
when a sufficiently large external current Iext is applied the
system starts to oscillate 共cf. Fig. 6兲. We find that an externally applied current Iext = 1.366 A is necessary to drive the
system from the equilibrium state across the Hopf bifurcation into oscillatory behavior. The extinction of spiking for
high values of applied current, corresponding to a stable
equilibrium state, is known in physiology as depolarization
block.
The situation of the subthreshold subsystem,
CM
dV
= − Isd − Isr − Il ,
dt
共7兲
is more complex. From high to low temperatures, the subthreshold subsystem undergoes a transition from a stable
equilibrium to oscillatory behavior through a supercritical
Hopf bifurcation at T = 37.138 ° C. This event is followed
by stable oscillations until the limit cycle vanishes again to
a stable equilibrium via a reverse Hopf bifurcation at
T = −6.108 ° C, leading again to a stable equilibrium 共cf.
Fig. 7兲. Finally, we find that the full system,
FIG. 7. 共a兲 Continuation of the equilibrium state of the subthreshold system
according to Eq. 共7兲. From high to low temperatures: The stable equilibrium
undergoes a supercritical Hopf bifurcation at T = 37.138 ° C. The stable limit
cycles emerging from the bifurcation are displayed as a bold line. The unstable equilibrium regains stability, again through a supercritical Hopf bifurcation, at T = −6.108 ° C, and the oscillations disappear. 共b兲 Enlarged
segment around the Hopf bifurcation at T = 37.138 ° C. As the amplitude
of the oscillations reaches the activation threshold of the fast currents at
V ⬇ −50 mV 共cf. Fig. 3兲, the spiking amplitude in the full systems takes a
sudden jump, cf. Fig. 8. To help the eye, a dashed line marks the potential
V = 50 mV.
Downloaded 24 Jan 2011 to 137.248.201.151. Redistribution subject to AIP license or copyright; see http://chaos.aip.org/about/rights_and_permissions
045107-6
Chaos 20, 045107 共2010兲
Finke et al.
the subthreshold currents act simply as a driving force to the
spiking subsystem, reflecting the idea that this model works
as a drive-response system.
The hypothesis is that the spiking subsystem will generate action potentials if the depolarization of the membrane is
sufficiently large. The dynamical state, i.e., tonic firing, chaotic firing, or bursting, would be mediated by the amplitude
and frequency of the subthreshold currents. Supposing this
were true, it should be possible to mimick the behavior of the
full system by forcing the spiking subsystem with an externally applied current of a certain amplitude and frequency.
To this end we have simulated the time evolution of the
subthreshold system,
FIG. 8. Continuation of the equilibrium state of the full model according to
Eq. 共8兲. The equilibrium loses stability in a supercritical Hopf bifurcation at
T = 37.617 ° C, which marks the onset of spiking. The sudden jump at
T = 34.796 ° C marks the activation of the spiking currents by sufficient depolarization from the subthreshold oscillator.
CM
dV
= − Id − Ir − Isd − Isr − Il ,
dt
共8兲
exhibits a supercritical Hopf bifurcation at T = 37.617 ° C,
marking the transition from silence 共corresponding to an
equilibrium兲 at higher temperatures to firing activity. The
situation is illustrated in Fig. 8, in which we find another
interesting event at T = 34.796 ° C. We see a sudden jump in
the amplitude of the oscillations, going from very low amplitudes at higher temperatures immediately to amplitudes
associated with the all-or-none response principle of neural
spike generation. This means that the spikes at higher temperatures, i.e., those occurring between the jump and the supercritical Hopf bifurcation, are of very low amplitude and
eventually remain subthreshold. One may also compare this
to the ISI diagram presented in Fig. 4, where recorded interspike intervals disappear at the temperature value where the
jump is occurring, indicating that even though we know
there are stable oscillations, the spiking amplitude does not
exceed ⫺20 mV 共recall that the surface of section for recording interspike intervals was placed at this value, cf. Fig. 4兲
and these spikes are not used for signal transduction—which
is at least true in the deterministic situation we explore here.
In stochastic simulations, this is the parameter range where
noise-induced spike skipping can occur, cf. Refs. 25 and 34.
This jump occurs because the subthreshold oscillations
have reached an amplitude that exceeds the activation
threshold of the spiking system, and thus the oscillations
appearing at lower temperature than the jump reflect the activity of the spiking subsystem, triggered by the subthreshold
oscillations.
C. The role of nonlinear coupling
Looking at the model, we can see that a key feature is
the highly nonlinear coupling of the spiking and subthreshold subsystems via the exponential terms depending on the
membrane voltage appearing in the sigmoidal activation
functions. We now turn our attention to the question whether
CM ·
dV
= − Isd − Isr − Il ,
dt
共9兲
across the temperature range between 0 and 36 ° C to find
the appropriate amplitude and frequency for a driving current
to be added to the spiking subsystem. A simple sinusoidal
current serves as a sufficiently good approximation to the
activity pattern of the subthreshold oscillator, more complex
modulations through Fourier transformations of the original
subthreshold oscillator’s signal have not revealed any qualitative difference in the outcome of the simulations. A striking
result of the computations is that in the temperature range of
the tonic firing regime of the full nonlinear system, the
forced system presents long, rhythmic burst discharges. We
conclude that while the amplitude of the forcing was indeed
sufficient to bring the system across the firing threshold and
have the spiking subsystem generate action potentials, the
dynamical state of the driven system is not in accordance
with the full system’s behavior even though the amplitude,
and frequency of the subthreshold currents were correctly
mimicked. The main ingredient for setting the firing pattern
is thus to be found in the highly nonlinear coupling between
the two subsystems. For this reason one cannot interpret the
dynamics of the full system as simple drive-response dynamics between the subthreshold and the spiking system.
Let us take a closer look at the subthreshold subsystem
and the way the temperature dependence takes an influence
on its dynamics. First, we find that since the temperature
dependence is implemented as an exponential function, the
amplitude of the oscillations is diminished as the temperature
decreases. By contrast, the wavelength increases with falling
temperature, which is an important observation for the following reason. The slow repolarizing activation asr allows
for spiking activity only during the time window between its
minimum and the subsequent maximum. This time window
is getting larger as temperature is decreasing, which is reflected in the increased wavelength of the subthreshold oscillation, cf. Figs. 9 and 10. Moreover, the increased wavelength with decreasing temperature allows for more spikes to
be accommodated between the minimum and the maximum.
We therefore find an increasing number of spikes in the burst
discharges for decreasing temperature. Furthermore, note
that every time a spike is triggered, the variable asr suffers a
setback which contributes to the prolongation of the wavelength. This setback occurs because of the highly nonlinear
feedback from the membrane voltage via the feedback loop
Downloaded 24 Jan 2011 to 137.248.201.151. Redistribution subject to AIP license or copyright; see http://chaos.aip.org/about/rights_and_permissions
045107-7
On the role of subthreshold currents
FIG. 9. Time window between the minimum and subsequent maximum of
the slow repolarizing variable asr, depending on the temperature.
V → Isd → asr. Thus, this feature distinguishes the activity
from simple drive-response dynamics as described above by
driving the spiking system with an external current.
III. INTENSITY VARIATION OF SUBTHRESHOLD
CURRENTS
Up to this point, our focus was on general aspects of the
spiking-subthreshold decomposition of the Huber–Braun
model. In the preceding sections, the numerical value for the
parameter  which has been introduced to have a measure
for the intensity of the subthreshold currents was either zero,
which meant a total decoupling of the spiking and the subthreshold system, or the value was set to 1, which was the
“default” value with which the model had been developed.
We have demonstrated that a key feature for setting the dynamical state of the system is the amplitude of the subthreshold currents, induced by complicated temperature dependences. To make the mechanism of amplitude variation
accessible to a more rigorous bifurcation analysis, we make
use of the fact that the parameter  allows us to regulate the
intensity of subthreshold currents artificially after fixing the
temperature to a certain value. The rationale behind this is to
FIG. 10. Time series of voltage 共dashed line兲 and asr 共solid line兲 at
T = 25 ° C. Clearly visible are the setbacks in asr every time a spike is occurring, caused by the nonlinear feedback from the voltage.
Chaos 20, 045107 共2010兲
FIG. 11. Bifurcation diagram of the Huber–Braun model at a temperature of
10.2 ° C. The bifurcation parameter is the intensity of subthreshold currents
. The model starts spiking at  = 0.256 43 as the result of a homoclinc
bifurcation as explained in the text and Fig. 13. Then, tonic firing cascades
into chaos through repeated period-doublings for increasing . Another homoclinic bifurcation appears shortly after  = 1. Beyond the chaotic regime,
we find a range of periodic bursting, until the model becomes silent.
account for the observation that subthreshold currents can be
differently pronounced in different neurons and can significantly change under different experimental conditions. For
simplicity, we do not specifically consider a separate scaling
of different ion channels but view our approach as the easiest
way of scaling the overall amplitude of subthreshold currents. Therefore, we choose the same value of  for the different ion currents. The underlying bifurcations that are related to variations of the intensity of subthreshold currents
are made accessible to analysis through one- and twoparameter continuation routines 共as implemented in the packages AUTO36 and MATCONT37兲.
From now onward, we fix the temperature at 10.2 ° C to
investigate the effects of variation of other bifurcation parameters. The rationale behind this choice of temperature is
that it is close to the homoclinic bifurcation described in Ref.
29 so some effects of it might still be within reach and playing a role for the dynamics at this temperature. The system is
now in the chaotic regime, cf. Fig. 4.
A bifurcation diagram of the model is shown in Fig. 11.
The parameter which is being varied is the intensity of the
subthreshold currents measured in terms of the parameter .
On the ordinate, we have plotted again interspike intervals.
From this figure we find that at very low values of , no
interspike intervals have been recorded, i.e., no spiking occurs. The system starts exhibiting oscillations only for
 ⱖ 0.26. The oscillatory behavior produces long interspike
intervals at its onset, then going into a tonic firing mode
before proceeding through a series of period-doubling bifurcations into chaos. The homoclinic bifurcation described
when using temperature as the control parameter appears
shortly after  = 1 looking at T = 10.2 ° C, which is due to the
fact that we are below the critical temperature of about
10.7 ° C where the homoclinic bifurcation occurs for  = 1.
Increasing the control parameter further, we observe periodic
bursts and finally the disappearance of interspike intervals.
Note that the bifurcation diagram for variations of  and the
Downloaded 24 Jan 2011 to 137.248.201.151. Redistribution subject to AIP license or copyright; see http://chaos.aip.org/about/rights_and_permissions
045107-8
Finke et al.
FIG. 12. Continuation of the equilibrium. Bold lines indicate the stable
parameter regions. Hopf bifurcations are indicated by bold dots, labeled H.
Stability is lost at  = 0.2587 in a subcritical Hopf bifurcation and regained
at  = 2.4 in a supercritical Hopf bifurcation. On the unstable segment, two
limit points 共labeled LP兲 are marked by diagonal crosses.
bifurcation diagram for temperature variation 共Fig. 4兲 give
the same bifurcation structure for low values of the respective control parameter up to the periodic bursting regime
following the chaotic attractor. Thus, we point out that even
though it is a simplification, a study of the bifurcations associated with  is a justified tool to elucidate key mechanisms
behind the more complicated temperature-associated bifurcations of the original model, at least in the low-temperature
regime up to about 13 ° C.
In order to get a better understanding of the phenomena
encountered in the bifurcation diagram, we choose special
points such as equilibria and Hopf points and study their
behavior when control parameters are changing.
We first take a look at the situation before the onset of
spiking. As already noted, the system rests at a stable fixed
point for  = 0. Figure 12 shows the continuation of this equilibrium, i.e., the numerical value of the membrane voltage
attained by the equilibrium is plotted on the ordinate against
the respective value of the control parameter , plotted on
the abscissa. The equilibrium loses stability in a subcritical
Hopf bifurcation at  = 0.2587. We find two limit points on
the following unstable segment which continues until the
equilibrium regains stability in a supercritical Hopf bifurcation at  = 2.4. In this diagram, we encounter a distinguished
feature of our approach of variation of the strength of subthreshold currents: The occurrence of turning points of the
equilibrium is special to variation of our control parameter .
Together with the Hopf bifurcations, this dynamical feature
will turn out to lead to bifurcations of higher codimension.
Figure 13 shows a continuation of the unstable periodic
orbit emerging from this Hopf point. This unstable periodic
orbit collides with the saddle point, and as a result of this
homoclinic bifurcation, the unstable periodic orbit disappears
at  = 0.2575. However, at another homoclinic bifurcation, a
stable periodic orbit emerges which marks the onset of spiking at  = 0.256 43 共cf. Fig. 13兲. This stable periodic orbit can
be identified in Fig. 11 as the periodic orbit representing the
tonic firing regime for small . The homoclinic bifurcation
Chaos 20, 045107 共2010兲
FIG. 13. Continuation of the unstable limit cycle 共empty circles兲 emerging
from the first Hopf bifurcation 共H兲 and the stable limit cycle 共filled circles兲
emerging from a homoclinic bifurcation 共Hom兲 at  = 0.256 43. One sees
the collision of unstable cycles with the saddle at V = −41.25 mV. The
unstable limit cycles undergo a homoclinic bifurcation and disappear at
 = 0.2575.
shown in Fig. 13 can be detected in Fig. 11 where the interspike intervals tend to infinity.
A bifurcation analysis in the space of the two control
parameters  and gl is shown in Fig. 14. The second bifurcation parameter gl has been employed because the leak current is already equipped with a natural strength, namely, the
leak conductivity gl. Thus, continuation in these two parameters gives a coherent picture of the effects of amplitude
variation of subthreshold currents.
Figure 14 shows a representation of a one-parameter
continuation of the equilibrium and two-parameter continuation of special points on the equilibrium curve over the state
variables V and asr. It is to be read like a phase portrait, but
not with time being the parametrizing variable, but the intensities of subthreshold and leak currents. The parametrization
starts at the left border of the diagram at  = 0, gl = 0.
FIG. 14. Representation of the bifurcation diagram of two-parameter continuation in  and gl over the state variables V and asr. The labels indicate
the following bifurcations: H = Hopf, BT = Bogdanov-Takens, CP = cusp,
GH = generalized Hopf 共or Bautin兲. Limit points are denoted LP. The curves
are parametrized by the intensity of subthreshold currents  and the leak
conductance gl, both starting on the ordinate and increasing along the
curves. The line changing between solid and dashed is the one-parameter
continuation in  of the equilibrium shown in Fig. 12. The solid line segment marks the stability region of the equilibrium, while the dashed segment
marks its unstable region.
Downloaded 24 Jan 2011 to 137.248.201.151. Redistribution subject to AIP license or copyright; see http://chaos.aip.org/about/rights_and_permissions
045107-9
On the role of subthreshold currents
A curve ending at the left border thus means that at this
point, both continuation parameters are equal to zero. Both
parameters generally increase along the curves, except for
the limit point curve, where the parameters increase to the
point labeled CP and decrease again afterward. The advantage of this representation over the classical representation
共where the bifurcation parameters constitute abscissa and ordinate of the diagram兲 is that in the particular scenario studied here, it catches all qualitative aspects of the involved
bifurcations in an optically manageable diagram with clear
separations between the distinct curves.
For a thorough discussion of the phenomena, it is sufficient to look at the special points that have a connection to
bifurcations of the stable segments of the equilibrium curve.
Those special points connected with the unstable segment
between the first and last Hopf bifurcations, which mark the
onset and end of spiking, cannot be observed in the simulations and may thus be discarded.
We first look at the curve which changes from solid to
dashed and back at the two Hopf bifurcations H. This curve
is the result of a one-parameter continuation varying the
strength of subthreshold currents  only. It corresponds to
the bifurcation diagrams presented in Figs. 12 and 13. The
solid line denotes the stable equilibrium which loses its stability at the Hopf bifurcation. It undergoes two turning points
共limit points LP兲 and regains stability in the second Hopf
bifurcation. Second, we look at the two-parameter continuations of the saddle-node bifurcation point and the Hopf point.
The saddle-node bifurcation generates a cusp bifurcation of
codimension of 2 at the point labeled CP at which the two
saddle-node bifurcations merge. At the point labeled BT in
the diagram, the two purely imaginary eigenvalues of the
Hopf bifurcation coincide at the origin of the complex plane,
leaving two real negative eigenvalues and one zero eigenvalue of algebraic multiplicity of 2. The resulting bifurcation
is thus of codimension of 2 and known as the Bogdanov–
Takens bifurcation.38 This bifurcation point lies at the tangential intersection of the Hopf and saddle-node bifurcation
curves. The curve of Hopf bifurcation ends at this point: To
the right of this bifurcation, this curve marks the event of a
Hopf bifurcation, with two purely imaginary eigenvalues and
two real negative eigenvalues of the Jacobian. To the left of
the Bogdanov–Takens point, we find four real eigenvalues,
three of them negative and one of them positive. Those two
eigenvalues becoming zero at the BT-point are equidistant to
zero positive and negative, while two other eigenvalues remain negative throughout. This means that for parameter values below the Bogdanov–Takens bifurcation, we encounter a
saddle equilibrium along the curve. The Bogdanov–Takens
point is thus the ”birthplace“ of the Hopf bifurcations in this
model.
The curve of saddle-node bifurcation is characterized by
one eigenvalue being equal to zero. Crossing the Bogdanov–
Takens point, the eigenvalue which had been zero before
becomes nonzero, while another eigenvalue which had been
nonzero before the BT-point now becomes zero along the
curve. 共Recall that the Bogdanov–Takens bifurcation is indicated by two eigenvalues coinciding in the origin of the complex plane.兲 Additionally, a curve of homoclinic bifurcations
Chaos 20, 045107 共2010兲
emerges at the Bogdanov–Takens point which corresponds to
the one discussed above.
Following the Hopf curve further toward higher values
of the control parameters, i.e., further to the right in Fig. 14,
we encounter a generalized Hopf 共or Bautin兲 bifurcation,
labeled GH. This bifurcation is characterized by a Jacobian
having two purely imaginary eigenvalues and additionally by
the condition that the first Lyapunov coefficient becomes
zero. This point marks the transition between sub- and supercritical Hopf bifurcations: For the equilibrium curve intersecting the Hopf curve left of the Bautin point, the first
Lyapunov coefficient is positive corresponding to a subcritical Hopf bifurcation 共cf. Fig. 13兲, while we encounter a supercritical Hopf bifurcation of the equilibrium right of the
Bautin point where the first Lyapunov coefficient is negative.
In the model, the supercritical Hopf bifurcation marks the
extinction of spiking: The neuron becomes silent hereafter.
IV. SUMMARY
This work analyzes the decomposition of the fourdimensional Huber–Braun cold receptor model into a subthreshold and a spiking subsystem and elucidates the highly
functional role of subthreshold currents for the dynamical
state of the neuron. While the model we study here has
proven to be extremely versatile and has become widely
used, a theoretical description of its basic mechanisms has
not been available so far. This work intends to be a step
toward filling this gap. At the same time, we propose and
study a mechanism via intensity control of subthreshold currents which is accessible experimentally to alter the dynamical state of the neuron. We first perform a decomposition of
the system into a subthreshold and a spiking subsystem, the
dynamics of which are then analyzed. We demonstrate that
the spiking subsystem is resting on a stable equilibrium
throughout the whole temperature range and is excitable. We
furthermore find that the subthreshold system exhibits stable
oscillatory behavior in the physiologically relevant parameter range between 0 and 37 ° C. Thus, coupling these two
systems might suggest that the subthreshold system is acting
as a driving force on the spiking system, constantly kicking it
out of its equilibrium state. We proceed to show that this idea
of a mere drive-response mechanism misses the full picture
because of a nonlinear feedback loop implemented into the
model equations.
Our analysis shows that the temperature dependence affects the slow, subthreshold currents in two ways: First, the
wavelength increases as the temperature decreases. Second,
the amplitude of the subthreshold oscillations decreases as
temperature decreases. The prolongation of the wavelength is
then shown to be the key mechanism behind the spikeadding scenarios in the bursting regime, by means of permitting the spiking system to fit more action potentials into one
subthreshold oscillation cycle with increasing wavelength.
However, this effect seems to play a role only in the bursting
regime, while the second mechanism—amplitude variation
of subthreshold oscillations—governs the neuron’s transition
from silence to spiking behavior and the emergence of different spiking patterns in the tonic-firing and chaotic regimes. In order to elucidate the effect of amplitude variation
Downloaded 24 Jan 2011 to 137.248.201.151. Redistribution subject to AIP license or copyright; see http://chaos.aip.org/about/rights_and_permissions
045107-10
Finke et al.
of the subthreshold oscillations alone, we vary a scalar factor
 accounting for the intensity of subthreshold currents. It
enables us to study the impact of subthreshold currents for
fixed temperature. Therefore, we can perform a bifurcation
analysis revealing only the effects of variation of the strength
of subthreshold currents and, thus, of variation of the amplitude of the subthreshold oscillations.
Since the factor  allows for a continuous increase from
no subthreshold currents 共i.e.,  = 0, only the spiking system
remains兲 to full intensity, we employ numerical continuation
routines on equilibria and bifurcation points to trace the dynamical backbone of our model’s activity. We demonstrate
that the unstable limit cycle emerging from the first Hopf
bifurcation becomes homoclinic to a saddle, and thus disappears. However, another homoclinic bifurcation generates a
stable limit cycle 共and thus interspike intervals兲 of first arbitrarily large and later on moderate period.
One peculiarity about variation of the parameter  is the
occurrence of turning points of the equilibrium at two parameter values. Tracing the first Hopf bifurcation, the first turning point leads to a bifurcation of higher codimension,
namely, the Bogdanov–Takens bifurcation, where additionally to the Hopf bifurcation a homoclinic bifurcation
emerges. The spiking, however, appears due to a second homoclinic bifurcation and terminates in a second Hopf bifurcation.
The results on the role of subthreshold currents for setting the dynamical regime of the neuron presented here may
very well be employed to gain further insight into questions
relating not just to single, isolated cold receptors but also to
systems of several coupled neurons, where influences from
neighboring neurons alter the state of a postsynaptic neuron.
Applications like this are awaiting further research.
ACKNOWLEDGMENTS
C.F. was supported by Grant No. FE 359/10 of the German Science Foundation 共DFG兲. H.A.B. acknowledges support of the EU through the Network of Excellence BioSim,
Grant No. LSHB-CT-2004-005137.
1
T. Schwalger and L. Schimansky-Geier, “Interspike interval statistics of a
leaky integrate-and-fire neuron driven by Gaussian noise with large correlation times,” Phys. Rev. E 77, 031914 共2008兲.
2
H. A. Braun, M. T. Huber, N. Anthes, K. Voigt, A. Neiman, X. Pei, and F.
Moss, “Noise-induced impulse pattern modifications at different dynamical period-one situations in a computer model of temperature encoding,”
BioSystems 62, 99–112 共2001兲.
3
B. Lindner and L. Schimansky-Geier, “Analytical approach to the stochastic FitzHugh-Nagumo system and coherence resonance,” Phys. Rev. E 60,
7270–7276 共1999兲.
4
A. L. Hodgkin and A. F. Huxley, “A quantitative description of membrane
current and its application to conduction and excitation in nerve,” J.
Physiol. 共Paris兲 117, 500–544 共1952兲.
5
L. F. Abbott, “Lapicques introduction of the integrate-and-fire model neuron 共1907兲,” Brain Res. Bull. 50, 303 共1999兲.
6
E. M. Izhikevich, Dynamical Systems in Neuroscience: The Geometry of
Excitability and Bursting 共MIT Press, Cambridge, MA, 2007兲.
7
R. Llinas and Y. Yarom, “Oscillatory properties of guinea-pig inferior
olivary neurones and their pharmacological modulation: An in vitro
study,” J. Physiol. 共Paris兲 376, 163–182 共1986兲.
8
A. Alonso and R. Llinas, “Subthreshold Na+-dependent theta-like rhythmicity in entorhinal cortex layer II stellate cells,” Nature 共London兲 342,
175–177 共1989兲.
Chaos 20, 045107 共2010兲
9
N. Agrawal, B. N. Hamam, J. Magistretti, A. Alonso, and D. S. Ragsdale,
“Persistent sodium channel activity mediates subthreshold membrane potential oscillations and low-threshold spikes in rat entorhinal cortex layer
V neurons,” J. Gen. Physiol. 114, 491–509 共1999兲.
10
P. B. Manis, S. C. Molitor, and H. Wu, “Subthreshold oscillations generated by TTX-sensitive sodium currents in dorsal cochlear nucleus pyramidal cells,” Exp. Brain Res. 153, 443–451 共2003兲.
11
M. T. H. Do and B. P. Bean, “Subthreshold sodium currents and pacemaking of subthalamic neurons: Modulation by slow inactivation,” Neuron
39, 109 共2003兲.
12
E. Fransen, A. A. Alonso, C. T. Dickson, J. Magistretti, and M. E.
Hasselmo, “Ionic mechanisms in the generation of subthreshold oscillations and action potential clustering in entorhinal layer ii stellate neurons,”
Hippocampus 14, 368 共2004兲.
13
D. Huangfu and P. G. Guyenet, “Autoactivity of A5 neurons: role of subthreshold oscillations and persistent Na+ current,” Am. J. Physiol. Heart
Circ. Physiol. 273, 2280–2289 共1997兲.
14
J. A. White, T. Budde, and A. R. Kay, “A bifurcation analysis neuronal
subthreshold oscillations,” Biophys. J. 69, 1203–1217 共1995兲.
15
H. A. Braun, K. Schäfer, K. Voigt, and M. T. Huber, Nova Acta Leopoldina NF 88 332: Nonlinear Dynamics and the Spatiotemporal Principles in Biology 共Wissenschaftliche Verlagsgesellschaft, Stuttgart, 2004兲,
pp. 293–318.
16
H. A. Braun, K. Voigt, and M. T. Huber, “Oscillations, resonances and
noise: Basis of flexible neuronal pattern generation,” BioSystems 71,
39–50 共2003兲.
17
C. Finke, S. Postnova, J. Vollmer, and H. A. Braun, “Propagation effects
of current and conductance noise in a model neuron with subthreshold
oscillations,” Math. Biosci. 214, 109–121 共2008兲.
18
C. Finke, S. Postnova, E. Rosa, J. A. Freund, M. T. Huber, K. Voigt, F.
Moss, H. A. Braun, and U. Feudel, “Noisy activation kinetics induces
bursting in the Huber-Braun neuron model,” Eur. Phys. J. Spec. Top. 187,
199–203 共2010兲.
19
S. Postnova, K. Voigt, and H. A. Braun, “Neural synchronization at tonicto-bursting transitions,” J. Biol. Phys. 33, 129–143 共2007兲.
20
H. A. Braun, M. Dewald, K. Schäfer, K. Voigt, X. Pei, and F. Moss, “Low
dimensional dynamics in sensory biology II: Facial cold receptors of rats,”
J. Comput. Neurosci. 7, 17–32 共1999兲.
21
D. A. McCormick and H. R. Feeser, “Functional implications of burst
firing and single spike activity in lateral geniculate relay neurons,” Neuroscience 39, 103–113 共1990兲.
22
M. Dewald, N. Anthes, H. Vedder, K. Voigt, and H. A. Braun, “Phasic
bursting activity of paraventricular neurons is modulated by temperature
and angiotensin II,” J. Therm. Biol. 24, 339–345 共1999兲.
23
Y. Gutfreund, Y. Yarom, and I. Segev, “Subthreshold oscillations and resonant frequencies in guinea-pig cortical neurons: Physiology and modelling,” J. Physiol. 共Paris兲 483, 621–640 共1995兲.
24
K. Schäfer, H. A. Braun, and L. Kürten, “Analysis of cold and warm
receptor activity in vampire bats and mice,” Pflugers Arch. 412, 188–194
共1988兲.
25
H. A. Braun, H. Wissing, K. Schäfer, and M. C. Hirsch, “Oscillation and
noise determine signal transduction in shark multimodal sensory cells,”
Nature 共London兲 367, 270–273 共1994兲.
26
H. Hensel, K. H. Andres, and M. von Düring, “Structure and function of
cold receptors,” Pflugers Arch. 352, 1–10 共1974兲.
27
R. Gilmore, X. Pei, and F. Moss, “Topological analysis of chaos in neural
spike train bursts,” Chaos 9, 812–817 共1999兲.
28
W. Braun, B. Eckhardt, H. A. Braun, and M. T. Huber, “Phase space
structure of a thermoreceptor,” Phys. Rev. E 62, 6352–6360 共2000兲.
29
U. Feudel, A. Neiman, X. Pei, W. Wojtenek, H. A. Braun, M. T. Huber,
and F. Moss, “Homoclinic bifurcations in a Hodgkin-Huxley model of
thermally sensitive neurons,” Chaos 10, 231–239 共2000兲.
30
O. V. Sosnovtseva, S. Postnova, E. Mosekilde, and H. A. Braun, “Interpattern transition in a bursting cell,” Fluct. Noise Lett. 4, L521–L533
共2004兲.
31
S. Bahar, “Burst-enhanced synchronization in an array of noisy coupled
neurons,” Fluct. Noise Lett. 4, L87–L96 共2004兲.
32
S. Postnova, B. Wollweber, K. Voigt, and H. A. Braun, “Impulse-pattern in
bidirectionally coupled model neurons of different dynamics,” BioSystems
89, 135–142 共2007兲.
33
C. Zhou and J. Kurths, “Noise-induced synchronization and coherence
resonance of a Hodgkin-Huxley model of thermally sensitive neurons,”
Chaos 13, 401–409 共2003兲.
34
H. A. Braun, H. Bade, and H. Hensel, “Static and dynamic discharge
Downloaded 24 Jan 2011 to 137.248.201.151. Redistribution subject to AIP license or copyright; see http://chaos.aip.org/about/rights_and_permissions
045107-11
On the role of subthreshold currents
patterns of bursting cold fibers related to hypothetical receptor mechanisms,” Pflugers Arch. 386, 1–9 共1980兲.
35
B. Hille, Ionic Channels of Excitable Membranes 共Sinauer Associates,
Sunderland, MA, 2001兲.
36
AUTO, software for continuation and bifurcation problems in ordinary differential equations, http://cmvl.cs.concordia.ca/auto/.
Chaos 20, 045107 共2010兲
37
continuation software in MATLAB, http://sourceforge.net/projects/
matcont/.
38
A. Yuri, Kuznetsov, Elements of Applied Bifurcation Theory 共Springer,
New York, 1998兲.
MATCONT,
Downloaded 24 Jan 2011 to 137.248.201.151. Redistribution subject to AIP license or copyright; see http://chaos.aip.org/about/rights_and_permissions
Keep reading this paper — and 50 million others — with a free Academia account
Used by leading Academics

Alexandros Karam
National Institute of Chemical Physics and Biophysics

Florentin Smarandache
University of New Mexico

Francisco Caruso
Centro Brasileiro de Pesquisas Físicas

Taro Kimura
Université de Bourgogne