High quality factor silica microspheres
functionalized with self-assembled
nanomaterials
Ishac Kandas,1,2,* Baigang Zhang,1 Chalongrat Daengngam,3 Islam Ashry,1,2 Chih-Yu
Jao,3 Bo Peng,4 Sahin K. Ozdemir,4 Hans D. Robinson,3 James R. Heflin,3 Lan Yang,4
and Yong Xu1,5
1
The Bradley Department of Electrical and Computer Engineering, Virginia Tech, Blacksburg, Virginia 24061,
USA.
2
Department of Engineering Mathematics and Physics, Faculty of Engineering, Alexandria University, Alexandria
21526, Egypt
3
Department of Physics, Virginia Tech, Blacksburg, Virginia 24061, USA.
4
Department of Electrical and Systems Engineering, Washington University in St. Louis, Missouri 63130, USA.
5
yong@vt.edu
*
ishac@vt.edu
Abstract: With extremely low material absorption and exceptional surface
smoothness, silica-based optical resonators can achieve extremely high
cavity quality (Q) factors. However, the intrinsic material limitations of
silica (e.g., lack of second order nonlinearity) may limit the potential
applications of silica-based high Q resonators. Here we report some results
in utilizing layer-by-layer self-assembly to functionalize silica microspheres
with nonlinear and plasmonic nanomaterials while maintaining Q factors as
high as 107. We compare experimentally measured Q factors with
theoretical estimates, and find good agreement.
©2013 Optical Society of America
OCIS codes: (060.3510) Lasers, fiber; (140.4780) Optical resonators.
References and links
1.
2.
3.
4.
5.
6.
7.
8.
9.
10.
11.
12.
13.
M. L. Gorodetsky, A. A. Savchenkov, and V. S. Ilchenko, “Ultimate Q of optical microsphere resonators,” Opt.
Lett. 21(7), 453–455 (1996).
A. B. Matsko and V. S. Ilchenko, “Optical resonators with whispering-gallery modes-part I: basics,” IEEE J.
Quantum Electron. 12(1), 3–14 (2006).
K. J. Vahala, “Optical microcavities,” Nature 424(6950), 839–846 (2003).
J. Zhu, S. K. Ozdemir, Y.-F. Xiao, L. Li, L. He, D.-R. Chen, and L. Yang, “On-chip single nanoparticle
detection and sizing by mode splitting in an ultrahigh-Q microresonator,” Nat. Photonics 4(1), 46–49 (2010).
H. C. Ren, F. Vollmer, S. Arnold, and A. Libchaber, “High-Q microsphere biosensor - analysis for adsorption of
rodlike bacteria,” Opt. Express 15(25), 17410–17423 (2007).
G. Kozyreff, J. L. Dominguez-Juarez, and J. Martorell, “Nonlinear optics in spheres: from second harmonic
scattering to quasi-phase matched generation in whispering gallery modes,” Laser Photon. Rev. 5(6), 737–749
(2011).
T. J. Kippenberg and K. J. Vahala, “Cavity opto-mechanics,” Opt. Express 15(25), 17172–17205 (2007).
J. D. Suter, Y. Sun, D. J. Howard, J. A. Viator, and X. Fan, “PDMS embedded opto-fluidic microring resonator
lasers,” Opt. Express 16(14), 10248–10253 (2008).
Y. Xu, A. Wang, J. R. Heflin, and Z. Liu, “Proposal and analysis of a silica fiber with large and
thermodynamically stable second order nonlinearity,” Appl. Phys. Lett. 90(21), 211110 (2007).
S. I. Shopova, C. W. Blackledge, and A. T. Rosenberger, “Enhanced evanescent coupling to whispering-galley
modes due to gold nanorods grown on the microresonator surface,” Appl. Phys. B 93(1), 183–187 (2008).
Y. Xu, M. Han, A. Wang, Z. Liu, and J. R. Heflin, “Second order parametric processes in nonlinear silica
microspheres,” Phys. Rev. Lett. 100(16), 163905 (2008).
T. J. Kippenberg, S. M. Spillane, B. Min, and K. J. Vahala, “Theoretical and experimental study of stimulated
and cascaded Raman scattering in ultrahigh-Q optical microcavities,” IEEE J. Quantum Electron. 10(5), 1219–
1228 (2004).
K. A. Willets and R. P. Van Duyne, “Localized surface plasmon resonance spectroscopy and sensing,” Annu.
Rev. Phys. Chem. 58(1), 267–297 (2007).
#191852 - $15.00 USD
Received 6 Jun 2013; revised 1 Aug 2013; accepted 6 Aug 2013; published 27 Aug 2013
(C) 2013 OSA
9 September 2013 | Vol. 21, No. 18 | DOI:10.1364/OE.21.020601 | OPTICS EXPRESS 20601
14. H. S. Choi, X. Zhang, and A. M. Armani, “Hybrid silica-polymer ultra-high-Q microresonators,” Opt. Lett.
35(4), 459–461 (2010).
15. M. A. Santiago-Cordoba, S. V. Boriskina, F. Vollmer, and M. C. Demirel, “Nanoparticle-based protein detection
by optical shift of a resonant microcavity,” Appl. Phys. Lett. 99(7), 073701 (2011).
16. J. L. D. -Juarez, G. Kozyreff, and J. Martorell, “Whispering gallery microresonators for second harmonic light
generation from a low number of small molecules,” Nature Commun. 2, 1–8 (2011).
17. A. Chiasera, Y. Dumeige, P. Feron, M. Ferrari, Y. Jestin, G. N. Conti, S. Pelli, S. Soria, and G. C. Righini,
“Spherical whispering-gallery-mode microresonators,” Laser Photonics Rev. 4(3), 457–482 (2010).
18. A. Garg, R. M. Davis, C. Durak, J. R. Heflin, and H. W. Gibson, “Polar orientation of a pendant anionic
chromophore in thick layer-by-layer self-assembled polymeric films,” J. Appl. Phys. 104(5), 053116 (2008).
19. K. E. Van Cott, M. Guzy, P. Neyman, C. Brands, J. R. Heflin, H. W. Gibson, and R. M. Davis, “Layer-by-layer
deposition and ordering of low molecular weight dye molecules for second order nonlinear optics,” Angew.
Chem. Int. Ed. 41(17), 3236–3238 (2002).
20. J. R. Heflin, M. T. Guzy, P. J. Neyman, K. J. Gaskins, C. Brands, Z. Wang, H. W. Gibson, R. M. Davis, and K.
E. Van Cott, “Efficient, thermally stable, second order nonlinear optical response in organic hybrid
covalent/ionic self-assembled films,” Langmuir 22(13), 5723–5727 (2006).
21. J. Yi, C.-Y. Jao, I. L. N. Kandas, B. Liu, Y. Xu, and H. D. Robinson, “Irreversible adsorption of gold
nanospheres on fiber optical tapers and microspheres,” Appl. Phys. Lett. 100(15), 153107 (2012).
22. D. W. Vernooy, V. S. Ilchenko, H. Mabuchi, E. W. Streed, and H. J. Kimble, “High-Q measurements of fusedsilica microspheres in the near infrared,” Opt. Lett. 23(4), 247–249 (1998).
23. F. P. Payne and J. P. R. Lacey, “A theoretical analysis of scattering loss from planar optical waveguides,” Opt.
Quantum Electron. 26(10), 977–986 (1994).
24. C. Daengngam, M. Hofmann, Z. Liu, A. Wang, J. R. Heflin, and Y. Xu, “Demonstration of a cylindrically
symmetric second-order nonlinear fiber with self-assembled organic surface layers,” Opt. Express 19(11),
10326–10335 (2011).
25. S. Arnold, S. I. Shopova, and S. Holler, “Whispering gallery mode bio-sensor for label-free detection of single
molecules: thermo-optic vs. reactive mechanism,” Opt. Express 18(1), 281–287 (2010).
26. J. D. Jackson, Classical electrodynamics, John Wiley & Sons, Inc., 1998.
27. S. Arnold, M. Khoshsima, I. Teraoka, S. Holler, and F. Vollmer, “Shift of whispering-gallery modes in
microspheres by protein adsorption,” Opt. Lett. 28(4), 272–274 (2003).
28. C. F. Bohren and D. R. Huffman, Absorption and Scattering of Light by Small Particles (John Wiley & Sons,
Inc., 1998).
29. I. Teraoka and S. Arnold, “Theory of resonance shifts in TE and TM whispering gallery modes by nonradial
perturbations for sensing applications,” J. Opt. Soc. Am. B 23(7), 1381–1389 (2006).
30. P. B. Johnson and R. W. Christy, “Optical constants of the noble metals,” Phys. Rev. Lett. B 6, 4370–4379
(1972).
31. L. He, S. K. Ozdemir, J. Zhu, F. Monifi, H. Yilmaz, and L. Yang, “Statistics of multiple-scatterer-induced
frequency splitting in whispering gallery microresonators and microlasers,” New J. Phys. 15(7), 073030 (2013).
1. Introduction
Recently, silica-based optical whispering gallery modes (WGMs) micro-resonators have
drawn much attention [1–4]. In such resonators, optical confinement is provided by total
internal reflection at the circular boundary of the resonators. Due to the exceptionally low
optical absorption coefficient in silica and the extremely smooth surface morphology of the
resonators, the Q factors of the WGMs can often be as high as 1010 [1]. The high quality
factor has led to many interesting applications in areas such as chemical and biological
sensing [5], nonlinear optics [6], optomechanics [7], and optofluidics [8]. Despite these
advantages, silica-based high Q resonators also face some intrinsic limits. For example, silica
possesses neither second order nonlinearity [9] nor plasmonic resonances [10]. Consequently,
it is difficult to investigate important processes such as second order parametric oscillation
[11] or surface enhanced Raman scattering in such resonators [12,13]. The key to overcome
this deficiency is to develop a versatile method that can functionalize the surface of a silica
microsphere with various nanomaterials while maintaining high cavity Q factors. The goal of
this paper is to characterize an electrostatic self-assembly based approach that can incorporate
different types of functional materials onto the surface of a silica resonator with nanoscale
control of thickness while maintaining high Q factors.
To the best of our knowledge, there are relatively few systematic studies on how to
functionalize silica-based high-Q resonators. Relevant examples include recent
demonstrations of silica high Q resonators coated with polymer [14], gold nanoparticles (Au
#191852 - $15.00 USD
Received 6 Jun 2013; revised 1 Aug 2013; accepted 6 Aug 2013; published 27 Aug 2013
(C) 2013 OSA
9 September 2013 | Vol. 21, No. 18 | DOI:10.1364/OE.21.020601 | OPTICS EXPRESS 20602
NPs) [10,15], and nonlinear molecules [6,16]. The method of self-assembly has several
important advantages. First, by depositing one monolayer of nanomaterial at a time, the selfassembly approach can control the functionalization of silica microspheres with nanoscale
accuracy and maintain exceptional surface smoothness. Second, the self-assembly approach
relies on electrostatic interaction and is therefore compatible with a wide range of
nanomaterials including nonlinear molecules, dyes, quantum dots, and plasmonic NPs. By
selecting appropriate aqueous solutions for self-assembly, we can therefore incorporate a
large variety of functional materials onto the same microsphere, which can be difficult to
accomplish with alternative approaches. Finally, the self-assembly process is simple,
straightforward, and can be carried out without using any specialized equipment or clean
room facilities.
In this paper, we consider two types of functional materials. The first is polar ionic selfassembled multilayer (ISAM) films that possess second order nonlinearities, and the second is
Au NPs that support plasmonic resonances. We fabricated multiple functional microspheres
with different ISAM film thickness and Au NPs density. We find that the Q factors of these
microspheres are mainly limited by optical absorption in the case of the ISAM film, and
optical absorption /scattering in the case of the Au NPs. By controlling the number of
polymer layers or the NP density, we can adjust the Q factors of these functional
microspheres in the range of 106 to 107. The results in this paper may also be generalized to
other functional materials including various macromolecules, dyes, and non-spherical
plasmonic NPs.
2. Sample fabrication and experimental setup
We fabricated silica microspheres using the procedure described in [17]. Briefly, we placed a
silica fiber between two fiber clamps attached to a computer-controlled motion stage. We
then used a focused high-power CO2 laser beam to melt the silica fiber. After stretching and
melting the fiber, a microsphere naturally formed from the molten silica due to surface
tension. The fabrication parameters were adjusted to obtain microsphere diameters in the
range of 240-260 µm.
After microsphere fabrication, we coated the silica surface with two different ISAM films
that possess second order nonlinear susceptibilities. The first was composed of alternating
layers of (poly (allylamine hydrochloride)) (PAH) and (poly {1-[p-(3′-carboxy-4’hydroxyphenylazo) benzenesulfonamido]-1, 2-ethandiyl} (PCBS) and the second composed
of PAH and Procion Brown (PB). ISAM films of PAH/PCBS and PAH/PB have been shown
to possess net polar order and as a result, can produce substantial second order nonlinear
susceptibilities [18,19]. To incorporate multiple layers of nonlinear polymers onto the silica
microsphere, we can use the self-assembly procedure as follows. First, we placed the
microsphere in the positively charged polycation (PAH) solution for 3 minutes followed by 2
minutes of rinsing in deionized (DI) water (the rinsing process remove excess polymer and
therefore ensure uniform PAH coverage). Afterwards, we placed the microsphere in the
negatively-charged polyanion solution containing PCBS (or PB) for 3 minutes to cover the
PAH layer with a monolayer of PCBS (or PB). This step is again followed by 2 minutes DI
water rinsing to remove any residual polyanion. Because the self-assembly relies on
electrostatic interaction, the process is self-limiting, and each polymer layer with a welldefined thickness (typically 0.3 - 10.0 nm dependent on solution pH and ionic strength) is
added at each deposition step. As a result, the resulting bilayer is very uniform, and can have
a thickness of 1 nm or less. This process can be repeated as many times as desired to reach the
desired ISAM film thickness. For this experimental study, PAH, PCBS and PB were
purchased from Sigma-Aldrich. The concentrations and the pH values are respectively 0.93
mg/mL and PH ~7 for PAH solution, 3.7 mg/mL and pH ~7 for PCBS solution, and 1 mg/mL
and pH ~10.5 for PB solution. For the fabrication of PAH/PB ISAM films, we added sodium
chloride into the PB solution at a concentration of 30 mg/mL. The Na+ ions screen the
#191852 - $15.00 USD
Received 6 Jun 2013; revised 1 Aug 2013; accepted 6 Aug 2013; published 27 Aug 2013
(C) 2013 OSA
9 September 2013 | Vol. 21, No. 18 | DOI:10.1364/OE.21.020601 | OPTICS EXPRESS 20603
repulsions of the negatively-charged polyanion, thus enabling close packing of PB on the
surface [20].
The assembly of Au NPs was carried out using the same principle. We first coated the
silica microsphere with a monolayer of positively-charged PAH. Then we placed the PAHcoated microsphere in an aqueous solution containing negatively-charged Au NPs (30 nm in
diameter, British Biocell International). The density of Au NPs adsorbed on the microsphere
surface can be readily adjusted by controlling deposition time. (In [21], more details can be
found, which also provided an analytical model that describes the density of adsorbed Au NPs
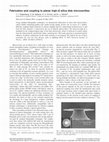
as a function of deposition time). Figure 1 shows scanning electron microscope (SEM)
images of two functional microspheres, one coated with 20 bilayers of PAH/PB, and the other
covered with Au NPs. As we can see from the SEM images, the fabrication procedure
described above can produce functional microspheres with very smooth surface morphology.
Fig. 1. SEM images of a microsphere coated with (a) 20 bilayers of PAH/PB. (b) Au NPs
deposited for 20 minutes.
3. Experimental characterization and analysis
The WGMs within the functionalized microspheres were characterized using the experimental
setup shown in Fig. 2(a). The output of a tunable laser diode (New Focus velocity 6300) was
coupled into the microsphere using a ~1 µm diameter fiber, which was fabricated using the
flame heating method described in [17]. The wavelength of the tunable laser was controlled
using the voltage signal produced by a function generator, where the 2 V (peak to peak)
signal corresponded to a 0.16 nm tuning range. The photodetector converted the optical
signals in the taper (after microsphere transmission) into electronic signals. The transmission
spectra were then recorded by the oscilloscope. We used a fiber paddle to adjust the
polarization state of the laser light in order to excite the WGMs with the highest Q factor. A
representative example of WGM transmission spectrum is shown in Fig. 2(b), which includes
a WGM with a Q factor of ~1.5×10⁷ obtained using a microsphere coated with a monolayer of
PAH. From the measured transmission spectra, we can calculate WGM Q factors using [17]
Q=
λR
Δλ
(1)
where λR and ∆λ are the central wavelength and the full width at half maximum of the
measured transmission dips, respectively. For this paper, all Q factor measurements were
carried out near 1550 nm and within a 0.16 nm scanning range. Furthermore, we always
adjusted the polarization state of the input laser light to find the WGMs with the highest Q
factors. If multiple WMGs were found within the 0.16 nm scanning range, we recorded the
mode with the highest Q factor.
#191852 - $15.00 USD
Received 6 Jun 2013; revised 1 Aug 2013; accepted 6 Aug 2013; published 27 Aug 2013
(C) 2013 OSA
9 September 2013 | Vol. 21, No. 18 | DOI:10.1364/OE.21.020601 | OPTICS EXPRESS 20604
Fig. 2. (a) The experimental system for measuring the Q factors of functionalized silica
microspheres. (b) Transmission spectrum of a silica microsphere coated with a monolayer of
PAH.
3.1 Functional microspheres coated with ISAM films
The optical loss in a functional microsphere can come from several sources including optical
absorption and Rayleigh scattering in silica, absorption in the ISAM film, scattering due to
surface roughness, and taper-microsphere coupling [1,17]. Their contribution for cavity Q
factors can be respectively represented by Qsilica, Qfilm, Qss, and Qcoupling. Given the large
microsphere sizes (~250 µm), we can safely ignore the contribution due to radiation losses,
which are exceedingly small when the ratio of microsphere diameter to resonator wavelength
is greater than 15 [17]. We can then write the total cavity Q factor as
1
1
1
1
1
≈
+
+
+
Q Qsilica Q film Qss Qcoupling
(2)
Qsilica can reach 1011 when the resonance wavelength is around 1550 nm [17]. In contrast, as
shown in Fig. 2(b), the experimentally measured Q factor of the functional microspheres can
reach ~1.5×10⁷. Hence silica absorption should not be the main limiting factor. Another
source for cavity loss is surface scattering of the ISAM film. According to [22], the Q factor
due to surface scattering (Qss) can be estimated as:
Qss =
3ε (ε + 2) 2 (λR )7/2 D1/2
4π 3 (ε − 1)5/2 σ 2 B 2
(3)
where ε is material permittivity, D is the diameter of the microsphere, σ is the root-meansquare (rms) of the microsphere surface height variations and quantifies surface roughness,
and B represents the correlation length of the random surface height variations.
#191852 - $15.00 USD
Received 6 Jun 2013; revised 1 Aug 2013; accepted 6 Aug 2013; published 27 Aug 2013
(C) 2013 OSA
9 September 2013 | Vol. 21, No. 18 | DOI:10.1364/OE.21.020601 | OPTICS EXPRESS 20605
In Fig. 3(a), we show the surface profile of a microsphere coated with 20 bilayers of
PAH/PCBS obtained using an atomic force microscope (AFM) If we use h(x, y) to denote
surface height measured by AFM, we can define its correlation function
as R (u ) = h( x, y )h( x + u, y )dxdy . The correlation length B can then be extracted by fitting
the correlation function to R(u) = R(0)exp[-(u/B)2] [23]. In Fig. 3(b), we show the
experimentally obtained R(u) as well as its fit to a gaussian form with B = 11 nm. Table 1
summarizes the data for different bilayer numbers of PAH/PCBS. The data include rms
roughness, correlation length, and the corresponding estimate for Qss as given by Eq. (3).
From the results in Table 1, Qss for microspheres coated with PAH/PCBS should be on order
of 1010 to 1011. This result suggest that for microspheres coated with PAH/PCBS, cavity loss
is likely dominated by material absorption within the ISAM film and / or taper-microsphere
coupling loss. Due to the difficulty of carrying out AFM measurements on a curved surface of
mechanically fragile microspheres, we did not carry out similar studies using microspheres
coated with PAH/PB. However, since deposition of PAH/PCBS and PAH/PB are carried out
similarly and both ISAM films possess similarly smooth surface morphology on planar
structures [24], the scattering losses for PAH/PB and PAH/PCBS microspheres are likely to
be of the same order of magnitude.
Fig. 3. (a) The surface profile of a functional microsphere coated with 20 bilayers of
PAH/PCBS. The data was obtained using AFM. (b) The correlation of the surface profile of a
microsphere coated with 5 bilayers of PAH/PCBS. Both experimental data (thin blue line) and
theoretical fitting (thick red line) are shown.
Table 1. The rms surface roughness σ , correlation length B, and surface-scatteringinduced Q factor (Qss) for three functional microspheres with different numbers of
PAH/PCBS bilayer coatings.
Bilayer number
Surface roughness,
(nm)
σ
Correlation length,
B (nm)
Qss
1
0.34
14
1.18 × 10¹¹
5
0.60
11
6.10 × 10¹⁰
20
0.79
22
3.47 × 10¹⁰
To further quantify the relationship between material absorption and cavity Q factors, we
aim to minimize the impact of taper-microsphere coupling loss. To achieve this goal, all
cavity Q factors were measured when the silica microspheres are in direct contact with the
coupling taper. We first measured the Q factors of four different bare silica microspheres
under this direct-contact scenario. The maximum cavity Q factors are respectively 1.73×10⁷,
1.88×10⁷, 1.95×10⁷, and 2.5×10⁷. The average Q factor is ~2×10⁷, with a standard deviation
of 0.34×10⁷. All four bare silica microspheres possess similar diameters (~250 µm). For the
#191852 - $15.00 USD
Received 6 Jun 2013; revised 1 Aug 2013; accepted 6 Aug 2013; published 27 Aug 2013
(C) 2013 OSA
9 September 2013 | Vol. 21, No. 18 | DOI:10.1364/OE.21.020601 | OPTICS EXPRESS 20606
direct-contact cases, the cavity Q factors should be dominated by Qcoupling. Consequently, for
functionalized microspheres with similar diameters, we can approximate their Qcoupling as
~2×10⁷.
The measured Q factors of microspheres coated with different numbers of PAH/PCBS and
PAH/PB bilayers are shown in Fig. 4(a). We also fit the experimentally measured Q factor
versus film thickness t using 1/Q = 1/Qcoupling + A × tα, where Qcoupling, A, and t are fitting
parameters. Here we ignore cavity loss generated by silica absorption and surface scattering
loss, as discussed earlier. In Fig. 4(b), we directly show Qfilm (cavity Q factor due to film
absorption) versus film thickness. The measured Qfilm are obtained by subtracting the Qcoupling
(determined by fitting in (a)) from the measured Q factor (Qcoupling is ~1.96×10⁷ for PAH/PB
and is ~1.93×10⁷ for PAH/PCBS). We note that the fitted Qcoupling is very close to the Qcoupling
of the bare microspheres given in the previous paragraph. The fitting curves are given by
1/Qfilm = A × tα. For PAH/PB, the fitted is +1.10 and for PAH/PCBS is +1.14. A natural
explanation for this result is that cavity loss of the functional microspheres is dominated by
material absorption within the ISAM film. In this scenario, the cavity loss should increase
linearly as a function of the total volume of the polymer coating. Since film thickness is
approximately 1.3 nm per PAH/PB bilayer and 0.9 nm per PAH/PCBS bilayer, the rate of
material absorption, which is represented by 1/Qfilm, should be proportional to the ISAM film
thickness t, i.e., 1/Qfilm ∝ t. This theoretical prediction is very close to our experimental
results. The deviation from the theoretical fitting curve can be explained by several factors.
First of all, the coupling between the fiber taper and the microsphere may not be identical for
different microsphere samples. The geometrical dimensions of different microspheres may
not be identical. The process of ISAM film deposition is not perfect clean, thus some dust
particles may accumulate on the surface of the microsphere and cause the Q factor to drop in
an incontrollable fashion.
Fig. 4. (a) Total Q factors of the functional microsphere versus the self-assembled polymer
layer thickness (t). The experimental data are shown as triangles (for PAH/PB) and dots (for
PAH/PCBS). The theoretical fittings are performed using 1/Q = 1/Qcoupling + A × tα, where
Qcoupling, A, and α are fitting constants. (b) The relationship between film thickness t and Qfilm.
The fitted values are given by1/Qfilm = A × tα. The experimental data are obtained using 1/Qfilm
= 1/Q - 1/Qcoupling..
3.2 Functional microspheres coated with Au
To investigate the impact of Au NPs on WGM Q factors, we fabricated multiple microsphere
samples covered with different amount of Au NPs. We can readily control the density of Au
NPs by adjusting the duration of the self-assembly process, (i.e., deposition time). After
sample fabrication, the Q factors of the microspheres covered with Au NPs were measured
using the experimental system illustrated in Fig. 2(a). Subsequently, we took SEM images of
the microsphere samples, and obtained NPs density from the SEM images. The measured
microsphere Q factors were plotted as a function of NPs density, and shown in Fig. 5(b). As
#191852 - $15.00 USD
Received 6 Jun 2013; revised 1 Aug 2013; accepted 6 Aug 2013; published 27 Aug 2013
(C) 2013 OSA
9 September 2013 | Vol. 21, No. 18 | DOI:10.1364/OE.21.020601 | OPTICS EXPRESS 20607
expected, the cavity Q factors decrease as NP density increases. We can use the following
theoretical model to describe the relationship between cavity Q factors and NPs density.
Let us first estimate the cavity Q factors associated with the self-assembled Au NPs (i.e.,
QNP). According to the definition of quality factors, we have:
QNP = ω
W
PNPs
(4)
where ω is the angular frequency, PNPs represents optical power loss induced by NPs
scattering and absorption. W is the total energy stored within WGM, and can written as [25]
W=
2
1
ε oε r E WGM ( r, θ , φ ) dV
2
(5)
where εo is the free space permittivity, εr is silica dielectric constant, and E WGM is the electric
field of the WGM . To simplify theoretical analysis, we consider only TE modes, which leads
to
W=
2
1
ε ε [S(r)]2 dr X lm (θ , φ ) sin θ dθ dφ
2 o r
2ko
(6)
where X lm (θ , φ ) is the angular vector function of WGM and its expression is explicity given
[S(r)] dr
R
in [26], and S(r) represents radial dependence of the electric field. The integral
2
0
−1
o r
2
can be approximated to ( R / 2)(1 − ε ε )[ S ( R )] [25,27], where R is microsphere radius, and
ko is the free space wavenumber.
According to the definition of extinction cross-section, the power loss pNP caused by a
single Au NP on the silica microsphere surface can be estimated as
2
E WGM ( Ri , θi , φi )
(7)
σ ex.
pNP =
2ηo
where ηo is the free space impedance, E WGM ( Ri , θi , φi ) is the electric field at the location of
the ith NP located on the surface, and σex. is the total extinction cross section area of the Au NP
(includes both scattering and absorption). Assuming NPs are uniformly and randomly
distributed over the microsphere surface, the total scattered and absorbed power from all
particles on the surface, PNPs can then be expressed by
PNPs =
N pσ ex .
2ηo
E
2
WGM
( Ri , θi , φi ) dA
(8)
where N p represents Au NP density. The integration is performed over the entire surface area
A of the microsphere. For randomly distributed NPs, this equation can be simplified to
PNPs =
N pσ ex .
2
[ S ( R )]2 X lm (θ , φ ) sin θ dθ d φ
(9)
2η k
In the case of small Au NPs, the total (extinction) cross section can be written as [28]
2
o o
#191852 - $15.00 USD
Received 6 Jun 2013; revised 1 Aug 2013; accepted 6 Aug 2013; published 27 Aug 2013
(C) 2013 OSA
9 September 2013 | Vol. 21, No. 18 | DOI:10.1364/OE.21.020601 | OPTICS EXPRESS 20608
σ ex.
2
2
2
2
4
2
2
m − 1 x m − 1 m + 27m + 38 8 4
m − 1
= 4π a x Im 2
1 + 2
+ x Re 2
(10)
2m 2 + 3
m + 2 15 m + 2
3
m + 2
2
where m is the ratio of refractive index of the gold nanoparticles and air, and x = 2π a / λ .
After combining Eqs. (4), (6), (9), and (10), we find QNP (generated by NP absorption and
scattering) to be
QNP =
ωε oηo (ε r − 1) R
2 N pσ ex .
(11)
In deriving Eq. (11), We have applied the procedures in [25,27,29]. Based on these results,
the total Q factor of a silica microsphere covered with Au NPs can be estimated as
1
1
1
≈
+
Q QNP Qcoupling
(12)
In deriving Eq. (12), we ignore cavity loss due to silica absorption, which is much smaller
compared with losses due to Au NPs and taper-microsphere coupling. Furthermore, we note
that according to Eq. (11), the NP-induced cavity loss is a simple function of microsphere
radius, NP density, and NP extinction cross-section. Finally, we note that even though Eq.
(11) is derived assuming TE modes, it should be able to provide a resonable estimate for TM
modes. This is because according to Eq. (9), the key factor that determines the NP-induced
cavity loss is the electric field intensity at the microsphere surface, i.e., [S(R)] . Figure 5(a)
show the radial dependence of two comparable TE and TM modes. As can be seen from the
figure, the TE and TM modes have similar radial profiles. This implies that the NP-induced
cavity loss should be of the same orders of magnitude for TE and TM modes.
Figure 5(b) shows the experimentally measured Q factors of NP-coated microspheres with
different NP density. It also includes a theoretical estimate obtained using Eqs. (11) and (12).
It should be mentioned that the theoretical predicted Q factors contain no fitting parameters.
In particular, Qcoupling is taken to be 2 × 10⁷ , similar to that of bare microspheres. The radius
of Au NPs is 15 nm. The refractive index of Au NPs at1550 nm is 0.524 + i 10.72, based on
the data in [30]. Note that we don’t take into account the enhanced absorption and scattering
due to the plasmonic effects since the measurement is done at 1550 nm band, which is far
from the plasmon resonance wavelength of Au [31]. Comparing theoretical predictions with
experimental data, we note that the theoretically predicted Q factors can serve as a reasonable
upper bound for the experimentally results. Furthermore, we note that the theoretically
predicted relationship between cavity Q factor and NP density is reasonably close to the
experimental observed behavior. Such agreement is impressive, considering the fact that our
theoretical predictions contain no free parameters. Finally, we note that the agreement
between theory and experimental data is better for cases with low NP density. There are
several possible explanations. For example, larger NP density corresponds to longer
deposition time, which may potentially lead to more dust particles adsorbed onto the silica
microsphere surface. Additionally, our model does not include the effect of particle
aggregation on the surface. Particle aggregates scatter light much more efficiently than the
individual particles do when separated, and this may also explain why the measured Q factors
are lower than the predicted ones for higher surface particle densities.
#191852 - $15.00 USD
Received 6 Jun 2013; revised 1 Aug 2013; accepted 6 Aug 2013; published 27 Aug 2013
(C) 2013 OSA
9 September 2013 | Vol. 21, No. 18 | DOI:10.1364/OE.21.020601 | OPTICS EXPRESS 20609
.
Fig. 5. (a) The radial dependence of a TE and a TM WGM. In our calculations, the radius of
the microsphere is 125 µ m . The two angular modal numbers are l = m = 715 For the TM
mode, and l = m = 716 For the TE mode. (b) The theoretically predicted and the
experimentally measured cavity Q factors at different NP density levels. The theoretical results
are calculated using Eqs. (11) and (12), and parameters given in the text.
4. Summary
In conclusion, we have investigated the Q factor of silica microsphere coated with thin film of
nonlinear materials such as PB and PCBS as well as with sparsely adsorbed Au NPs. We find
that scattering loss due to surface roughness is much smaller than the film absorption loss. In
particular, the measured Q factors can be attributed two sources: one is taper-microsphere
coupling; the other is optical absorption within the self-assembled polymers. Additionally, we
demonstrate that it is possible to coat bare silica microspheres with 20 bilayers of PAH/PB or
PAH/PCBS while maintaining cavity Q factor in the range of 106. Finally, we analyze the
reduction of cavity Q factor due to Au NPs adsorbed on the microsphere surface, and find
reasonable agreement between theoretical estimates and experimental results.
Acknowledgments
We gratefully acknowledge support by the National Institute of Occupational Safety and
Health (Grant No. 1U60OH009761-01) and the VT-MENA program and the U. S. Army
Research Office under grant number W911NF-12-1-0026 for generous support.
#191852 - $15.00 USD
Received 6 Jun 2013; revised 1 Aug 2013; accepted 6 Aug 2013; published 27 Aug 2013
(C) 2013 OSA
9 September 2013 | Vol. 21, No. 18 | DOI:10.1364/OE.21.020601 | OPTICS EXPRESS 20610
Academia.edu no longer supports Internet Explorer.
To browse Academia.edu and the wider internet faster and more securely, please take a few seconds to upgrade your browser.
High quality factor silica microspheres functionalized with self-assembled nanomaterials
Optics Express, 2013
By James Heflin and Islam Ashry
...Read more
Related Papers
Ultralow Raman lasing threshold and enhanced gain of whispering gallery modes in silica microspheres
Physical Review A, 2012
Download

IEEE Photonics Journal, 2012
Download

Download

Optics Letters, 2001
Download


Optics letters, 2014
Download

Applied Physics Letters, 2003
Download
Download


Download

Silva Kharisma, 2021
Download

Punto Cero año 29 - N° 47, 2023
Download

Journal of Comparative Literature and Aesthetics, 2021
Download

