Vol. 200: 257-264,2000
MARINE ECOLOGY PROGRESS SERIES
Mar Ecol Prog Ser
Published July 14
Foraging ranges, diets and feeding locations of
gannets Morus bassanus in the North Sea: evidence
from satellite telemetry
KC Hamer*, RA Phillips*', S Wanless, MP Harris*", AG Wood""
Department of Biological Sciences, University of Durham, South Road, Durham DHl 3LE, United Kingdom
ABSTRACT: We used satellite telemetry to examine the foraging ranges, feeding locations and travel
speeds of 17 chick-rearing gannets Morus bassanus from the Bass Rock, SE Scotland. Regurgitates
indicated that birds at the colony exploited a wide range of prey, frequently including 0-group
sandeels (<l0 cm in length) and mature mackerel and herring (up to 33 cm) in the diet. The maximum
foraging range was 540 km, and the mean distance to the furthest point from the colony on any one
trip was 232 km. Destinations of foraging trips covered a wide area of the North Sea, with a nonrandom distribution and a higher than expected proportion of trips to the NE (generally in the vicinity
of Buchan Deep and Halibut Bank) and to the SE (mostly between Farne Deep, Dogger Bank and
Outer Silver Pit) of the colony. Foraging trips lasted 13 to 84 h, and trip duration explained 94 % of the
variance in maximum distance from the colony, indicating that distance travelled could be predicted
with a high degree of accuracy from time spent at sea. However, the average speed of travel during
foraging trips (15 km h-') was considerably lower than maximum ground speed (-55 km h-' in most
cases). The results of this study suggest that gannets breeding at the Bass Rock utilize a wide range
of species and sizes of prey over a large area of the North Sea, and that they focus their activity on
bathymetric features that are probably associated with high primary production. Further data are
now required to examine the foraging ranges and feeding locations of gannets in different oceanographic regions in order to obtain a broader understanding of how gannets make use of different
marine environments.
KEY WORDS: Pelecaniformes . Marine distribution . Sandeel . Bathymetry . Flight speed
INTRODUCTION
Recent concern over the roles of seabirds in marine
ecosystems and their interactions with industrial and
commercial fisheries has highlighted the need for
detailed information on the prey and foraging locations
of different species (Tasker & Furness 1996, Weimerskirch et al. 1999, Thompson & Hamer 2000). Landbased studies have provided data on diets and prey
'E-mail: k.c.hamer@durham.ac.uk
Present addresses:
"Wildfowl & Wetlands Trust, Caerlaverock DG1 4RS, UK
"'NERC Institute for Terrestrial Ecology, Hill of Brathens,
Banchory AB3 1 4BY, UK
""NERC British Antarctic Survey, Madingley Road, Cambridge CB3 OET, UK
@ Inter-Research 2000
Resale of fuLl article not permitted
harvests (Montevecchi et al. 1992, Phillips et al. 1999),
and conventional radio-telemetry has provided information on foraging ranges and feeding sites of inshore
feeders (Hamer et al. 1993, Monaghan et al. 1994,
Wanless et al. 1997).However, in most cases the movements of pelagic species at sea are only poorly understood. Satellite telemetry provides a means of tracking
pelagic species, but to date this technique has been
restricted mainly to albatrosses, petrels and penguins
in the southern hemisphere (Jouventin & Weimerskirch 1990, Weimerskirch et al. 1997, Kooyman et al.
1999, Prince et al. 1999, but see Falk & M ~ l l e r1995).
The northern gannet Morus bassanus is the largest
pelagic seabird breeding in the North Atlantic (adult
body mass = ca 3 kg; Nelson 1978) and has high massspecific energy requirements, resulting in part from
high energy expenditure during flight (Birt-Friesen et
�258
Mar Ecol Prog Se
al. 1989). The main prey of gannets are lipid-rich
pelagic fish such as mackerel Scomber scombrus, herring Clupea harengus and sandeel Ammodytes marinus (Wanless 1984, Martin 1989). Gannets also compete effectively with other seabird species for discards
from commercial fishing vessels (Garthe & Hiippop
1994, Camphuysen et al. 1995). Tasker & Furness
(1996)estimated conservatively that the annual energy
requirement of gannets (including non-breeders but
excluding nestlings) in the North Sea was almost 10 %
of the total across all seabirds. Despite their relatively
small world population, gannets thus have an important potential impact on marine food chains. Moreover
they are currently increasing in terms of both population size and geographical distribution (Montevecchi &
Myers 1997, Murray & Wanless 1997), indicating that
this impact is likely to increase further in the future.
A knowledge of the foraging ranges anii feeding
locations of gannets is essential for quantifying their
predator-prey dynamics and for accurately assessing
their trophic interactions with industrial fisheries and
their likely exposure to risks such as oil pollution and
entanglement in fishing gear (Thompson & Hamer
2000). However very little is currently known about the
movements of gannets at sea or their foraging ranges.
Nelson (1978) suggested a range of 320 to 480 km from
a colony for breeding birds, based on observed trip
durations and assuming continuous flight at 65 to
80 km h-', but made no allowance for time spent feeding or resting on the surface, or for deviations from a
straight line course. More recently, Tasker et al. (1985)
concluded from ship-based surveys that foraging trips
rarely exceeded 150 km from a colony, and that most
trips were within 40 km. However, this was likely to be
an underestimate, since birds seen at sea were always
assumed to be from the nearest breeding colony and
because birds feeding in the vicinity of a colony were
not distinguished from those commuting between the
colony and more distant feeding sites.
One of the largest populations of gannets is on the
Bass Rock in the Firth of Forth, SE Scotland (56"6' N,
2'36'W). This colony currently contains more than
70000 breeding adults plus several thousand nonbreeders, and is increasing at -5 % per annum, in common with colonies elsewhere (Murray & Wanless
1997). During the early 1960s, birds at the Bass Rock
fed principally on mackerel (Nelson 1966), but more
recent data are not available. There is currently a large
fishery for sandeels on the Banks (Wee Bankie and
Marr Bank) about 40 km from the Bass Rock, and concern has been expressed about potential adverse
effects of this fishery on local seabirds, including possibly gannets (Wanless et al. 1998). However, it is not
known to what extent birds from the Bass Rock currently rely on sandeels as prey or on the Banks as a for-
aging location. Based on flight direction, Camphuysen
et al. (1995) suggested that birds observed at the Dogger Bank in the central North Sea in May 1994 were
from the Bass Rock, but it was not known whether or
not these birds were breeding or how regularly birds
from the Bass Rock might feed at this site. Breeding
birds may have more restricted distributions, making
them more sensitive to localized fluctuations In food
supply, especially when constra~nedby the need to
provision offspring, but this is not currently known.
This paper provides quantitative information on the
diets of gannets at the Bass Rock and uses satellite
telemetry to determine the foraging ranges and feeding locations of birds at sea and to estimate both maximum and net travel speeds during foraging trips. To
our knowledge this is the first time that satellite
telemetry has been used with any seabird during the
nestling period in the North Atlantic.
MATERIALS AND METHODS
Diet. Fieldwork on the Bass Rock took place between
14 June and 28 August 1998. Diet was assessed from
regurgitates from adult Morus bassanus. To minimize
disturbance, most (246 of 266) samples were collected
from birds at the periphery of the colony, the majority
of which were likely to be non-breeders. Comparisons
of the frequency of occurrence of the main prey items
in these samples with 20 known to have come from
adults with chicks revealed no evidence of any significant differences in diet between the 2 groups (all x2
tests, p > 0.05).
Regurgitates were collected over a period of 2 to 3 d
on each of 6 occasions, spanning the majority of the
chick-rearing period at the colony. Each regurgitate
was stored separately in a sealed polythene bag and
transported to the laboratory, where it was weighed to
the nearest g; the prey were identified either visually
or from sagittal otoliths and vertebrae extracted from
the sample (Harkonen 1986, Watt et al. 1997, authors'
pers. obs.). Body length was measured to the nearest
cm (mm for sandeels) or, where this was not possible,
was estimated using species-specific body length/
otolith or vertebra length relationships (Harkonen
1986, Watt et al. 1997, authors' pers. obs.). In addition,
sandeels were aged by the absence (0-group) or presence (older age groups) of annual growth rings in the
otoliths (Anonymous 1995).Dietary data are presented
in terms of both frequency of occurrence and the proportions of the total biomass comprised by the different
species.
Satellite-tracking of adults. One chick-rearing adult
from each of 17 nests with hatching dates 22 wk from
the mode was captured at the nest using a roach pole
�Hamer et al.: Foraging by gannets
with a brass noose. A platform terminal transmitter
(PTT; Microwave Telemetry Inc., Columbia, USA)
weighing 30 g (-1 % of adult mass) and with a dutycycle of continuous transmission was then attached
with self-amalgamating tape (RS Components, Newcastle, UK) to the underside of the 4 central tail feathers, close to the base of the tail, with the aerial pointing
upwards through the feathers. This arrangement minimized drag during flight and prevented tags being displaced during plunge-diving. Attachment of tags took
-5 min, and after release every bird returned to the
nest almost immediately. Each bird was then tracked
for 14 to 21 d (mean = 16 d) over a period of 45 d
(11 July to 25 August 1998), after which the tag was
removed and the bird weighed to the nearest 10 g with
a Salter spring balance.
Data provided by PTTs were processed using the ARGOS facility (CNES, Toulouse, France). In some cases
(when location class is better than Class O), the system
can provide information on the accuracy of locations
(SD 150 m to 1 km). However, in many cases (Location
Classes 0, A and B) this information is not available.
Thus, the accuracy of these locations was assessed using occasions when birds were known to be at the
colony (152 locations of Class 0, 150 of Class A and 187
of Class B). On these occasions, SD of the distance from
the colony (calculated from Eq. 1 below) was 2.2, 6.9
and 34.0 km for Classes 0, A and B, respectively. We
thus used only locations of Class A or better, giving us a
maximum SD for each location of 6.9 km, which was
small compared to the distances travelled by the birds
(see 'Trip durations and destinations' below).
Locations of birds at sea were overlaid on a universal
transverse Mercator projection using GIS Arcview. In
order to estimate distances travelled by birds, we used
the following equation to calculate the arc distance, D,
between pairs of locations (here designated A and B):
*
cos D = (sin a sin b) + (cos a cos b cos L)
(1)
where a =latitude of Location A, b =latitude of Location
B and L = degrees of longitude between Locations A and
B. D was then converted from an arc distance in radians
to a distance in km by multiplying by the radius of the
earth (6370.9 km; Robinson et al. 1978).
A series of locations within 5 km of the colony were
assumed to pertain to birds at their nests, as indicated
by direct obsernations. This assumption may have
resulted in our missing some trips of short duration by
birds that stayed close to the colony, but direct observations indicated that such trips were rare and did not
result in delivery of food to the chick. Durations of foraging trips were calculated from the time of the first
location after a bird had left the colony until the time of
the first location after it had returned. Such calculations were made only for trips with at least 8 locations
259
d-l, giving an average error of & 3h for departure and
arrival times. Average travel speed during each of
these trips was calculated as twice the slope of the linear regression of maximum distance from the colony
upon trip duration.
To examine movements over shorter intervals within
the total foraging ranges of the birds, we estimated
travel speeds during short sections of each trip as the
distance between consecutive pairs of locations divided by the time elapsed between them. In view of
maximum SDs on locations, very short internals between locations could produce erroneous estimates of
speed. To avoid this problem we used only pairs of
locations at sea separated by intervals of > l h.
Potential effects of PTTs on adults. We examined the
potential impacts of PTTs on both foraging-trip durations and body masses of adults. To examine foragingtrip durations, nest-attendance patterns of chick-rearing adults at 45 control nests from the same part of the
colony as those birds fitted with PTTs were recorded
continuously from a hide throughout daylight hours
(4:OO to 22:OO h) on 3 occasions between 15 June and
26 July. Data were not recorded during hours of darkness, when there was little activity in the colony and
birds were unlikely to have returned or departed (Nelson 1978, Garthe et al. 1999). On each occasion, we
recorded the number of changeovers in parental attendance at the nest each day. Changeovers took only a
few minutes to complete, and chicks were not left
unattended during this period. Accordingly, the frequency of changeovers was used to estimate trip durations (following Hamer et al. 1993), for comparison
with birds fitted with PTTs. On some occasions, the
adults made short flights (up to 30 min), after which the
chick was not fed, before departing the colony. We
therefore recorded birds as having departed on a foraging trip only if they were absent from the nest for
>30 min. Although adults were not marked individually, arrivals were always loud and conspicuous (Nelson 1978), and so we are confident that we did not
miss any arrivals and subsequent changeovers in nest
attendance.
To examine potential impacts of PTTs on adult body
mass, a control sample of 40 chick-rearing adults from
nearby nests was weighed over a similar period and
compared to those that had been carrying PTTs for the
previous 14 to 21 d (27 July to 25 August).
RESULTS
Diet
We obtained a total of 266 regurgitates from adult
Morus bassanus. Of these, 76 % contained 1 species of
�Mar Ecol Prog Ser 200: 257-264, 2000
260
prey and 24 % contained 2 species (generally occupying different portions of the sample and so probably
ingested separately). From these 266 samples, the
main prey in terms of frequency of occurrence were
mackerel, sandeels (mainly 0-group), sprat Sprattus
sprattus and herring, with Gadidae and other species
present at lower frequency (Table 1).The total biomass
regurgitated was 27.3 kg comprising, in order of abundance, mackerel, herring, sandeel, Gadidae, sprat and
other species (Table 1). Estimates of the sizes of prey
taken indicated that these varied markedly in size,
from 0-group sandeels (mean = 7.8 cm) to haddock
(29.1 cm) and trout (34.0 cm; Table 2).
Table 1. Diets of gannets Morus bassanus at Bass Rock in
1998, based on a biomass of 27.3 kg from 266 regurgitates.
Gadidae were mainly haddock Melanogrammus aeglefinus,
whiting Merlangiusmerlangus and cod Cadus morhua. Other
species were plaice Pleuronectes platessa, salmon Salmo
salar, trout S. trutta, grey gurnard Eutrigla gurnadus, garfish
Belone belone, greater forkbeard Phycis blenoides. Prey presented in order of decreasing importance
Species
Mackerel
Herring
Sandeel
0-group
Older
Sprat
Ga&dae
Others
Frequency of
occurrence (%)
Proportion of
biomass (%)
31.6
21.5
29.3
27.0
2.3
23.0
15.0
3.7
30.8
20.3
17.9
12.5
5.4
12.6
16.4
2.1
Table 2. Lengths (cm) of fish eaten by gannets Morus bassanus at Bass Rock in 1998
Species
Sandeela
0-group 2016
432
Older
Sprata
375
53
Herring
Mackerel
42
Haddock
15
Whiting
Cod
Unidentified
gadoid
Flatfish
Grey gurnard
Salmon
Trout
Greater
forkbeard
Mean
SE
7.8
11.6
9.8
20.7
24.9
29.1
0.02
0.07
0.08
0.55
0.68
1.61
Min.
5
9
5
10
15
18
dBased on all otoliths extracted from samples
Max.
10
17
15
30
33
37
Movements of adults during foraging trips
We obtained a total of 1327 locations of Class A and
above (up to 14 locations tag-' d-' with a mean of 6
locations tag-' d-l), of which 68 % were at sea and 32 %
at the colony. Less than 2% of locations were over the
mainland (Fig. l ) ,and these were all well within 1 SD
of distance from the coast. Locations covered a wide
area of the North Sea (Fig. l ) ,extending as far as Halibut Bank (NE Scotland), Bergen/Viking Bank (West
Norway), Fisher Bank (north central North Sea) and
beyond Dogger Bank (south central North Sea; see
Fig. 3 for locations of these features) with a maximum
range of 540 km and a mean distance (excluding locations at the nest) of 164 km (SD + 101) from the colony.
Nearly all locations were east of the Bass Rock, with
only 4 % west of the colony in the Firth of Forth.
Trip durations and destinations
There were 72 foraging trips spread over all 17.
tagged birds, with locations at average intervals of
5 3 h, allowing reasonably accurate assessment of the
routes taken by birds. To illustrate these, 2 typical
routes taken by adults are shown in Fig. 2. We used the
furthest recorded location from the colony during each
of these 72 trips to provide information on trip destinations. The mean duration of these trips was 32.2 h
(SD 13.2, range = 13.1 to 84.0 h), and the mean distance to destination was 232 km (SD k 100, range = 39
to 540 km). Destinations had a highly non-random distribution (proportion of trips in each of 7 consecutive
sectors, each subtending an angle of 20" at the colony;
xZ6= 19.3, p = 0.004),with more trips to the NE and SE
and fewer trips due east of the colony than would be
expected by chance (Fig. 3). Destinations NE of the
Bass Rock (19% of the total) were generally in the
vicinity of the Buchan Deep and Halibut Bank (Fig. 3).
Destinations SE of the colony (71%) were mostly
between the Farne Deep, Outer Silver Pit and Dogger
Bank, with a small proportion (4 % of destinations) east
of Dogger Bank. Only 10% of destinations were due
east of the colony, comprising 7 % in the vicinity of
Devil's Hole and 3 % at Wee Bankie and Marr Bank
(Fig. 3).
There was a highly significant relationship between
maximum distance from the colony and trip duration
= 988.7, p < 0.0001, RZ= 0.94),according to
(Fig. 4;
the following equation:
*
Maximum distance (km) =
7.05 (SE + 0.22) trip duration (h)
(2)
Average speed over complete foraging trips was thus
equal to 14.1(SE + 0.4) km h-' (twice the slope of Eq. 2).
�Hamer et al.: Foraging by gannets
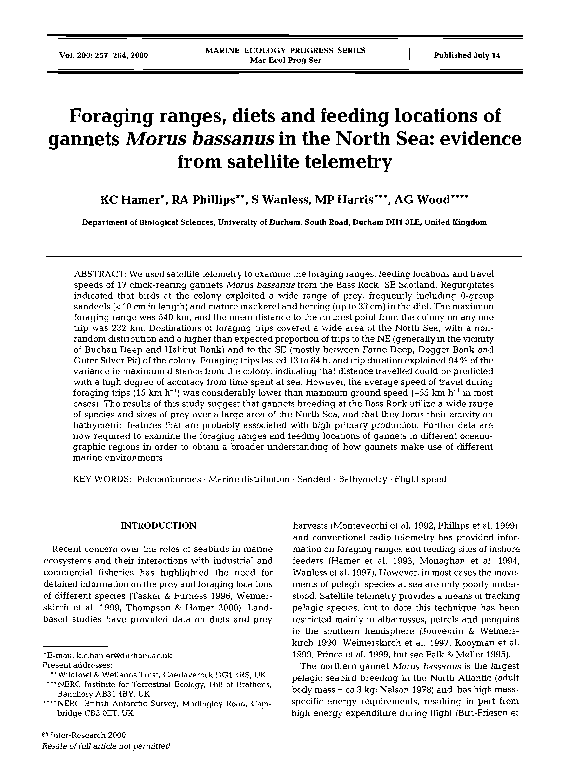
~ i 1. ~oru .us bassanus. h or aging range of gannets from Bass
Rock, SE Scotland, based on 1327 locations (all recorded locations of Class A and above; see 'Materials and methods' for
explanation) from 17 chick-rearing adults over period of 45 d
Speeds of travel over intervals within trips were calculated using consecutive pairs of locations at sea with
> l h between them (see 'Materials and methods Satellite tracking of adults'). The mean of these values
was 18.1 km h-' (n = 797, SD + 16.6),which was similar
to the mean over entire trips. The mean speed during
hours of darkness (23:OOto 4:00 h) was very low (1.6 km
h-', n = 30, SD + 1.9),indicating that birds did not fly at
night; the mean speed during daylight was substantially higher (22.3 km h-', n = 767, SD 31.6; MannWhitney Z = 5.82, p < 0.0001). Speed of travel during
hours of daylight was highly dependent on the interval
= 132.9, p <
between locations (linear regression;
0.0001, R2 = 0.16), according to the following equation:
261
~ i2. Morus
~ , bassanus. Examples of typical routes taken on
foraging trips by chick-rearing gannets from Bass Rock.
(m) outward path; (o)return path
N
*
Travel speed (km h-') =
28.4 (SE + 0.9) - 1.9 (SE 0.1) interval (h) (3)
*
The maximum ground speed recorded was 81 km
h-', but only 1 % of values were >68 km h-' and only
5 % were >56 km h-' (Table 3).
Impacts of PTTs on adults
There was no difference in body mass between control birds (mean = 2.89 kg, n = 40, SD + 0.23) and birds
that had been carrying
for up to 21 d (mean =
2.93 kg, n = 16, SD _+ 0.24; Student's t-test using pooled
variance estimate; t54 = 0'6f p = 0.6)' There was an
average of 0.87 changeovers Per nest Per day at control
nests, giving a mean trip duration of 27 h. This was no
PTTs
Fig. 3. Morus bassanus. Destinations of foraqng trips by
chick-rearinq qannets at Bass Rock. Based on 72 trips from
17 adults <th data received at average intervals i f < 3 h.
Major bathymetric features of North Sea within foraging
ranqe of adults are also dustrated. Isobaths redrawn from
~ ~ ~ ~ d r n iInternational
r a l t ~
Charts 2182B (Central North
Sea) and 2182C (Northern North Sea). -(
) 100 m,
(---------) 50 m (.............) 30 m. 1: BergenIViking Bank,
2: Halibut
3: Buchan Deep, 4: Devil's Hole, 5: Wee
BankieIMarr Bank, 6: Fisher Bank, 7: Farne Deep, 8: Dogger
Bank, 9: Outer Silver Pit, 10: Jutland Bank
bani,
�Mar Ecol Prog Ser 200: 257-264, 2000
262
0
20
40
60
80
100
trip duration (hours)
Fig. 4. Morus bassanus. Relationship between maximum distance from colony and foraging trip duration
Table 3. Morus bassanus. Frequency distribution of travel
speed at sea (n = 797), for gannets breeding on the Bass Rock
in 1998
Travel speed
(km h-')
Frequency
% of
cases
Cumulative
Yo
40.5
67.0
79.3
88.1
93.4
97.4
99.1
99.9
100.0
different from the frequency of changeovers for birds
fitted with P a s (0.75 per nest per day; xZ2= 4.74, p =
0.1), which resulted from a mean trip duration of 32 h.
DISCUSSION
Collection of data
Trip durations of Morus bassanus wearing PTTs did
not differ from those of untagged controls, and the
body masses of tagged birds after 14 to 21 d did not differ from those of controls (see 'Results'), indicating that
attachment of satellite tags did not adversely affect
birds' foraging behaviour. Birt-Friesen et al. (1989)
found that handling of gannets had some adverse
effects on nest attendance, but in their study birds
were held in captivity for >4 h and recaught up to 3
times between 1 and 7 d after initial capture, whereas
in the current study capture of birds and fitting with
PTTs took only 5 min on average, and birds were handled only once prior to data collection. The lower proportion of high-quality (Class A and above) locations
for the colony than for birds at sea in our study (see
'Results') probably resulted from poorer visibility of the
tags to orbiting satellites when the birds were on land,
rather than because tagged birds spent more time at
sea than on land.
Mean trip durations in this study were considerably
longer than those recorded in some previous studies
(see Table 6 in Nelson 1978, Garthe et al. 1999), but
were similar to those recorded by Wanless (1981; 18 to
24 h). Variation in mean trip durations presumably
reflects differences in the distribution of marine food
resources around different colonies. Nelson (1978)
recorded that gannets at the Bass Rock can sometimes
make foraging trips of 2 to 3 d duration, indicating that
trips in the present study were not abnormally long.
Nelson (1966) recorded an average of 2.7 foraging
trips per nest per day at the Bass Rock in the early
1960s, indicating a mean trip duration of -9 h compared with an estimated 27 h using the same methods
in 1998 (see 'Results -Impacts of PTTs on adults'). This
difference in trip duration suggests that prey availability in the vicinity of the colony may have been substantially lower in 1998 than during the early 1960s, and
this is supported by the poor breeding success of several species of seabirds at nearby colonies in 1998
(S.W. & M.P.H. unpubl. data).
Foraging range and feeding locations
The foraging range of adults covered a wide area of
the North Sea, up to a maximum distance of 540 km
(Fig. 1) with a mean distance of 230 km to the furthest
point from the colony on any one trip (Fig. 3). Tasker et
al. (1985) suggested a much shorter maximum range
(150 km), although this was based on the assumption
that birds observed at sea were always from the colony
nearest to the point of observation. Thus, birds observed between the Farne Deep and Dogger Bank
were assumed to be all from the colony at Flamborough Head, NE England, whereas the current study
indicates that this part of the North Sea is also an
important foraging area for birds from the more distant
colony at the Bass Rock (Fig. 3).
The results of this study confirm the suggestion by
Camphuysen et al. (1995) that birds observed at Dogger Bank in early summer included individuals breeding at the Bass Rock. In addition to Dogger Bank, destinations of foraging trips included a number of other
bathymetric features including Halibut Bank, Buchan
Deep, Farne Deep and Outer Silver Pit (Fig. 3), possibly reflecting enhanced primary production at inter-
�Hamer et al.: Foraging by gannets
,
--
faces between mixed shallow water and deeper stratified water (Begg & Reid 1997, Schneider 1997). Gannets may to some extent have utilized these sites in
association with fishing vessels (Garthe 81 Hiippop
1994).
The large foraging range and wide variation in species and sizes of prey utilized by gannets from the Bass
Rock (from 0-group sandeel to mature herring and
mackerel; Tables 1 & 2) suggests that they are better
buffered against reductions in food supply than most
other seabird species in the North Sea. Thus, despite
an apparent 3-fold increase in trip duration since the
1960s and very low productivity of other species
breeding at colonies in the Firth of Forth in 1998, survival of gannet chicks was high (-80 % at study nests)
and chicks appeared to be growing normally during
the study. Martin (1989) similarly found that gannets in
Shetland responded to a major reduction in their main
prey (sandeels) by switching to alternative prey, with
no apparent reduction in productivity. In this study,
although sandeels constituted almost 20% of prey by
mass, only a small proportion of trips were to the Wee
Bankie and Marr Bank, suggesting that gannets are
unlikely to be greatly affected by the current sandeel
fishery there.
Speed of travel during foraging trips and relationship between trip duration and foraging range
.:.
The maximum estimated ground speed in this study
(80 km h-') was equal to the maximum flight speed
suggested by Nelson (1978), but occurred only very
rarely (Table 3). In total, 95% of estimated travel
speeds were below 56 km h-', suggesting that the
maximum ground speed normally attained by gannets
is -55 km h-'. This is very close to the flight speed of
54 km h-' recorded by Pennycuick (1987).
Travel speed decreased significantly with increasing
time intervals between locations (Eq. 3), as also found
by Hull et al. (1997) for royal penguins Eudyptes
schlegeli. This relationship presumably results from
travel speeds over longer intervals being more affected
by deviations from a straight-line course and by time
that birds spend feeding and resting on the water.
Over the shortest intervals, where estimates are least
affected by deviations from a straight-line course, the
mean travel speed in this study was 28.4 km h-' (from
Eq. 3). This was close to half the normal flight speed
(55 km h-'; see previous paragraph), indicating that
birds spent roughly half their time at sea in flight.
Garthe et al. (1999) also found, from external temperature loggers, that birds spent about half their time
away from the colony in flight and the other half on the
sea surface.
263
Durations of foraging trips are generally assumed to
give a good indication of distances flown by birds, although there is little evidence to support this assumption and increasing evidence to the contrary, at
least for short-distance foragers (Cairns 1987, Becker
et al. 1993, Monaghan et al. 1994). For gannets, trip
duration explained 94 % of the variance in maximum
distance from the colony, indicating that distance travelled could be predicted with a high degree of accuracy from trip duration. However, the average speed
of travel during foraging trips (14 km h-', from Fig. 4)
was considerably lower than the maximum flight speed.
Thus, previous estimates of foraging range as the product of flight speed and trip duration (e.g. Nelson 1978)
are likely to have been overestimates.
The results of this study suggest that gannets breeding at the Bass Rock are able to exploit a wide range of
species and prey sizes over a large area of the North
Sea, and that they focus their activity upon bathymetric features that are probably associated with high primary production. Comparative data are now required
to examine the foraging ranges and feeding locations
of gannets in different oceanographic regions in order
to obtain a broader understanding of how gannets
make use of different marine environments.
Acknowledgements. This study was supported by grants from
the European Commission Fisheries Directorate (CEC 96-079
and 95/C 76/15) and JNCC (F90-01-154).We thank Sir Hew
Hamilton-Dalrymplefor access to the Bass Rock, John Croxall
for assistance in developing the project, and Bryan Nelson for
loqstic support and advice. We thank Fiona Stewart, Chris
Coles, Claire McSorley, Kate Buchanan, John Yearsley, Fiona
Thom, Sue O'Brien, Stuart Bearhop and Bryan Nelson for
assistance with collection of data. We thank Suki Finney for
analysis of food samples and Jane Hill for help with production of maps.
LITERATURE CITED
Anonymous (1995) Review of sandeel biology. Int Counc
Explor Sea Cornm Meet 1995/9:4 (Rep ICES Workshop on
Sandeel Otolith Analysis)
Becker PH, Frank D, Sudmann SR (1993)Temporal and spatial pattern of common tern (Sterna hirundo) foraging in
the Wadden Sea. Oecologia 93:389-393
Begg GS, Reid JB (1997)Spatial variation in seabird density at
a shallow sea tidal mixing front in the Irish Sea. ICES J
Mar Sci 54:552-565
But-Friesen VL, Montevecchi WA, Cairns DK, Macko SA
(1989) Activity-specific metabolic rates of free-living
northern gannets and other seabirds. Ecology 70:35?-367
Cairns DK (1987)Diet and foraging ecology of black guillemots in northeastern Hudson Bay. Can J Zoo1 65:
1257-1263
Camphuysen CJ, Heessen HJL, Winter CJN (1995) Distant
feeding and associations with cetaceans of gannets Morus
bassanus from the Bass Rock in May 1994. Seabird 17:
36-43
�264
Mar Ecol Prog Ser 200: 257-264, 2000
Falk K, M ~ l l eSr (1995) Satellite tracking of high-Arctic northern fulmars. Polar Biol 15:495-502
Garthe S, Hiippop 0 (1994) Distribution of ship-following
seabirds and their utilization of discards in the North Sea
in summer. Mar Ecol Prog Ser 106:l-9
Garthe S, Gremillet D, Furness RW (1999) At-sea activity and
foraging efficiency in chick-rearing northern gannets
(Sula bassana): a case study in Shetland. Mar Ecol Prog
Ser 185:93-99
Hamer KC, Monaghan P, Uttley JD, Walton P, Burns MD
(1993) The influence of food supply on the breeding ecology of kittiwakes Rissa tridactyla in Shetland. lbis 135:
255-263
Harkonen T (1986) Guide to the otoliths of the bony fishes of
the Northeast Atlantic. Danbiu ApS, Hellerup, Denmark
Hull CL, Hindell MA, Michael K (1997) Foraging zones of
royal penguins during the breeding season, and their
association with oceanographic features. Mar Ecol Prog
Ser 153:217-228
Jouventin P, Weimerskirch H (1990) Satelhte tracking of wandering albatrosses. Nature 343:746-748
Kooyman GL, Hull C, Olsson 0, Robertson G, Croxall JP,
Davis LS (1999) Foraging patterns of polar penguins. In:
Adams NJ, Slotow RH (eds)Proceedings of the 22nd International Ornithology Congress, Durban. BirdLife South
Africa, Johannesburg, p 2021-2039
Martin AR (1989) The diet of Atlantic puffin Fratercula arctica
and northern gannet Sula bassana chicks at a Shetland
colony during period of changing prey availability. Bird
Study 36:170-180
Monaghan P, Walton P, Wanless S, Uttley JD. Burns MD
(1994) Effects of prey abundance on the foraging behaviour, diving efficiency and time allocation of breeding
guillemots Uria aalge. Ibis 136:214-222
Montevecchi WA, Myers RA (1997) Centurial and decadal
oceanographic influences on changes in northern gannet
populations and diets in the north-west Atlantic: implications for climate change. ICES J Mar Sci 54:
608-614
Montevecchi WA, Birt-Friesen VL, Cairns DK (1992) Reproductive energetics and prey harvest of Leach's stormpetrels in the northwest Atlantic. Ecology 73:823-832
Murray S, Wanless S (1997) The status of the gannet in Scotland 1994-95. Scottish Birds 19:lO-27
Nelson JB (1966) The breeding biology of the gannet Sula
bassana on the Bass Rock, Scotland. Ibis 108:584-626
Nelson JB (1978) The gannet. T & AD Poyser, Berkhamstead
Pennycuick CJ (1987) Flight of auks (Alcidae) and other
northern seabirds compared with southern Procellari-
iformes: ornithodolite observations. J Exp Biol 128:
335-347
Phillips RA, Thompson DR, Hamer KC (1999) The impact of
predation by great skuas on seabird populations at St
Kilda: a bioenergetics model. J Appl Ecol36:218-232
Prince PA, Weimerskirch H, Wood AG, Croxall JP (1999)
Areas and scales of interactions between albatrosses and
the marine environment: species, populations and sexes.
In: Adams NJ, Slotow RH (eds) Proceedings of the 22nd
lnternational Ornithology Congress, Durban, Johannesburg, South Africa, BirdLife South Africa, p 2001-2020
Robinson A, Sale R, Morrison J (1978) Elements of cartography. John Wiley & Sons, New York
Schneider DC (1997) Habitat selection by marine birds in
relation to water depth. Ibis 139:175-178
Tasker ML, Furness RW (1996) Estimation of food consumption by seabirds in the North Sea. ICES Co-op Res Rep
216:6-42
Tasker ML, Jones PH, Blake BF, Dixon TJ (1985) The marine
distribution of the gannet in the North Sea. Bird Study 32:
82-90
Thompson DR, Hamer KC (2000) Stress in seabirds: causes,
consequences and diagnostic value. J Mar Ecosyst Stress
Recovery (in press)
Wanless S (1981)The gannets of Boreray. In: Duncan N, Bullock
D, Taylor K (eds)The Boreray 1980 expedition-a report on
the ecology and natural history of St Kilda. University of
Durham, Durham, p 26-28 (unpubl. expedition rep)
Wanless S (1984) The growth and food of young gannets Sula
bassana on Ailsa Craig. Seabird 7:62-70
Wanless S, Bacon PJ, Harris MP, Webb AD, Greenstreet SPR,
Webb A (1997) Modelling environmental and energetic
effects on feeding performance and distribution of shags
(Phalacrocorax aristotelis): integrating telemetry, geographical information systems, and modelling techniques.
ICES J Mar Sci 54524-544
Wanless S, Harris MP, Greenstreet SPR (1998) Summer
sandeel consumption by seabirds breeding in the Firth of
Forth, south-east Scotland. ICES J Mar Sci 55:1141-1151
Watt J , Pierce GJ, Boyle PR (1997) Guide to the identification
of North Sea fish using premaxillae and vertebrae. ICES
Co-op Res Rep 220:l-231
Weimerskirch H, Cherel Y, Cuenot-Chaillet F, Ridoux V
(1997) Alternative foraging strategies by male and female
wandering albatrosses. Ecology 78:2051-2063
Weimerskirch H, Catard A, Prince PA, Cherel T, Croxall JP
(1999) Foraging white-chinned petrels Procellaria aequinoctalis at risk: from the tropics to Antarctica. Biol Conserv 87:273-275
Editorial responsibility: Otto Kinne (Editor),
Oldendorf/Luhe, Germany
Submitted: August 20, 1999; Accepted: December 1, 1999
Proofs received from author(s): June 8, 2000
a
�
 Richard O Phillips