Ind. Eng. Chem. Res. 2007, 46, 2823-2833
2823
SEPARATIONS
Carbon Dioxide Absorption and Desorption in Aqueous Monoethanolamine
Solutions in a Rotating Packed Bed
Majeed S. Jassim,*,† Gary Rochelle,‡ Dag Eimer,§ and Colin Ramshaw|
Department of Chemical Engineering, UniVersity of Bahrain, P.O. Box 32038, Bahrain, Department of
Chemical Engineering, The UniVersity of Texas at Austin, Austin, Texas 78712, Hydro Oil & Energy, Research
Centre, Porsgrunn, Norway, and Process Intensification and InnoVation Center, School of Chemical
Engineering and AdVanced Materials, UniVersity of Newcastle upon Tyne, Newcastle upon Tyne, NE1 7RU,
United Kingdom
The absorption and desorption of carbon dioxide in aqueous monoethanolamine (MEA) was measured in a
rotating packed bed of size 398 mm outside diameter, 156 mm inside diameter, and axial depth 25 mm. The
effect of lean amine temperature (20 and 40 °C), peripheral rotor gravity (31 and 87 g), and various MEA
concentrations were investigated. Using MEA concentrations above 30 wt % achieved lower CO2 penetration
levels. This is particularly pronounced for the 100% MEA solution. Comparison with conventional columns
showed the advantages of using rotating packed beds in terms of saving size and space and efficient operation.
1. Introduction
Imperial Chemical Industries (ICI) patented the HIGEE (high
gravity) or the rotating packed bed (RPB) concept in late
1970s.1,2 The HIGEE is one of the process intensification (PI)
technologies that promotes size and weight reduction, enhances
inherent safety with lower inventories, improves energy consumption, lowers capital cost, and addresses environmental
concerns.3
This technology takes advantage of centrifugal fields as
stimulants for process intensification.4 The dynamic behavior
of multiphase fluids is dictated by the interphase buoyancy factor
∆Fg. Therefore, increasing the centrifugal acceleration improves
the slip velocity, which in turn improves the flooding characteristics and interfacial shear stress, and consequently boosts
the mass transfer coefficient.
CO2 capture and sequestration is one approach for reducing
the emissions that cause global climate change and the burden
of the carbon tax levy. Absorption/stripping is considered the
state-of-the-art technology for CO2 removal. Aqueous alkanolamine solution absorbs acid gas components from flue gas
streams in a countercurrent operation. The alkanolamine is then
regenerated in a reboiled stripper. An extensive literature for
the reactive mass transfer system of CO2-MEA-H2O is
available.5-12
Chambers and Wall13 designed a mild steel centrifugal
absorber with intermeshing concentric rings and no packing to
remove 10-15% CO2 from air using pure monoethanolamine
(MEA) solution. The corrosive nature of pure MEA caused
deterioration of the rich solution, and their results were not
expressed in terms of overall gas mass transfer coefficient (KGa)
* To whom correspondence should be addressed. Tel.: (+973) 17
876189. E-mail address: drmajeed@gmail.com.
†
University of Bahrain.
‡
The University of Texas at Austin.
§
Hydro Oil & Energy.
|
University of Newcastle upon Tyne.
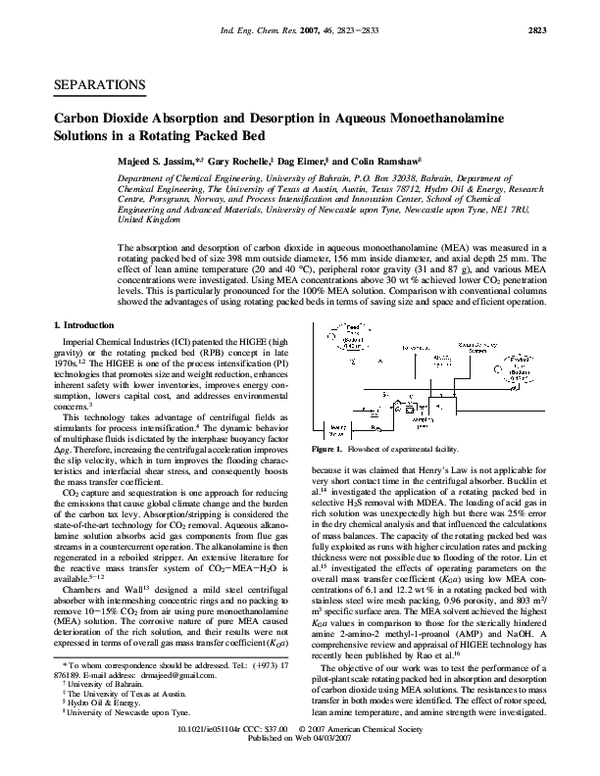
Figure 1. Flowsheet of experimental facility.
because it was claimed that Henry’s Law is not applicable for
very short contact time in the centrifugal absorber. Bucklin et
al.14 investigated the application of a rotating packed bed in
selective H2S removal with MDEA. The loading of acid gas in
rich solution was unexpectedly high but there was 25% error
in the dry chemical analysis and that influenced the calculations
of mass balances. The capacity of the rotating packed bed was
fully exploited as runs with higher circulation rates and packing
thickness were not possible due to flooding of the rotor. Lin et
al.15 investigated the effects of operating parameters on the
overall mass transfer coefficient (KGa) using low MEA concentrations of 6.1 and 12.2 wt % in a rotating packed bed with
stainless steel wire mesh packing, 0.96 porosity, and 803 m2/
m3 specific surface area. The MEA solvent achieved the highest
KGa values in comparison to those for the sterically hindered
amine 2-amino-2 methyl-1-proanol (AMP) and NaOH. A
comprehensive review and appraisal of HIGEE technology has
recently been published by Rao et al.16
The objective of our work was to test the performance of a
pilot-plant scale rotating packed bed in absorption and desorption
of carbon dioxide using MEA solutions. The resistances to mass
transfer in both modes were identified. The effect of rotor speed,
lean amine temperature, and amine strength were investigated.
10.1021/ie051104r CCC: $37.00 © 2007 American Chemical Society
Published on Web 04/03/2007
�2824
Ind. Eng. Chem. Res., Vol. 46, No. 9, 2007
Figure 2. Cross-sectional view of the Higee rig.
The rotating packed bed was compared to a conventional
absorber and a simulated stripper.
2. Experimental Section
The flowsheet of the experimental facility is shown in Figure
1. The MEA solution was stored under a nitrogen blanket in a
polypropylene feed tank (420 L). A valve was used to control
both the temperature and the homogeneity of the aqueous
solution prior to being routed to the experimental rig. The
irrigation rate was manually controlled by two polypropylene
diaphragm valves (George Fischer, Type 315) and the solution
was pumped via a flameproof Polyvinylidene Fluoride (PVDF)
magnetic drive centrifugal pump. The rig was located inside a
flameproof enclosure, which was equipped with a ventilation
system. The gas phase could either be a CO2/air mixture or
steam depending on the mode of the operation. The rotor was
entirely made from stainless steel whereas the piping and the
storage tanks were made from polypropylene.
Figure 2 shows the cross-sectional view of the rotor. The
orientation of the rotor axis is horizontal. The MEA solution
was released via a four-arm distributor onto the inner surface
of the packing in an outward direction. A turbulent CO2/air
mixture entered via a rotary union (Deublin, part number 450191-029) positioned at the end of the horizontal shaft and then
passed into the gas plenum chamber before entering 72 holes
drilled in the stainless steel disc located on the outer side of
the packed bed. It then flowed inwardly within the packing in
a countercurrent direction to the flow of the MEA solution. In
the desorption runs, all the components of the absorption
experiments remained the same with the exception of the rotary
union (Deublin, part number 525-086-026) which was replaced
in order to safely handle the saturated steam.
The packed bed was sandwiched between the stainless steel
disc and a perspex disc. The dimensions of the packed bed were
398 mm outside diameter, 156 mm inside diameter, and an axial
depth of 25 mm. The overall gas flow area passed into the
packing was 0.031 m2. The perspex was used as a transparent
front cover in order to aid the visual observation of the packed
bed during operation. There were eight equispaced cut-outs of
3 mm deep in the perspex disc to allow liquid an exit path. The
packing rotor was made from expanded stainless steel small
mesh (707S), or expamet packing, and was cut into a doughnut
shape. The characteristics of the packed bed were the following: density 1877.8 kg/m3, porosity 0.76, total surface area per
unit volume 2132 m2/m3, and the volume of the packing
2.84‚10-3 m3. Detailed calculations of these characteristics can
be found in the work of Jassim.17
The aqueous MEA solution irrigated the rotating packed bed
using a stationary stainless steel four-arm distributor. There were
eight holes drilled in each arm with a diameter of 2 mm parallel.
The calculated pressure drop across the distributor was 68.24
kPa based upon an amine flowrate of 50 L/min and taking into
account vena contracta of flow (detailed calculations are shown
in the Appendix).
Two types of vortices were created inside the rotating packed
bed. A forced vortex was formed because the gas was forced
to rotate like a solid body due to its interaction with the packing.
The gas then attempts to maintain its angular momentum as it
reaches the “eye” of the rotor, and consequently, it speeds up
in a free vortex. Therefore, a low-pressure region was created
in the eye of the rotor and the four-arm liquid distributor broke
off both the free and the forced vortices and subsequently
reduced any effects of windage in the liquid distribution area.
The distributor irrigated the packed bed in a more uniform
way as the liquid jets traveled at an average injection velocity
of 8.24 m/s (Appendix 1) using 32 injection points and the
spacing between the 4 prongs and the inner packing surface
was kept adequately close. These factors ensured minimum
deflection of liquid trajectories by central vortices and lower
channeling of liquid solution over the rotated packed bed in
comparison to the fixed bed. Hassan-beck18 demonstrated that
the four-arm distributor achieves lower height of transfer unit
(HTU) values compared to the single pipe distributor.
A dry steam system ensured a maximum delivery of 300 kg/h
dry saturated steam to the rig. A CO2/air system delivered a
steady, turbulent, and homogeneous sour gas mixture for the
duration of the experiment (15 min).
A sequence of absorption experiments with a typical industrial
concentration of 30 wt % MEA solution was initially completed.
Table 1. Comparison of GCs Used by Jou et al.19 and the Current Investigation
Jou et al.11
current investigation
column
1.63 m × 3.175 mm
stainless steel packed
column of chromosorb 104
detector
TCD
column 1: 25 m × 0.53 mm fused silica
packed column of CP wax for amines.
Column 2: 1 m × 0.32 mm silcosteel packed
column of Carbosieve S-II.
catalytic converter prior to FID
injection port
column
detector
carrier gas, flowrate
injection vol (µL)
300
250
200
He, 22 cm3/min
5
CO2/H2O/MEA
0.44/1.04/8.20
Oven Temperatures (°C)
375
100-150
250
He, 10.8 cm3/min
0.2
Retention Time (min)
4.28/-/7.02
�Ind. Eng. Chem. Res., Vol. 46, No. 9, 2007 2825
Figure 3. Flooding data on a Sherwood diagram.
organic gas could be detected by a flame ionization detector
(FID). After 5.5 min, the divert valve opened and hence the
midpoint gas pressure directed the flow of the ethanolaminerich gas from the first column directly to the FID. The rationale
of this action was to avoid bringing the ethanolamine into
contact with the catalyst converter because it could poison the
catalyst. The total retention time for a complete gas/liquid
sample analysis was 10 min in which the CO2 peak appeared
at 4.28 min and the MEA peak at 7.02 min. The GC in the
current investigation is compared with that of Jou et al.19 in
Table 1.
Multiple analyses of identical samples showed the reproducibility of CO2 measurement in gas samples was (0.6%, and it
was ( 1.6% and ( 1.4% for CO2 and MEA measurements in
the liquid sample, respectively.
4. Results and Discussion
Figure 4. Variation of gas superficial mass velocity with rotor speed at a
constant liquid superficial mass velocity during flooding experiments.
The mass transfer calculations showed unexpected low CO2
recovery. Therefore, a new experimental campaign was carried
out with higher MEA concentrations: 100, 75, and 55 wt %.
Liquid analysis showed that the difference between the lean
and the rich loading measurements was trivial compared to the
loading level. Hence, the system can be analyzed considering
liquid loading as constant. The average lean/rich loading
measurements were 0.023, 0.048, 0.094, and 0.329 mol CO2/
mol MEA for 100, 75, 55, and 30 wt % MEA.
The aqueous MEA solution was then upgraded to 64 wt %
by pure MEA and then loaded to 0.43 mol CO2/mol amine
before desorption runs were carried out at MEA strengths of
64, 54, and 34 wt %.
3. Analysis Method. A gas chromatograph developed by
Unicam Chromatography (UK) was used to detect the concentration of CO2 and MEA in the vapor and liquid phases. The
GC has two columns and a catalytic converter. The dimensions,
column packing details, and the operational parameters are
shown in Table 1. A total volume of 0.2 µL liquid sample was
injected manually through a rubber septum into the sample
injector port with the aid of a 1 µL Hamilton syringe. The barrel
of the syringe was made from glass, and the needle was stainless
steel. The entire sample was contained in the needle, and it was
vaporized in the injector port as the temperature of the injector
oven reached 375 °C. The gaseous sample was then mobilized
by helium at a volumetric flowrate of 10.8 cm3/min through
the 25 m × 0.53 mm fused silica packed column of CP Wax.
Both CO2 and air would diffuse much faster than MEA. The
second 1.0 m × 0.32 mm Silcosteel packed column of
Carbosieve S-II separated CO2 from air, and then, it was
catalytically converted to methane using hydrogen; hence, the
4.1. Flooding. The flooding experiments were carried out
by varying the superficial mass velocity of gas, superficial mass
velocity of liquid, and rotor speed. The flooding points were
determined by fixing two of the operating variables and
manipulating the third one. Excessive splash of MEA solution
in the eye of the rotor was the selected flooding criterion. Two
procedures were carried out to confirm the results prior to the
calculation of the abscissa and ordinate in the Sherwood plot
(Figure 3).
For expamet packing with 0.76 porosity (ǫ) and 2132 m2/m3
specific surface area (ap), the experimental results are represented by the following:
ln
[ ( )]
uG2ap FG
rω2ǫ3 FL
) -3.01 - 1.40 ln
(x )
[ ( x )]
L
G
FG
FL
0.15 ln
L
G
FG
FL
2
(1)
The flooding velocities in the Higee were higher than those in
dumped rings and were closer to the the values in stacked rings.
This confirms the higher hydraulic capacity of expamet in
comparison to wire gauze packing that showed similar behavior
to Sherwood correlation for dumped rings.20 The effect of rotor
speed on superficial mass velocity of gas (G) at the constant
superficial mass velocity of liquid (L) is shown in Figure 4.
Lockett21 correlated a relationship between Sherwood and
Wallis flooding representations. Equation 2 shows the transformation of a Wallis-type correlation to a Sherwood-type
flooding correlation. For expamet packing, the coefficients in
eq 2 are the following: β ) 2.03 and γ ) 2.058. Figure 5 shows
the experimental flooding data using a Sherwood-Wallis plot.
CG )
[
]
βa -0.25Ng0.22µ -0.03
L FG 0.5 0.5
1+γ
G FL
(( ))
2
(2)
4.2. Absorption Runs. 4.2.1. Mass Transfer. A series of
absorption experiments were performed under atmospheric
pressure and at four different MEA concentrations: 30, 55, 75,
and 100 wt %. Figure 6 shows the performance of rotating
packed bed in the absorption mode that was operated at several
rotor speeds and lean amine temperatures. The experimental
�2826
Ind. Eng. Chem. Res., Vol. 46, No. 9, 2007
equation could be given in terms of the area of transfer unit
(ATU).20,23
π(ro2 - ri2) ) ATUOGNTUOG )
QG
NTUOG
KGaeZ
(5)
Rearranging eq 5, the overall gas-phase mass transfer coefficient
is
KGae )
QG
π(ro2
Tables 3-6 show the operating conditions, KGa, and the CO2
penetration for the absorption runs at 30, 55, 75, and 100 wt %
MEA.
4.2.3. Mass Transfer Control in a Conventional Absorber.
The primary resistance to CO2 mass transfer in a conventional
MEA absorber for this system is not in the gas film as can be
shown by tray efficiency. Kohl24 observed that the chemical
absorption of CO2 by alkanolamines gave 8-25% plate efficiency. In comparison, the gas film controlling processes (such
as the absorption of ammonia) gave >80% plate efficiency.
Therefore, it could be concluded that the absorption of CO2
into alkanolamines solutions is a liquid film controlled process.
4.2.4. Mass Transfer Control in a Rotating Packed Bed.
4.2.4.1. Liquid Film Resistance, Equilibrium Reaction. If
instantaneous reversible reactions dominate the rate of absorption, the mass transfer flux will be independent of reaction rates
but dependent on the diffusion of reactants and products.
An expression was introduced by Tung and Mah25 using the
penetration model to describe the liquid mass transfer behavior
in the rotating packed beds. In their procedure, the kL value is
calculated using eq 7 and the total gas-liquid interfacial area
is calculated with the Onda et al.26 correlation (eq 8).
Figure 5. Experimental data on a Sherwood-Wallis flooding plot.
()
[ ()
Figure 6. Effect of MEA concentration on CO2 penetration at a liquid
flowrate of 2.4 m3/h, gas flowrate of 64.4 m3/h, 4.4 vol % CO2 in sour gas,
and average lean/rich loading (mol CO2/mol MEA).
at
kL,calcdp
) 0.919
DL
a
data were presented in terms of CO2 penetration that is defined
as follows:
σc
a
) 1 - exp -1.45
at
σ
(
CO2 penetration (%) ) 1 -
)
yCO2,in - yCO2,out
yCO2,in
× 100
(3)
Figure 6 shows that the rotating packed bed was most efficient
at higher MEA concentrations. However, it surprisingly showed
high penetration at a typical conventional absorber concentration
of 30 wt % MEA. Section 4.2.7 explains the reasons for such
behavior.
4.2.2. Calculation of KGa. The difficulty of separation is
expressed in terms of the number of transfer units (NTU). The
number of overall transfer units based upon the change in gas
concentration is defined by Colburn:22
NTUOG )
∫yy
2
1
( )
yCO2,in
dy
) ln
y - y*
yCO2,out
(6)
NTUOG
- ri2)Z
ScL1/2ReL2/3GrL1/6
0.75
ReL0.1WeL0.2FrL-0.05
(7)
]
(8)
The liquid diffusion coefficient (DL) is predicted using eqs 1720. The effective pore diameter of packing (dp) is 675 µm. It
should be noted that the Onda et al.26 correlation was derived
from data other than the rotating packed beds. The present
application of this model is thus an extrapolation. The experimental liquid film mass transfer coefficient is calculated using
eqs 9-12.27
kL,exp )
L
aeFπ(ro2 - ri2)Z
NTUL
(9)
The number of transfer units in the liquid phase is defined in
terms of CO2 loading (R, mol/mol MEA), and this is analogous
to eq 4:
(4)
Equation 4 assumes that the equilibrium partial pressure of
CO2 is negligible (y* ) 0) because the CO2 loading (mol/mol
MEA) is low relative to yCO2 and because of the fast chemical
reaction between CO2 and the concentrated amine solutions.
The equilibrium pressure at 40 °C and a loading of 0.33 is
approximately 0.04 kPa.19 The rotating packed bed design
1/3
NTUL )
X 2 - X 1 R2 - R 1
)
∆XLM
∆RLM
(10)
From the experimental gas-phase mole balance, the loading
difference could be calculated:
(R2 - R1) )
QG
- yCO2,out)
(y
QLCT CO2,in
(11)
�Ind. Eng. Chem. Res., Vol. 46, No. 9, 2007 2827
4.2.4.2. Fast Reaction in the Boundary Layer. Freguia and
Rochelle28 found this mechanism to be important for CO2 absorption by MEA solution, and it falls into the interface pseudofirst-order (IPFO) reaction regime. Dankwerts30 used the surface
renewal model to give the rate of CO2 absorption for this case.
NCO2 ) kL
x
1+
k1DCO2 ∆P
k 2 HCO2
(13)
L
where k1 is the rate coefficient for the pseudo-first-order reaction
defined by
k1 ) k2[MEA]
Figure 7. Distribution of kl,calc/kl,exp ratio at different MEA concentrations.
(14)
where k2 is the kinetic rate constant and given by Hikita et al.31
for the temperature range of 5-80 °C:
log10 k2 ) 10.99 - (2152/T)
(15)
Equation 13 can be simplified because the second term under
the square root is much greater than unity. Thus, the overall
gas-phase mass transfer coefficient for the fast reaction of CO2
with amine is given by
K Ga )
Figure 8. Effect of rotor speed on kl,calc/kl,exp for 30 wt % MEA solution.
The log mean loading driving force is a function of the measured
loading and the equilibrium loading (R*) at the operating CO2
partial pressures.
∆RLM )
(R2 - R/2) - (R1 - R/1)
ln
( )
R2 - R/2
(12)
R1 - R/1
The R* values were generated using the FLASH module based
on the Freguia-Rochelle model28 in the Aspen Plus environment. Figure 7 shows the distribution of kl,calc/kl,exp ratio at
different MEA concentrations. The calculated kl is greater than
the experimental kl by an average factor of 6.2. The deviation
might be attributed to the fact that the calculated kl uses the
viscosity and CO2 diffusion coefficient in MEA solution with
zero loading. In practice, in our data, even if the bulk solution
has zero loading, the interface will have a loading of 0.5.
According to Weiland et al.,29 the viscosity and therefore the
diffusion coefficients were extrapolated to increase by factors
of 0.5, 2.2, and 7.4 for 30, 55, and 75 wt % solutions,
respectively. Also, the CO2 diffusion coefficient of the lean
solutions is predicted from data measured at 30 wt % (eq 20).
Furthermore, the estimation of the overall kl neglects any
resistance because of the fast reaction. Although the fast reaction
does not dominate the rate, it may offer a significant resistance
in the more concentrated amine solutions. Another reason for
the apparent low values of the liquid film mass transfer
coefficient is the use of Onda’s equation to predict wetted area
as the occurrence of channeling is possible and hence the
reduction of the available gas-liquid interfacial area.
Figure 8 shows that model correctly predicts the effects of
variation of rotor speed, although this variable has only a power
of 0.05 in the Froude number in the Onda expression.
xkappDCO a
2
(16)
HCO2
where “a” refers to the total geometric area as it is assumed
that the packing was completely wet. Aboudheir et al.32 provided
the apparent reaction-rate constant (kapp) at operational MEA
concentrations and temperatures, and these are given in Table
2. The diffusivity and physical solubility of CO2 in MEA
solution was determined using the N2O analogy (eq 17). The
diffusivities of CO2 and N2O in water as a function of
temperature are given by Versteeg et al.33 in eqs 18 and 19.
The diffusivity of N2O in aqueous MEA is correlated by Ko et
al.34 in eq 20.
( ) ( )
DN2O
DCO2
)
amine
DN2O
DCO2
(17)
water
DCO2_H2O ) 2.35 × 10⁻⁶ exp(-2119/T)
(18)
DN2O_H2O ) 5.07 × 10⁻⁶ exp(-2371/T)
(19)
DN2O_MEA ) {5.07 × 10⁻⁶ + 8.65 × 10⁻⁷camine + 2.78 ×
10-7camine2} exp
(
)
-2371 - 93.4camine
(20)
T
The physical solubility correlations for CO2 and N2O in water
are given in eqs 21 and 22.32 The solubility of N2O in pure
MEA is given by Wang et al.35 at operating temperatures of
20.4 and 40.2 °C to be 2425 and 3262 kPa m3/kmol. A summary
of results is shown in Table 2.
HCO2_H2O ) 2.82 × 10⁶ exp(-2044/T)
(21)
HN2O_H2O ) 8.55 × 10⁶ exp(-2284/T)
(22)
This model (eqs 16-22) predicts higher KGa values of 15.855.6 1/s, which are much greater than the measured values (1-7
1/s). As we are seeking limiting mechanisms, we expect that
�2828
Ind. Eng. Chem. Res., Vol. 46, No. 9, 2007
Table 2. Calculated KGa Values for Fast Reaction Mechanism with
HCO2_MEA ) 0.745 and 0.638 at 293 and 313 K
DCO2_MEA
(109 m2/s)b
kapp (1/s)a
MEA conc
KGa (1/s)
wt %
mol/dm3
293 K
313 K
293 K
313 K
293 K
313 K
30
55
75
100
4.9
9.0
12.3
16.4
30 750
80 000
160 000
180 000
90 000
216 666
350 000
450 000
1.12
0.67
0.38
0.17
1.97
1.28
0.78
0.37
16.8
21.0
22.4
15.8
44.5
55.6
55.3
43.4
a
Aboudheir et al.32
b
Calculated using eq 16.
the calculated KGa from each the limiting mechanisms should
always be greater that the measured KGa. If the calculated value
is much greater than the measured value, then its respective
mechanism probably plays little role in the mass transfer process.
The fast reaction mechanism is thus not solely limiting, but may
contribute a significant resistance to the mass transfer.
In contrast to measured values, the predicted values are
sensitive to temperature but not to the variation in MEA
concentration, indicating that the mass transfer of CO2 is not
limited by the mechanism of fast reaction in the boundary layer.
Therefore, this mechanism does not predict the magnitude or
trends of the experimental results.
4.2.4.3. Reaction in Liquid Bulk. An extreme case is when
the reaction takes place in the liquid bulk rather than the
boundary layer. There is also no significant loss of CO2
concentration across the liquid boundary layer. In this case, the
resistance to mass transfer depends on the bulk chemical reaction
and is hence controlled by liquid holdup. The KGa for this case
could be derived from flux equations:36
NA ) KG(PAG - P/A)
NA )
(23)
kapp
(C - CAL)ǫL
a Ai
(24)
Rearranging eq 23 by 24 yields
K Ga )
kapp
HCO2_MEA
(25)
ǫL
where HCO2_MEA is the Henry’s law constant and it is defined
as the ratio of delta concentrations in the case when Henry’s
law does not hold. The liquid holdup (ǫL) for high voidage
structured packing in a rotating packed bed is correlated by
Burns et al.:37
ǫL ) 0.039
() ( )()
g
g0
-0.5
U
U0
0.6
V
V0
0.22
(26)
where the gravitational acceleration is defined for rotating
equipment as
g ) rω2
(27)
Figure 9. Effect of MEA concentration on experimental KGa at a liquid
flowrate of 2.4 m3/h and gas flowrate of 64.4 m3/h.
The following are characteristic values for acceleration (g0)
100 m/s2, superficial flow velocity (U0) 1 cm/s, and kinematics
viscosity (V0) 10-6 m2/s. The kapp and HCO2 values were
determined as described in the previous section. The range of
the predicted KGa values was 0.46-73.80 1/s. This range
overpredicts the measured KGa values by a 0.8-5.2 order of
magnitude indicating that the resistance to mass transfer is not
dictated by liquid bulk reactions.
4.2.5. Effect of Rotor Speed. The rotating packed bed was
operated between 600 and 1000 RPM giving a gravitational
acceleration of 31 and 87 g, respectively. Tables 3-6 show the
variation of rotor speed on the kl,exp for the investigated MEA
concentrations at different operating conditions. It is believed
that the higher rotor acceleration causes a subsequent rise to
the interphase velocity throughout the packed bed. This fact in
conjunction with a large specific area causes the creation of
thin films and small droplets, and hence, the overall result is a
better mass transfer performance as indicated by the higher mass
transfer coefficients achieved at higher rotor speeds.
According to Burns and Ramshaw,38 the rotating packed bed
is more efficient at higher rotor speeds due to reduction of
maldistribution as the type of flow in the rotating packed bed
is primarily dictated by the rotor speed. The pore flow or rivulets
are dominant at low rotor speeds (<14 g), and droplet flow is
dominant at intermediate rotor speeds (>25 g). Therefore, the
range of the experimental rotor speeds indicates the region of
flow type to be droplet and/or film flow, and this ensures
minimization of maldistribution levels.
4.2.6. Effect of MEA Concentration. Lower CO2 penetration
was achieved with concentrated MEA as shown by Figure 6.
The sharp performance enhancement might be attributed to
accelerated absorption kinetics especially when coupled with
higher temperature. The total solubility of CO2 and the driving
forces for the forward instantaneous reaction are proportional
to MEA concentration. Figure 6 and Tables 3-6 show that the
CO2 loadings in the average lean/rich solution are lower in the
highly concentrated solution, and that might be the reason for
higher CO2 penetration using 30 wt % MEA.
Table 3. Pilot Plant Results for CO2 Absorption at 30 wt % MEA and PT ) 1 atm
MEA
(wt %)
rotor speed
(RPM)
lean T
(˚C)
superficial liquid
velocity (m/s)
superficial gas
velocity (m/s)
average lean/rich loading
(mol CO2/mol MEA)
CO2 in
(vol%)
KGa
(1/s)
CO2 penetration
(%)
30
600
40.5
22.5
40.6
22.8
39.9
23.1
39.3
23.8
0.00633
0.00633
0.00633
0.00633
0.00317
0.00317
0.00317
0.00317
0.16988
0.16988
0.16988
0.16988
0.16988
0.16988
0.16988
0.16988
0.336
0.323
0.339
0.328
0.330
0.325
0.333
0.320
4.5
4.4
4.3
4.3
4.4
4.4
3.6
4.2
1.05
0.71
1.22
0.79
0.80
0.76
0.64
0.72
47.4
60.1
41.8
57.1
56.6
58.1
63.4
59.9
1000
600
1000
�Ind. Eng. Chem. Res., Vol. 46, No. 9, 2007 2829
Table 4. Pilot Plant Results for CO2 Absorption Runs at 55 wt % MEA and PT ) 1 atm
MEA
(wt %)
rotor speed
(RPM)
lean T
(˚C)
superficial liquid
velocity (m/s)
superficial gas
velocity (m/s)
average lean/rich loading
(mol CO2/mol MEA)
CO2 in
(vol%)
KGa
(1/s)
CO2 penetration
(%)
55
600
39.6
20.7
40.1
20.9
39.5
22.3
39.6
22.6
0.00633
0.00633
0.00633
0.00633
0.00317
0.00317
0.00317
0.00317
0.16988
0.16988
0.16988
0.16988
0.16988
0.16988
0.16988
0.16988
0.080
0.092
0.080
0.094
0.105
0.100
0.103
0.098
4.7
4.6
4.5
4.5
4.4
4.5
4.4
4.1
4.18
2.48
4.32
2.86
2.87
2.58
3.22
2.78
5.1
17.0
4.6
13.0
13.0
15.9
10.1
13.8
1000
600
1000
Table 5. Pilot Plant Results for CO2 Absorption at 75 wt % MEA and PT ) 1 atm
MEA
(wt %)
rotor speed
(RPM)
lean T
(˚C)
superficial liquid
velocity (m/s)
superficial gas
velocity (m/s)
average lean/rich loading
(mol CO2/mol MEA)
CO2 in
(vol%)
KGa
(1/s)
CO2 penetration
(%)
75
600
41.0
21.4
40.2
21.0
40.8
22.1
39.4
20.6
0.00633
0.00633
0.00633
0.00633
0.00317
0.00317
0.00317
0.00317
0.16988
0.16988
0.16988
0.16988
0.16988
0.16988
0.16988
0.16988
0.051
0.040
0.049
0.038
0.061
0.047
0.055
0.044
4.4
4.4
4.3
4.3
3.6
4.4
4.4
4.5
5.63
2.59
5.19
3.42
5.47
2.60
5.54
3.38
1.8
15.8
2.5
8.8
2.0
15.7
1.9
9.0
1000
600
1000
Table 6. Pilot Plant Results for CO2 Absorption at 100 wt % MEA and PT ) 1 atm
MEA
(wt %)
rotor speed
(RPM)
lean T
(˚C)
superficial liquid
velocity (m/s)
superficial gas
velocity (m/s)
average lean/rich loading
(mol CO2/mol MEA)
CO2 in
(vol%)
KGa
(1/s)
CO2 penetration
(%)
100
600
40.7
20.6
40.5
24.3
41.1
20.4
40.9
20.3
0.00633
0.00633
0.00633
0.00633
0.00317
0.00317
0.00317
0.00317
0.16988
0.16988
0.16988
0.16988
0.16988
0.16988
0.16988
0.16988
0.010
0.041
0.007
0.026
0.014
0.043
0.004
0.039
3.4
4.5
4.5
4.2
4.5
4.2
4.3
4.4
6.09
5.59
7.11
6.48
6.21
4.85
6.88
6.25
1.3
1.9
0.6
1.0
1.2
3.1
0.7
1.2
1000
600
1000
Even though the liquid side mass transfer coefficient decreases
with highly viscous MEA solutions, the larger driving forces
contribute to lower CO2 penetration. A significant increase in
the overall gas phase mass transfer coefficient was observed
when the MEA concentration was increased as shown in Figure
9.
4.2.7. Comparison with Conventional Absorber. According
to operating data by Kohl and Nielsen,36 for an aqueous MEA
gas treating plant, a typical absorber consists of two 7-m
(23-ft) beds of polypropylene saddles with 14.5 m diameters.
The average inlet CO2 composition was 12.5 vol % and the
average outlet was 0.2 vol %; hence, the number of transfer
units for the absorber is 4.1, and thus, the HTUOG is computed
to be 3.4 m. In comparison, the average HTUOG for the Higee
machine using 30 wt % MEA solution could reach a maximum
of 21 cm as shown in Table 7.
4.3. Desorption Runs. The desorption runs were carried with
30, 54, and 60 wt % MEA solutions, preheated to 57-70 °C,
and at atmospheric pressure as shown in Table 8. The flow of
steam inside the rotating shaft, the gas plenum, and the holes
was subsonic as the Mach number (Ma) was approximately 0.43.
There were no operational problems in dealing with high
temperatures and high MEA concentrations as the rig was made
from stainless steel.
4.3.1. Calculation of KGa. The expression for the number
of the overall gas transfer units in the rotating packed bed at
constant Henry’s law values is given by McCabe et al.:39
NTUOG )
y1 - y2
∆ylm
(28)
Assuming linear equilibrium and operating lines, the log
Table 7. Comparison between Conventional Absorber36 and RPB
conventional absorber36
diameter (m)
4.42
packing height (m)
internals
14.02
2 beds of polypropylene
saddlesa
1
(40˚C)b
10-18
10-15
0.1-0.3
0.062
0.415
4.45
40c
3.4
0.068b
180a
144
0.198
0.0163
pressure (atm)
temperature (°C)
MEA conc (wt %)
feed CO2 (vol %)
outlet CO2 (vol %)
lean loading (mol/mol)
rich loading (mol/mol)
L/G (kg/kg)
flooding (%)
HTUOG (m)
KGa (1/s)
at (m2/m3)
aw (m2/m3)26
kGa (1/s)41
kLa (1/s)25
RPB
0.398 (OD);
0.156 (ID)
0.025 axial depth
stainless Perspex
sheets
1
20/40
30
3.5-4.5
0.03-0.13
refer to Table 3
16.30-30.75
6.6-15.5
0.14-0.27
0.64-1.22
2132
992
0.233
2.336-4.916
a Assume 1.5 in saddles. b Calculated using the Kohl and Nielsen36
equation at 40 °C. c Eckert flooding diagram.40
mean driving force is given by
∆ylm )
(y1 - y/1) - (y2 - y/2)
ln
( )
y1 - y/1
(29)
y2 - y/2
where y1 and y2 are the vapor mole fractions and y/1 and y/2 are
the equilibrium mole fractions. The Freguia and Rochelle28
model was used to generate equilibrium values using the FLASH
module in the Aspen Plus environment as no experimental
�2830
Ind. Eng. Chem. Res., Vol. 46, No. 9, 2007
Table 8. Pilot Plant Results for Desorption Runs with PT ) 1 atm
MEA
(wt %)
rotor speed
(RPM)
lean temp
(°C)
34
800
800
800
800
600
1000
600
1000
600
1000
600
1000
68.0
69.0
67.1
70.0
58.2
59.7
56.9
57.2
58.8
58.4
58.9
59.3
54
60
loading
(mol CO2/mol MEA)
rich
lean
0.405
0.346
0.379
0.399
0.414
0.407
0.431
0.422
0.402
0.403
0.437
0.432
solubility data were available in the literature for high MEA
concentrations at high temperatures. The FLASH module
temperature was set to 100 °C because the saturated steam at
atmospheric pressure was the stripping medium. The KGa was
calculated using eq 6.
The effect of the specific steam rate on the KGa at three amine
concentrations is shown in Figure 10. The stripping cycle is
believed to be gas film controlled because the mass transfer is
observed to be independent of the liquid rate and rotor speed.
Also, the operation of the rotating packed bed causes the creation
of thin films, and the stripping at high-temperature causes lower
solution viscosities; thus, the liquid film resistance is considered
to be negligible.
Table 9 shows the dimensions of the rotating packed bed and
the operating conditions for a typical desorption run. On the
basis of the overall energy balance calculations, the average
molar H2O/CO2 ratio was 45.2 and hence the estimated outlet
CO2 partial pressure was 2.64 kPa. The equilibrium partial
pressure of CO2 at an average loading of 0.4 mol/mol and 100
°C in 30 wt % solution was 20 kPa.35 Thus, there is no rich
end pinch in these mass transfer experiments.
4.3.2. Comparison with Conventional Desorber. Table 9
shows the necessary dimensions for a simulated conventional
stripper to achieve similar performance to the rotating packed
bed at an MEA concentration of 34 wt %. The stripper was
modeled using the Aspen Plus environment, and the reactions
were in equilibrium. The simulated stripper was randomly filled
with metallic cascade mini rings (CMR; type 2) that has a
specific surface area of 144 m2/m3 and a voidage of 0.971. The
Figure 10. Variation of KGa with G/L at a constant steam rate (250 kg/h).
specific steam rate
(kg steam/L soln)
KGa
(1/s)
H2O/CO2
(mol/mol)
0.09
0.20
0.34
0.37
0.12
0.12
0.20
0.20
0.43
0.43
0.14
0.14
38.3
57.5
73.1
76.7
49.2
48.8
50.3
52.0
85.9
85.9
54.4
54.4
39.5
79.3
45.2
38.7
34.5
46.9
46.8
56.0
43.8
44.3
39.7
41.8
0.398
0.329
0.321
0.329
0.404
0.399
0.408
0.403
0.332
0.334
0.424
0.419
Table 9. Comparison between Simulated Stripper and RPB at an
MEA Concentration of 34 wt %
simulated stripper
rich solution temp (°C)
lean loading
(mol CO2/mol MEA)
rich loading
(mol CO2/mol MEA)
Gm/Lm
dimensions (m)
mol H2O/ mol CO2
PCO2 (kPa),
at top of column
RPB
67.1
0.3221
67.1
0.3211
0.3792
0.3788
0.49
packing: metallic, random,
CMR (#2)
4.5 ID × 0.21 height
55.6
1.79
0.49
0.398 OD
0.156 ID
0.025 thickness
45.2
2.64
height of the column was varied while the rich solution loading,
the rich solution temperature, and the molar L/G were kept
constant in order to achieve the lean loading specification. The
results show that the conventional stripper height necessary to
achieve similar performance to the rotating packed bed is greater
by a factor of 8.4 and its diameter is greater by a factor of 11.3.
5. Conclusions
Because of the complex nature of the mass transfer accompanied by chemical reaction for absorption of CO2 by
concentrated MEA solutions in a rotating packed bed, limiting
mechanisms were used to calculate the expected performance
of the mass transfer machine. The mechanisms of mass transfer
with equilibrium reactions matches the data best, but the
predicted rates were higher than the measured rate. A possible
explanation for this is that the reactions are not instantaneous
and thus the measured rate is slower than the predicted rate. At
the other extreme, the measured rate is also much slower than
the predicted rate assuming a fast but a finite rate of reaction
with no depletion of MEA.
The most important factor that influenced the low CO2
penetration was the MEA concentration as the driving forces
are proportional to this variable. The range of rotor speeds giving
accelerations of 31-87 g ensured minimum maldistribution and
achieved high mass transfer coefficients. It was also noticed
that a higher lean amine temperature contributed to lower CO2
penetration and better mass transfer coefficients.
In the desorption mode, the experimental results indicate that
the mass transfer in the rotating packed bed is gas film
controlled. The comparison with a simulated stripper confirmed
the size reduction advantage of a rotating packed bed at similar
operational conditions. Therefore, the rotating packed bed is
an attractive option to use for gas sweetening applications in
offshore facilities where size and space are important.
�Ind. Eng. Chem. Res., Vol. 46, No. 9, 2007 2831
Thus, the pressure drop is
∆Pf ) -
Figure A. Sudden contraction to the liquid flow in a four-arm distributor.
2
1013‚8.242 1
- 1 ) -8.34 kPa
2
0.67
[
Thus, the total pressure drop in each arm due to the sudden
contraction is 66.72 kPa.
The pressure drop in each arm due to frictional loss can be
calculated as follows:
mean velocity )
Acknowledgment
The authors would like to pay tribute to the generous financial
assistance of Hydro Oil & Energy to carry out this project.
Q)
Appendix 1: Pressure Drop Calculation in the Liquid
Distributor
Figure A shows the configurations of the four-arm liquid
distributor:
number of arms ) 4
]
Q
πdi2/4
0.00083
) 0.0002075 m3/s
4
πdi2 π(0.01)2
)
) 0.0000785 m2
4
4
Thus, the mean velocity ) 2.64 m/s.
Reynolds number ) Re )
Fud 1013‚2.64‚0.01
)
)
µ
2 × 10⁻³
length of each arm ) 12 cm ) 0.12 m
1.3 × 10⁴
number of holes per arm ) 8
pipe roughness ) 0.000045 m (commercial steel)
diameter of each hole ) 2 mm ) 0.002 m
Thus, the relative roughness ) e/d ) 0.000045/0.01 ) 0.0045.
Accordingly, the fanning friction factor ) 0.009.43
The frictional pressure drop per unit length is given by
The physical properties of 30 wt % ethanolamine solution at
30 °C are the following: density ) 1013 kg/m3 and dynamic
viscosity ) 2 × 10⁻³ Pa‚s.
The following calculations are based upon an ethanolamine
solution flowrate of 50 L/min ) 0.00083 m3/s.
(hole diameter)2
)
cross-sectional area of each hole ) π
4
2
π(0.002 /4) ) 3.141 × 10⁻⁶m2
flowrate per hole )
0.00083
total flowrate
)
)
number of holes
8‚4
25.9 × 10⁻⁶ m3/s
∆Pf ) 4f
()
( )
L Fu2
1 1013‚2.642
) 4‚0.009
) 12.7 kPa/m
di 2
0.01
2
The distance between the holes in each arm is approximately
0.5 cm. Thus, the frictional pressure drop is only 0.06 kPa
between the two holes. This loss is negligible in comparison to
the total pressure drop due to the sudden contraction in the holes.
The length of each arm is 0.12 m; thus, the frictional pressure
drop per arm is 1.52 kPa.
total pressure drop in each arm ) 66.72 + 1.52 )
68.24 kPa
Nomenclature
-6
velocity of solution for each hole )
Re ) Fud/µ )
25.9 × 10
Q
)
)
A 3.141 × 10⁻⁶
8.24 m/s
1013‚8.24‚0.002
) 8.347
2 × 10⁻³
The pressure drop for a sudden contraction to the effective area
of the flow could be calculated as follows:42
∆Pf ) -
[
Fu2 1
-1
2 Cc
]
2
where Cc is the contraction coefficient and it varies between
0.6 and 1.0 as the ratio of the pipe diameters varies from 0 to
1 (the ratio is 0.2 in our case), assuming a common value for
Cc of 0.67. The velocity of the fluid (u) refers to the smaller
pipe.
A ) gas-liquid interfacial area (m2/m3)
ac ) centrifugal acceleration (m/s2)
a, at, ap ) total specific surface area of packing (m2/m3)
ae ) effective specific surface area (m2/m3), eqs 5, 6, and 9
ATU ) area of a transfer unit (m2)
CG ) gas capacity factor (m/s)
camine ) concentration of amine in solution (kmol/m3)
CA ) molar concentration of A (kmol/m3)
CAi ) molar concentration of A at the interface (kmol/m3)
CAL ) molar concentration of A in the bulk of the liquid (kmol/
m3)
CT ) total concentration of MEA solution (kmol/m3)
DCO2 ) diffusion coefficient of CO2 (m2/s)
DN2O ) diffusion coefficient of N2O (m2/s)
DL ) diffusion coefficient of liquid (m2/s)
dp ) diameter of packing pore (m) dp ) 6(1 - ǫ)/at
g ) gravitational acceleration (m2/s) or acceleration due to
centrifugal field (eq 27)
g0 ) characteristic acceleration value (eq 26) ) 100 m/s2
G ) superficial mass velocity of gas (kg/s‚m2)
�2832
Ind. Eng. Chem. Res., Vol. 46, No. 9, 2007
HCO2 ) Henry’s law constant (Pa/kmol‚m3)
kL,calc ) calculated mass transfer coefficient of liquid (m/s)
kL,exp ) experimental mass transfer coefficient of liquid (m/s)
k1 ) pseudo-first-order reaction rate constant (1/s)
k2 ) second-order reaction rate constant (1/s)
kapp ) apparent pseudo-first-order reaction rate constant (1/s)
KG ) overall gas phase transfer coefficient (m/s)
KGa ) overall volumetric mass transfer coefficient (1/s)
L ) superficial mass velocity of liquid (kg/m2‚s)
Ng ) dimensionless acceleration ) ω2r/g
NCO2 molar rate of absorption of CO2 per unit (kmol/s‚m2)
NTUOG ) overall gas phase number of transfer units (-)
NTUL ) number of transfer units for the liquid phase (-)
∆P ) pressure drop (N/m2)
PAG ) partial pressure of A in bulk of gas phase (N/m2)
P/A ) partial pressure of A in equilibrium with a solution
having the composition of the
main body of liquid (N/m2)
QG ) volumetric flowrate of gas (m3/s)
QL ) volumetric flowrate of liquid (m3/s)
PT ) total pressure (atm)
r ) radial position (m)
ri ) inner radius of the rotor (m)
ro ) outer radius of rotor (m)
T ) temperature (K)
uG ) superficial gas velocity (m/s)
U ) superficial flow velocity (m/s)
Uo ) characteristic superficial flow velocity (m/s)
VL ) superficial liquid velocity (m/s)
X1, X2 ) mole fraction of CO2 in lean/rich solution (-)
Xlm ) log mean mole fraction in liquid (-)
yCO2,in ) mole fraction of CO2 in inlet stream (-)
yCO2,out ) mole fraction of CO2 in outlet stream (-)
y/ ) gas-phase mole fraction of CO2 in equilibrium with CO2
concentration in liquid (-)
Z ) axial height of the packing (m)
Dimensionless Numbers
FrL ) liquid Froude number (VL2at/g)
GrL ) liquid Grashof number (dp3ac/νL2)
ReL ) liquid Reynolds number (VL/atνL)
ScL ) liquid Schmidt number (νL/DL)
WeL ) liquid Webber number (VL2FL/atσ)
Greek Letters
ǫ ) voidage (-)
ǫL ) liquid holdup (-)
R1, R2 ) CO2 loading in lean and rich solutions (mol/mol MEA)
RLM ) log mean loading defined by eq 11 (mol/mol MEA)
µ ) viscosity (Pa‚s)
FL ) liquid density (kg/m3)
FG ) gas density (kg/m3)
σ ) liquid surface tension (N/m)
σc ) critical surface tension (N/m)
νL ) kinematics liquid viscosity (m2/s)
ω ) rotational speed (rad/s)
AbbreViations
CMR ) cascade mini rings
HTU ) height of transfer unit
MEA ) monoethanolamine
N2O ) nitrous oxide
NTU ) number of transfer unit
Literature Cited
(1) Mallinson, R. H.; Ramshaw, C. Mass Transfer Apparatus and
Process. European Patent 0053881, 1982.
(2) Ramshaw, C.; Mallinson, R. H. Mass Transfer Process. U.S. Patent
4,283,255, 1981.
(3) Green, A. Process Intensification: the key to survival in global
markets? Chem. Ind. 1998, 168-172.
(4) Ramshaw, C. Opportunities for exploiting centrifugal fields. Heat
RecoVery Syst. CHP 1993, 13 (6), 493-513.
(5) Astarita, G.; Savage, D. W.; Bisio, A. Gas Treating with Chemical
SolVents; John Wiley & Sons: New York, 1983.
(6) Astarita, G. Carbon dioxide absorption in aqueous monoethanolamine
solutions. Chem. Eng. Sci. 1961, 16, 202-207.
(7) Zarzycki, R.; Chacuk, A. Absorption: fundamentals and applications;
Pergamon Press Ltd: Elmsford, NY, 1993.
(8) Caplow, M. Kinetics of carbamate formation and breakdown. Am.
Chem. Soc. 1968, 90, 6795-6803.
(9) Danckwerts, P. V. The reaction of CO2 with ethanolamines. Chem.
Eng. Sci. 1979, 34 (4), 443-446.
(10) Dankwerts, P. V. Gas-Liquid Reactions; McGraw-Hill: New York,
1970.
(11) Versteeg, G. F.; Van Swaaij, W. P. M. Solubility and Diffusivity
of Acid Gases (CO2, N2O) in aqueous alkanolamine Solutions. J. Chem.
Eng. Data 1988, 33, 29-34.
(12) Blauwhoff, P. M. M.; Versteeg, G. F.; VanSwaaij, W. P. M. A
study on the reaction between carbon dioxide and alkanolamines in aqueous
solutions. Chem. Eng. Sci. 1984, 39 (2), 207-225.
(13) Chambers, H. H.; Wall, M. A. Some factors affecting the design
of centrifugal gas absorbers. Trans. Inst. Chem. Eng. 1954, 32, S96-S107.
(14) Bucklin, R. W.; Buckingham, P. A.; Smelser, S. C. The Higee
demonstration test of selective H2S removal with MDEA. Presented at The
38th Laurence Reid gas conditioning conference; Norman, Oklahoma, March,
1988.
(15) Lin, C.-C.; Liu, W.-T.; Tan, C.-S. Removal of carbon dioxide by
absorption in a rotating packed bed. Ind. Eng. Chem. Res. 2003, 42, 23812386.
(16) Rao, D. P.; Bhowal, A.; Goswami, P. S. Process Intensification in
Rotating packed beds (HIGEE): An Appraisal. Ind. Eng. Chem. Res. 2004,
43, 1150-1162.
(17) Jassim, M. S. Process Intensification: Absorption and desorption
of carbon dioxide from monoethanolamine solutions using HIGEE technology. Ph.D. thesis, University of Newcastle upon Tyne, UK, 2002.
(18) Hassan-beck, H. M. Process Intensification: mass transfer and
pressure drop for counter-current rotating packed bed. Ph.D. thesis,
University of Newcastle upon Tyne, UK, 1997.
(19) Jou, F.-Y.; Mather, A. E.; Otto, F. D. The solubility of CO2 in a
30 mass percent monoethanolamine solutions. Can. J. Chem. Eng. 1995,
73, 140-147.
(20) Singh, S. P.; Wilson, J. H.; Counce, R. M.; Villiers-Fisher, J. F.;
Jennings, H. L.; Lucero, A. J.; Reed, G. D.; Ashworth, R. A.; Elliott, M.
G. Removal of volatile organic compounds from groundwater using a rotary
air stripper. Ind. Eng. Chem. Res. 1992, 31, 574-580.
(21) Lockett, M. J. Flooding of rotating structured packing and its
application to conventional packed columns Chem. Eng. Res. Des., Part A
1995, 73, 379-384.
(22) Colburn, A. The Simplified calculation of diffusional process.
General consideration of two-film resistances. Trans. AIChE 1939, 35, 211.
(23) Kelleher, T.; Fair, J. R. Distillation studies in a high-gravity
contactor. Ind. Eng. Chem. Res. 1996, 35, 4646-4655.
(24) Kohl, A. Plate Efficiency with Chemical Reaction - Absorption of
Carbon Dioxide in Monoethanolamine Solutions. AIChE 1956, 2, 264270.
(25) Tung, H.; Mah, R. S. H. Modeling Liquid Mass Transfer in HIGEE
Separation Process. Chem. Eng. Commun. 1985, 39, 147-153.
(26) Onda, K.; Takeuchi, H.; Okumoto, Y. Mass Transfer Coefficient
between Gas and Liquid Phases in Packed Columns. J. Chem. Eng. Jpn.
1968, 1, 56.
(27) Coulson, J. M.; Richardson, J. F.; Backhurst, J. R.; Harker, J. H.
Chem. Eng. 2002, 2 (5), 564-570.
(28) Freguia, S.; Rochelle, G. T. Modeling of CO2 capture by aqueous
monoethanolamine. AIChE J. 2003, 49, 1676-1686.
�Ind. Eng. Chem. Res., Vol. 46, No. 9, 2007 2833
(29) Weiland, R. H.; Dingman, J. C.; Cronin, D. B.; Browning, G. J.
Density and viscosity of some partially carbonated aqueous alkanolamine
solutions and their blends. J. Chem. Eng. Data 1998, 43, 378-382.
(30) Dankwerts, P. V. Gas-Liquid Reactions; McGraw-Hill: New York,
1970.
(31) Hikita, H.; Asai, S.; Ishikawa, H.; Honda, M. The kinetics of
reactions of carbon dioxide with monoethanolamine, diethanolamine and
triethanolamine by a rapid mixing method. Chem. Eng. J. 1977, 13, 7-12.
(32) Aboudheir, A.; Tontiwachwuthikul, P.; Chakma, A.; Idem, R.
Kinetics of the reactive absorption of carbon dioxide in high CO2-loaded,
concentrated aqueous monoethanolamine solutions. Chem. Eng. Sci. 2003,
58, 5195-5210.
(33) Versteeg, G. F.; Van Swaaij, W. P. M. Solubility and diffusivity
of acid gases (carbon dioxide, nitrous oxide) in aqueous alkanolamine
solutions. J. Chem. Eng. Data 1988, 33, 29-34.
(34) Ko, J.-J.; Tsai, T.-C.; Lin, C.-Y.; Wang, H.-M.; Li, M.-H. Diffusivity
of Nitrous Oxide in Aqueous Alkanolamine Solutions. J. Chem. Eng. Data
2001, 46, 160-165.
(35) Wang, Y. W.; Xu, S.; Otto, F. D.; Mather, A. E. Solubility of N2O
in alkanolamines and in mixed solvents. Chem. Eng. J. 1992, 48, 31-40.
(36) Kohl, K.; Nielsen, R. Gas Purification, 4th ed.; Gulf Publishing
Company: Houston, TX, 1985.
(37) Burns, J. R.; Jamil, J. N.; Ramshaw, C. Process intensification:
Operating characteristics of rotating packed beds - determination of liquid
hold-up for a high-voidage structured packing. Chem. Eng. Sci. 2000, 55,
2401-2415.
(38) Burns, J. R.; Ramshaw, C. Process intensification: visual study of
liquid maldistribution in rotating packed beds. Chem. Eng. Sci. 1996, 51,
1347-1352.
(39) McCabe, W.; Smith, J.; Harriott, P. Unit Operations of Chemical
Engineering, 5th ed.; McGraw-Hill: New York, 1993.
(40) Eckert, J. Selecting the Proper Distillation Column Packing. Chem.
Eng. Prog. 1970, 66 (3), 39-44
(41) Onda, K.; Sada, E.; Takeuchi, H. Gas absorption with chemical
reaction in packed columns. J. Chem. Eng. Jpn. 1968, 1, 62-6.
(42) Coulson, J. M.; Richardson, J. F.; Backhurst, J. R.; Harker, J. H.
Chem. Eng. 1999, 1 (6), 72.
(43) Holland, F.; Bragg, R. Fluid Flow for Chemical and Process
Engineers, 2nd ed.; Butterworth-Heinemann: Woburn, MA, 1995.
ReceiVed for reView October 3, 2005
ReVised manuscript receiVed January 30, 2007
Accepted February 16, 2007
IE051104R
�
 Gary Rochelle
 Majeed Jasim