Topic 13. Public policies related to building energy and environment
The Influence of Legislation on the Indoor Thermal Comfort of Office
Buildings
Heitor da Costa Silva1, Lennart B. Poehls1,*
1
Architectural Research and Post-Graduate Program (PROPAR), Federal University of Rio
Grande do Sul, Porto Alegre, Rio Grande do Sul, Brazil
*
Corresponding email: lennart@poehls.com
Keywords: Thermal Comfort, Legislation, Thermal Simulation, Office Buildings
SUMMARY
Energy consumption of buildings is an important concern of countries around the world.
Various Brazilian legislations regulate certain elements of the construction’s envelope to
obtain such efficiency. To analyze the influence of this existing legislation in Porto Alegre,
southern Brazil, on the thermal indoor comfort of office buildings, 12 architectonical elements
are extracted from two existing and one future legislation in order to build a base model and
its variations. Thermal simulations were executed regarding 5 different values for each
element and 4 solar orientations for each of the simulated values. The methodology, tools and
models are described in detail. The authors use the obtained results to show that the influence
of the legislations’ prescriptions on the thermal comfort is considerable and that the lack of
definitions with respect to solar orientation and shading are allowing certain uncomfortable
edification.
INTRODUCTION
The conservation of energy resources has become one of the most important topics for the
building sector around the world. The Brazilian National Energy Report of 2011 [MME]
states that the total amount of energy consumed in 2001 equaled 309660,38GWh, of which
14,40% or 43352,45GWh are consumed by commercial buildings. The same document
reveals that in 2010 the total amount raised to 455744,81GWh, and commercial buildings
now consumed 15,00% or 68361,72GWh, which is a significant (157%) raise compared to the
statistics 9 years earlier. At the same time, architecture’s main goal is the creation of space to
shelter man and therefore the necessity to produce a comfortable ambient is a priority for any
kind of architecture. During the creation process of an architectonical project, the definition of
the building’s envelope intervenes most drastically in the resulting energy consumption and
thermal comfort of that space [Olgyay (1999)]. The characteristics of the envelope are directly
linked to the consumption as they regulate the exchange of heat (or cold) between the interior
space and the external environment. In cases where the envelope does not generate an
adequate indoor climate, equipment, such as air-conditioning, has to be employed to
guarantee the thermal comfort of its users [Hirst (1986)]. Consequently a correctly executed
envelope not only makes possible the reduction of energy consumption but also plays an
important role for the well being of the persons inside such building. The use of the
envelope’s various elements is therefore the main tool to adjust the balance between thermal
and visual comfort as well as energy consumption. It is important to highlight though, that
factors that do not belong to the envelope do have an influence on those results as well.
�The authors have chosen to use the typology of office buildings as research object out of the
following two reasons: in Brazil they are one of the biggest consumers among buildings due
to the wide-spread use of air-conditioning systems. Their employment is due to the demand
for a constant and relatively low temperature during the working hours.
Alike the governments of more developed countries, the Brazilian government has started to
be interested in reducing the energy consumption while offering the quality and comfort of
internal spaces. To regulate these two aspects of construction, legislation is the most relevant
tool at government’s hand. These laws, in the case of Brazil, aim at guaranteeing safety and
health conditions, but only indirectly implement thermal comfort. European and Northern
American legislations may already deal directly with comfort issues for some decades, while
the Brazilian counter part only recently started to develop an evaluation system called
PROCEL for buildings. The first version of this text to become law one day was published in
2009.
This article critically deals with the possibility to use the law as a tool to obtain a certain level
of thermal comfort in architecture. The objective is to present an introductive revision of the
actual legislation in Brazil and its contribution to thermal comfort in office buildings in Porto
Alegre. As today no Brazilian regulations exist to directly deal with thermal comfort, this
work rather uses the superposition of the effects caused by regulations towards energy saving
and analyses how the prescribed architectonical elements influence not only the consumption,
but also the thermal comfort of the construction. In more detail, this paper proposes a revision
of the present Brazilian legislation regarding its influence on the thermal comfort of the
internal ambients of office buildings in Porto Alegre, situated in the state of Rio Grande do
Sul, Brazil. It focuses on one federal law (NBR 15220 (ABNT 2003)), one local legal code
(Building Code for Porto Alegre from 1992 (DOE 1992)) and a proposed certification
approach (PROCEL for Buildings from 2010 (MME 2010)) in order to abstract examples of
architectural elements to create and build the models for the presented case studies.
METHODS
In a first step, 12 architectonical elements are abstracted from the Brazilian legislations. It is
important to highlight, that these elements are not selected on the base of their influence on
the energy consumption or the thermal comfort, but represent the complete set of elements
defined by the three legislations. In more detail the elements are: Thermal Resistance of the
External Walls, Thermal Resistance of the Internal Walls, Thermal Delay of the External
Walls, Solar Factor of the Opaque Elements, Opening’s Area in relation to the Floor’s Area,
Opening’s Area in relation to the Façade’s Area, Height of Upper Window Border, Glass
Type, Horizontal Shading, Vertical Shading, Unit’s Floor Size, and Façade’s Area in relation
with the Floor’s Area.
These elements are used to define a simplified model. First of all, a base model is constructed.
9 equal office units, arranged in a 3 by 3 grid, compose this model. All units are of the same
size and in all simulations are defined equally. They all possess a window to one side and are
closed on the remaining sides. All temperature measurements are realized in the center unit.
Therefore the analyzed unit possess only one external façade, while the lateral walls as well as
the floor and the ceiling are in contact with other units and therefore indirectly influenced by
the changes done to the architectonical elements during the simulation of the case studies. The
back façade is defined as in contact with a space of constant temperature of 21°C. To create
�the base model, its elements are defined according to the laws’ prescriptions, if they exist, or
according to building standards. This results in the values reported in Table 1 representing the
base model.
Table 1. Values choosen for the 12 elements to conform the Base Model
!"#$%&'($)
Case Studies:
Thermal Resistance of the External Walls
Thermal Resistance of the Internal Walls
Thermal Delay of the External Walls
Solar Factor of the Opaque Elements
Opening’s Area in relation to the Floor’s Area
Opening’s Area in relation to the Façade’s Area
Height of Upper Window Border
Glass Type
Horizontal Shading
Vertical Shading
Unit’s Floor Size
Façade’s Area in relation with the Floor’s Area
Value:
1.61
2.28
5.90
4.00
17.10
22.80
2.20
0.87
0.00
0.00
20.00
75.00
Unit:
W/m!K
W/m!K
h
%
%
%
m
adimensional
degree
degree
m!
%
abstracted from:
Code for Edifications Porto Alegre
Code for Edifications Porto Alegre
NBR 15220
NBR 15220
Code for Edifications Porto Alegre
Label PROCEL
Code for Edifications Porto Alegre
Label PROCEL
Label PROCEL
Label PROCEL
Label PROCEL
Label PROCEL
In a second step, four additional values are chosen for each element. These values create 12
case studies with five values. If possible the values are chosen to represent 2 values above and
2 below the value of the base model and if possible at two of the additional values lie outside
the range permitted by the Brazilian legislation. To facilitate the comparison and analysis the
values are chosen as equidistant as possible. Table 2 presents all values for the architectonical
elements for the case studies. It is important to highlight that during simulation only the value
of the element under investigation is adapted in the model simulated, all other elements
remain with the value of the base model. For further details on the practical construction of
the model and the simulation please see the Results. To complete the simulation each change
of value is simulated for four different solar orientations, with the windows facing south, east,
north and west. This results in 20 simulations for each case study. As the temperature is
simulated hourly, each simulation contains 8760 indoor temperatures.
In a third step, the simulated temperatures are used to calculate the hours of comfort
according to the following equation elaborated by the authors. Equation 1 represents the lower
limit of temperature for thermal comfort, while equation 2 calculates the upper limit for the
acceptable indoor temperature:
!!"# =
15,8 + 0,31 ∗ !! + 20
2
(1)
were Ticl represents the inferior comfort limit and Te the hourly exterior dry bulb temperature,
both in ºC.
!!"# =
19,8 + 0,31 ∗ !! + 26
2
(2)
were Tscl represents the superior comfort limit and Te the hourly exterior dry bulb
temperature, both in ºC.
�The equation uses the external temperatures from the weather data (LABEEE), which is also
used for the simulations, to evaluate if the interior temperature of each hour is or is not inside
the interval defined as confortable. As a result, the total number of hours of comfort as well as
the total number of hours of discomfort is calculated. To have a more detailed idea about the
space’s reaction to the changes in the model, the hours of discomfort are further distinguished
in hours that present a temperature that is below the comfort temperature interval’s lower
limit and temperatures which are higher then the upper limit of comfort defined. It should be
noted that the hours of comfort and discomfort do not represent real values and therefore
cannot be compared to other studies with data from real world case studies. The value is
exclusively used to compare and evaluate the behavior of the space simulated in the
simplified model, comparing the changes in each case study.
In a fourth and last step, the data is transformed in graphical and the results are analyzed to
establish the relation between the definitions made by the Brazilian law and the indoor
thermal comfort. In more detail, each simulation will generate the following output graphs:
(1) a graph that resumes all 20 simulations of a case study, showing 5 lines representing the
variations of the element, each composed of four points on the x-axis, representing the solar
orientations. The y-axis shows the hours of comfort during the simulation of 1 year. And (2) a
more detailed graph which shows the hours of comfort as well as the hours of discomfort for
too cold and for too warm temperatures in hours and in percent for each simulation. Therefore
each case study generates 21 output graphs. The most significant values for three elements are
presented in Results.
RESULTS
With the definition of the base model and the values to be changed the computational
simulations can be started. The authors would like to give a brief description of the tools used
and basic steps taken to achieve the experimental results, before the most impacting results
are presented in more detail.
The base model and certain changes, especially those to volumetric or superficial changes, are
modeled in the freeware plug-in called OpenStudio Plug-in for Google SketchUp by the U.S.
Department of Energy. This tool allows the import of geometrical data produced in SketchUp
into the simulation software EnergyPlus, also a freeware by the U.S. Department of Energy.
The plug-in allows categorizing geometrical objects as for example walls, roofs, shading
devices, or windows, but also defines the thermal units to be used in simulation as well as the
definition of the basic thermal behavior of the model’s components. Certain variations of the
architectonical elements’ value were realized directly in EnergyPlus. For the simulation the
finished model description is simulated using a weather data file for Porto Alegre, which is
based on the weather station’s data at the local airport and made available by the laboratory
LABEEE from the University of Santa Catarina, Brazil.
In the following, the results for three groups of architectonical elements are displayed. They
represent the most important findings among the total of 12 elements. The results are
described and discussed briefly. A more complete discussion of the overall assumptions to be
made can be found in Conclusions.
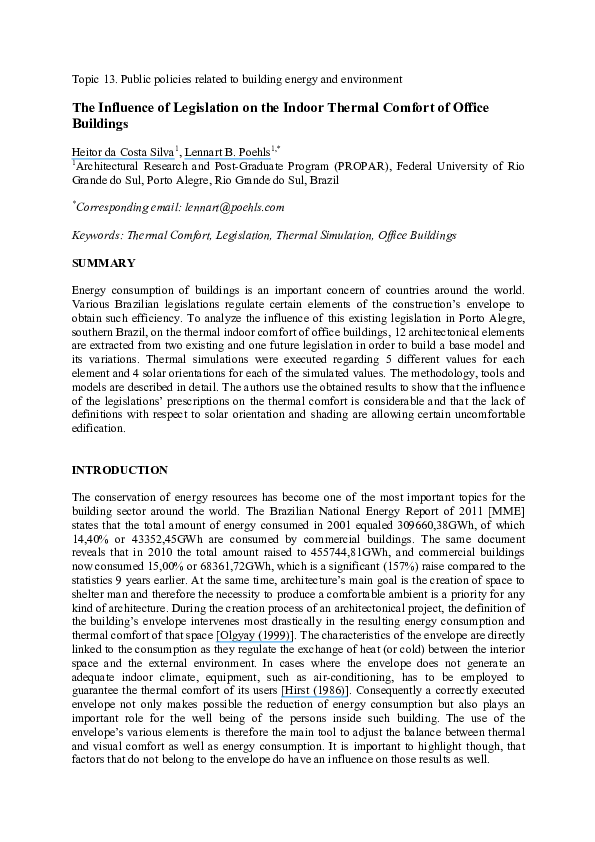
�Thermal Resistance of the External Walls
The results regarding this element are depicted in Figure 1. Note that the lower values
represent highly isolated exterior walls.
3.%0&4*#567&8!0$).-&90%/%*.1(0&"'&*!0&:;*0$1.-&<.--&
'&%"#
'%""#
!"#$%&"'&(")'"$*&+!,&
'$%"#
'"""#
$&%"#
$%""#
$$%"#
$"""#
!&%"#
!%""#
!$%"#
!"""#
()*+,#
-.(+#
/)0+,#
1-(+#
%"-.$&"$/01*.2"1&+&,&
"2"3#45678#
!29!#45678#
'2!'#45678#
:2:"#45678#
%2":#45678#
Figure 1. Graphical summary of the variations of the case study regarding the Thermal
Resistance of the External Walls; source: the authors
The blue line represents an exterior wall with a thermal resistance of 0.09W/m2K. From left to
right one can observe the values for the different solar orientations, where 0 represents
windows facing south, 90 represents windows towards the east and so on. This poorly isolated
wall results in the worst results for all orientations and the three over-all worst results of this
case study. The best results for each orientation are obtained with the medium isolation of
3.13W/m2K represented by the third variation depicted in green. The value prescribed by law
has acceptable results, which are shown in red. Regarding the orientation it can be easily
observed that the best results for each variation are obtained with a southern façade. When
looking at this element as a separated fact, we can conclude that a intermediate value of
thermal resistance results in the best results regarding comfort hours, outnumbering exterior
walls with higher or lower isolation. We can also observe, that the same value suffers the
smallest differences when comparing its solar orientation; such insensibility is desirable for
lawmakers.
Regarding the analysis of the legislation it is important to highlight, that the value obtained
from the local legislation (DOE 1992) is creating the highest comfort values.
�Opening’s Area in relation to the Façade’s Area
Figure 2 depicts the results for this exemplary case study on the openings of a office building.
3.%0&4*#567&8901/1:;%&<$0.&/1&$0-.2"1&*"&*!0&=.>.50;%&<$0.&&
("""#
'&%"#
!"#$%&"'&(")'"$*&+!,&
'%""#
'$%"#
'"""#
$&%"#
$%""#
$$%"#
$"""#
!&%"#
!%""#
!$%"#
!"""#
)*+,-#
./),#
0*1,-#
2.),#
%"-.$&"$/01*.2"1&+&,&
%34"5#
!(3$"5#
$$36"5#
'!3("5#
("3""5#
Figure 2. Graphical summary of the variations of the case study regarding the Opening’s
Area in relation to the Façade’s Area; source: the authors
The graph shows the linear relation between the window area and the resulting hours of
internal thermal comfort. As to be expected, the smaller the window the higher the number of
hours will be. An analysis of the numerical results shows that small windows reduce the
internal heat gains through the non-opaque elements and therefore improve the comfort
achieved. All variations present their best result for rotations towards the south and, with
exception of the smallest window, their lowest number of hours of comfort when rotated to
the north. The authors conclude that a southern window orientation obtains the best comfort.
Further, smaller windows do obtain better results regarding the comfort hours and show lesser
sensibility to solar orientation. It is important to state, that the authors are well aware, that
such conclusions are not taking into account the natural illumination and its obvious
influences on the visual comfort.
When using these results to analyze today’s Brazilian legal situation, concentrating on the
thermal comfort only, the results do point out three important results: firstly the window size
creates significant changes (differences of 110,77% between variations with the same solar
orientation) to the inside climate and therefore needs to be prescribed in regarding lawmaking,
secondly the actually prescribed values result in medium results for hours of comfort. Last,
the solar orientation proofs to be of even bigger importance (differences of 194,03% between
southern and northern orientation) and therefore should be included as part of the prescription
to guide towards a higher thermal indoor comfort.
�Horizontal Shading
This sub-section show the results regarding horizontal shading elements, in more detail,
Figure 3 shows the graphical results generated after the author’s simulations.
3.%0&4*#567&8"$/9"1*.-&4!.5/1:&
(&""#
!"#$%&"'&(")'"$*&+!,&
($%"#
(!""#
!'%"#
!&""#
!$%"#
!!""#
"#
'"#
)*"#
!&"#
%"-.$&"$/01*.2"1&+&,&
"+"",#
))+!%,#
!!+%",#
((+&%,#
$%+"",#
Figure 3. Graphical summary of the variations of the case study regarding the Horizontal
Shading; source: the authors
It is easy to observe and to understand that the largest shading device, being of 1.2m of depth,
obtains the best results. Regarding the solar orientation, the shading devices employed in the
southern façade resulted in the lowest differences when compared to another, while the results
of the orientation with the most severe insolation, the northern façade, show a great
differentiation with changes in the shading device’s size. Overall, elements with more depth
show better results than shallow ones and the highest impact is observed for the northern
façade. As the depths decreases, the sensibility to solar orientation is getting higher.
The actual Brazilian legislation is not regulating the shading of windows or other openings,
with variations of 144,91% between the variations regarding its size, the authors consider this
architectonical element an important factor for the thermal indoor comfort. PROCEL for
buildings prescribes no limit, but at least allows some evaluation of the building’s shading
devices.
DISCUSSION
Thermal comfort seems to be a obvious goal of architects and civil engineers, nevertheless,
the Brazilian legislation not yet regards to guide the constructions towards a better comfort
result. Using the legislations that aim at a reduced energy consumption a base model and
variations were created to start a critical analysis of the legal influence on thermal comfort.
Based on the individual analysis of the architectural elements described above, some first
conclusions can be drawn on the influence of the legislation on the thermal comfort of the
interior space of office buildings in Brazil’s southern region. The examination of the results
�regarding the limits and prescriptions provided in the analyzed texts lead to three basic
observations:
(1) The total lack of inclusion of the solar orientation shows to allow significant negative
effects on the thermal comfort;
(2) The equivalent holds true for the lack of definitions regarding the shading devices;
(3) The definitions made for all elements concerning the internal walls and elements are
resulting in very good values for the thermal comfort.
It is important to highlight that this paper treats to be a first step to obtain a strategy, a
methodology and first information on the Brazilian legislation regarding the thermal comfort.
Very simplified models are used and certain aspects of comfort are not being considered; the
work concentrates on the thermal comfort as defined by Equation 1a/b. The simulation also
causes the separation of architectural elements that in reality have influences on one another,
these inter-activity is disregarded in the applied methodology. Therefore the conclusions hold
only for a very limited part of the real picture. On the one hand this allows concrete results
and makes possible the preliminary analysis above, on the other hand it is the authors
understanding that the thereby obtained results are only valid for comparison between one and
another. Anyhow, the results are promising to lead to further investigation regarding and
influencing future legislative initiatives in Brazil, South America and other developing
countries.
CONCLUSIONS
The results do indicate a direction that a critical discussion on the tool of legislation should
take to guarantee a higher standard of thermal comfort. The basic points are: (1) the desirable
inclusion of distinctions of the solar orientation of certain architectonical elements, in order to
correctly prescribe them, and (2) the inclusion of laws regarding the shading of non-opaque
parts of the envelope.
It has to be stated, that the actual legislation for the city of Porto Alegre provides prescriptions
for many elements, which result in a certain standard of thermal comfort. The work also
proofs that, even not aiming at comfort, the influence of the existing legislation on this
important issue is significant.
ACKNOWLEDGEMENT
Part of this work has been realized with the financial support (sholarship) of Coordenação de
Aperfeiçoamento de Pessoal de Nível Superior (CAPES).
�REFERENCES
ASHRAE. 1992. Standard 55 - Thermal environment conditions for human occupancy.
Atlanta. ASHRAE.
AYOADE, J.O. 2011. Introdução à Climatologia para os Trópicos. Rio de Janeiro. Bertrand
Brasil.
Brasilian Association for Technical Normatives (Associação Brasileira de Normas Técnicas)
(ABNT). 2003. NBR 15220: Thermical Discomfort of Buildings (Desempenho térmico de
edificações). Rio de Janeiro. ABNT.
De Dear, R., Schiller Brager, G. 2001. The adaptive model of thermal comfort and energy
conservation in the built environment. International Journal of Biometeorology (45).
pp.100-108.
Eletrobrás / PROCEL education. 2006. Conservação de Energia – Eficiência Energética de
Equipamento e Instalações. Federal University of Itajubá (FUPAI), Brazil.
Evans, J. M. 2007. The Comfort Triangles: A New Tool for Bioclimatic Design. Ph.D.Thesis,
Delft University of Technology, The Netherlands.
Fanger P. O. 1972. Thermal Comfort: analysis and applications in environmental engineering.
New York. McGraw-Hill.
Humphreys, M. A., Nicol, J. F. 2002. The validity of ISO-PMV for predicting confort votes in
every-day thermal environments. Energy and Building (34/6). pp. 667-684
Hirst, E. 1986. Energy Efficiency in Buildings - Progress e Promise. 1986. Washington. Jr.
Editor.
Ministry of Mining and Energy (MME) (Ministerio de Minas e Energia). 2010. Set of
Publications: Label for Energy Efficiency of Buildings (Conjunto de publicações:
Etiquetagem de Eficiência Energética de Edificações, RTQ-C, RAC-C, Manual para
aplicação do RTQ-C e RAC-C). Brasilia. MME.
Ministry of Mining and Energy (MME) (Ministerio de Minas e Energia). 2011. National
Energy Balance 2011 (Balanço Energético Nacional 2011). Downloaded at:
https://ben.epe.gov.br/downloads/Relatorio_Final_BEN_2011.pdf. Accessed: 16/9/2011.
Laboratory for Energy Efficient Buildings (LABEEE) University of Santa Catarina, Brazil.
Weather Data Archives. Downloaded at: http://www.labeee.ufsc.br/downloads/arquivosclimaticos. Accessed: 05/06/2011.
Offical State Publications (Diário Oficial do Estado) (DOE).1992. Code for Edifications in
Porto Alegre (Código de Edificações de Porto Alegre LC No 284 de 27 de outubro de
1992). Downloades at: http://lproweb.procempa.com.br/pmpa/prefpoa/smov/usu_doc/
codigo.pdf. Accessed: 23/8/2011.
Olgyay, V. 1999. Arquitectura y Clima: Manual de diseñobioclimático para arquitectos y
urbanistas.. Barcelona. Gustavo Gili.
U.S. Department of Energy. EnergyPlus Energy Simulation Software, Downloaded at:
http://apps1.eere.energy.gov/buildings/energyplus/. Accessed: 02/08/2011
U.S. Department of Energy. OpenStudio Plug-in for Google SketchUp. Downloaded at:
http://apps1.eere.energy.gov/buildings/energyplus/openstudio.cfm. Accessed: 02/08/2011
View publication stats
�
 Heitor da Costa Silva
 Lennart Bertram Poehls