doi 10.1515/ijfe-2012-0250
International Journal of Food Engineering 2014; 10(3): 437–445
Renata Silva Diniz, Jane Sélia dos Reis Coimbra*, Marcio Arêdes Martins, Michel de Oliveira
dos Santos, Mayra Darliane Martins Silva Diniz, Emílio de Souza Santos, Danielle Dias
Santánna, Roney Alves da Rocha and Eduardo Basílio de Oliveira
Physical Properties of Red Guava (Psidium
guajava L.) Pulp as Affected by Soluble Solids
Content and Temperature
Abstract: Physical properties of fluid and semisolid
foods, such as density and rheological behavior, must
be carefully taken into account on designing unit operations for the processing of such kind of products. In this
work, a rotational rheometer of concentric cylinders was
used to evaluate the rheological behavior of red guava
pulp (Psidium guajava L.), with different soluble solids
content (5, 10, and 15°Brix), at four temperatures (10, 30,
50, and 70°C). Also density data were obtained using
pycnometry. Models were fitted to the obtained experimental data, in order to mathematically represent the
rheological parameters and the density as functions of
temperature and soluble solids content. The rheological
behavior of the red guava pulp was adequately described
by the Ostwald-de-Waele model, with a pseudoplastic
behavior. Models to describe the simultaneous effect of
temperature and concentration on the density were also
presented.
Keywords: non-Newtonian, power law model, pseudoplastic, Arrhenius-type equation, density
*Corresponding author: Jane Sélia dos Reis Coimbra, Departamento
de Tecnologia de Alimentos (DTA), Universidade Federal de Viçosa
(UFV), CEP 36571-000 Viçosa, MG, Brazil, E-mail: jcoimbra@ufv.br
Renata Silva Diniz, Departamento de Tecnologia de Alimentos (DTA),
Universidade Federal de Viçosa (UFV), CEP 36571-000 Viçosa, MG,
Brazil, E-mail: renadiniz14@gmail.com
Marcio Arêdes Martins: E-mail: aredes666@gmail.com, Michel de
Oliveira dos Santos: E-mail: michel.saints@gmail.com, Mayra
Darliane Martins Silva Diniz: E-mail: mayra_darliane@hotmail.com,
Emílio de Souza Santos: E-mail: emilio_ss@hotmail.com,
Departamento de Engenharia Agrícola (DEA), Universidade Federal
de Viçosa (UFV), CEP 36571-000 Viçosa, MG, Brazil
Danielle Dias Santánna: E-mail: danielledias@ufv.br, Roney Alves
da Rocha: E-mail: roneyalimentos@yahoo.com.br, Eduardo Basílio
de Oliveira: E-mail: eduardo.basilio@ufv.br, Departamento de
Tecnologia de Alimentos (DTA), Universidade Federal de Viçosa
(UFV), CEP 36571-000 Viçosa, MG, Brazil
1 Introduction
Guavas (Psidium guajava L.) are fruits of commercial and
nutritional values. Guavas are a member of the myrthe
family (Myrtaceae) with the following characteristics:
(1) 4–12 cm long, round, or oval depending on the species,
with a rough outer skin which often presents a bitter taste;
(2) high vitamin C content, and reasonable amounts of
provitamin A, minerals (Ca, P, and Fe), dietary fiber, and
antioxidant compounds (such as lycopene); (3) pleasant
aroma, not much sugar (overall) and almost no fat; (4) sensory and bio-functional properties; (5) excellent acceptance for fresh consumption; (6) can be used in large
industrial application; and (7) can grow in adverse
weather conditions. Additionally, guava flesh contains
considerable amounts of pectin, which makes them
widely used for the fabrication of purees, pastes, nectars,
jams, and jellies. Guava pulp may be sweet or sour, offwhite (known as white guavas) to deep pink (known as
red guavas), with seeds variable in number and hardness
depending on the species [1–4]. Guava fruits are an important cultivation in tropical and semitropical regions.
For a technically and economically optimal processing of fruits, it is necessary to know several of their
physical and chemical properties, as well as how such
properties behave in function of the conditions to which
the material is submitted during its processing [5].
Rheological behavior and density are among the most
important of these physical properties, and both are
affected by the solids content of the material and the
temperature. Density data are needed, for example, to
calculate heat and mass transfer rates, which are the
basis of numerous unit operations.
Rheology is the science that studies the deformation
and flow of solids and fluids under the influence of
mechanical forces. Moreover, rheology attempts to define
a relationship between the stress acting on a given
Brought to you by | Universidade Federal de Viçosa UFV
Authenticated | 10.248.254.158
Download Date | 9/12/14 4:04 PM
�438
R. S. Diniz et al.: Physical Properties of Guava Pulp
material and the resulting deformation and/or flow that
takes place. Rheological behavior and parameters are
necessary in designing and controlling operations such
as pumping and transport through pipes, among others.
The knowledge of rheological behavior of fluids in the
production stage can be useful in quality control, as
the rheological characteristics are intimately correlated
to the texture perception, thus being also important for
the sensory quality control of the final products. The
microstructure of a product may be correlated to the
rheological behavior, allowing the development of new
materials [6–8].
Several studies dealing with the rheological characterization of fruits and fruit-derived products can be
found in literature, such as for pulps and purees from
murta berries [9]; siriguela pulp [10]; passion fruit pulp
[11]; mango puree [12]; pineapple juice [13]; mango
pulp [14]; jaboticaba pulp [15]; pitaya juice [16]; pummelo
juice [17]; blackberry juice [6]; butia pulp [18]; peach and
orange juices, and apple and marmelo pulps [28].
Zainal et al. [19] reported a pseudoplastic behavior
for pink guava juice with solid soluble contents of 9 and
11°Brix at temperatures of 60, 65, 70, 75, 80, 85, and
90°C. The consistency index (K) decreased with increasing temperature. Oliveira et al. [20] also observed the
pseudoplastic behavior for red guava pulp with 5.5°Brix,
at temperature of 20, 25, 30, and 35°C. The Ostwald-deWaele model (power law) was suitable to describe the
flow behavior in these two literature reports.
The aim of our work was to characterize red guava
pulp in terms of the rheological behavior and density, at
temperature of 10, 30, 50, and 70°C and solid soluble
contents of 5.7, 12.1, and 15.8°Brix. The observed data
were used to establish mathematical models to describe
the changes in density and viscosity as a function of
temperature and solid soluble content.
2 Materials and methods
2.1 Raw material obtaining and preparation
Five kilograms of red guava (Paluma variety) in physiological maturation stage was obtained at the local
marketing of Viçosa city, Minas Gerais, Brazil. The fruits
were received, washed in water, cut in small pieces,
and then the seeds were separated from the edible
parts. The edible parts were crushed in a microprocessor
(RI1861, Philips Wallita, Brazil). The obtained pulp was
concentrated by lyophilization (LS 3000, Terroni, Brazil)
until the solid content attained about 18.0 °Brix. Starting
from this pre-processed pulp, other solids concentrations
(5.7, 12.1, and 15.8°Brix) were obtained by dilution with
double-distilled and deionized water (electrical resistivity
equals to 18.2 MΩ cm; Millipore Inc., Milli-Q, Billerica
Headquarters, MA). The different pulps were stored in
plastic containers at –18.0°C (freezer Pratice 410 Biplex,
Consul, Brazil) until their use in the subsequent experiments. All experiments were conducted by using duplicate with two repetitions.
2.2 Solids content and pH measurements
The soluble solids content was measured by direct reading
using a portable refractometer (RT-60ATC, Instrutherm,
Brazil) with the results expressed in °Brix. The fixed solids
(minerals) content was quantified by incinerating the samples in an oven (Q318 D24, Quimis, Brazil) at 550°C and
weighting the residual. The pH values were determined
directly in the samples using a digital pH meter (pH21,
Hanna Instruments, Brazil).
2.3 Density measurements
Density (ρ; kg=m3 ) was determined by fluid displacement
in pycnometer, according to standard AOAC [21]. A 25 mL
pycnometer (nominal volume) previously calibrated with
distilled water was used. An analytical balance (M-310,
Denver Instrument, USA; accuracy of 10–4 g) was used for
all weight measurements. Analyses were carried out in
triplicate at 10, 30, 50, and 70°C, for each of the studied
pulps [(5.7, 12.1 and 15.8)°Brix]. The temperature was
controlled using a thermostatic water bath (TE-184,
Tecnal, Brazil).
2.4 Rheological measurements
Rheological measurements were performed on a rotational rheometer of coaxial cylinders (RN 4.1, Rheotest
Mendigen GMBH, Germany) coupled to a thermostatic
bath with water recirculation (RE206, Lauda, Germany).
Analyses were carried out in triplicate at 10, 30, and
50°C, for each of the studied pulps [(5.7, 12.1, and
15.8)°Brix]. Shear stress values (τ) were recorded for
the shear rate ( γ_ ) range of 0–330 s−1. Each test runs
for 3 min.
Brought to you by | Universidade Federal de Viçosa UFV
Authenticated | 10.248.254.158
Download Date | 9/12/14 4:04 PM
�R. S. Diniz et al.: Physical Properties of Guava Pulp
Three classical rheological models, Ostwald-deWaele (power law; eq. 1), Herschel-Bulkley (eq. 2), and
Casson (eq. 3), were fitted to the obtained experimental
curves, τ ¼ f( γ_ ) [22].
τ ¼ K γ_ n ;
ð1Þ
τ ¼ τ 0 þ K γ_ n ;
ð2Þ
τ 0:5 ¼ τ 0 0:5 þ KC γ_ 0:5 ;
ð3Þ
where τ ¼ shear stress, γ_ ¼ shear rate, τ0 ¼ threshold
stress needed for flow to occur (τ0 ¼ 0 for Newtonian and
power law fluids), K ¼ consistence index, Kc ¼ plastic
viscosity of Casson, and n ¼ flow index (n > 1: dilatant
fluid; n < 1: pseudoplastic fluid; if the fluid is Newtonian,
n ¼ 1 and K ; η, the viscosity).
The influence of temperature on apparent viscosity of
non-Newtonian fluids is usually modeled by an
Arrhenius-like equation (eq. 4). The effect of concentration on the apparent viscosity is usually described by a
power model (eq. 5) [23].
ηa ðT Þ ¼ ηo exp
�
Ea
RT
ηa ðC Þ ¼ K1 C A1
�
ð4Þ
ð5Þ
in eqs (4) and (5), ηa is the apparent viscosity (Pa s) at γ_ ¼
100 s−1; shear rate value usually adopted in studies involving correlations between sensory and rheological properties of food materials; Ea is the activation energy for
viscous flow (J/mol); R is the universal gas constant
(8.314 J/mol K); T is the absolute temperature (K); C is
the concentration of soluble solids (°Brix); η0, K1, and A1
are constants of the equation to be determined for
each material in specific ranges of temperatures and
concentrations. It is worth to emphasize that although
this exponential function fitted to experimental data
to describe the decrease of apparent viscosity when
increasing the temperature, values of Ea in the present
context have not a clear physical meaning. Indeed,
Arrhenius-like equations were originally used to explain
the temperature dependency of chemical reaction rates
and, in such cases, Ea represents the activation energy of
reaction [24]. Nevertheless, here Ea values should be
interpreted with caution, as they represent simple numerical coefficients enabling an adequate fitting of exponential functions to experimental data on the decrease
of apparent viscosity of materials as the temperature
rises [23].
439
The combined effect of temperature and concentration on the apparent viscosity can be described by eqs (6)
and (7) [23].
ηa ðC; T Þ ¼ a1 C b1 exp
ηa ðC; T Þ ¼ a2 exp
�
�
Ea
RT
�
Ea
þ b2 C
RT
�
ð6Þ
ð7Þ
where a1, a2, b1, and b2 are constants to be determined
for each fluid, over specific ranges of temperature and
concentration.
2.5 Models fitting
Models fitting were performed using the Statistical
Analysis System (SAS®) 9.0 software. For density data,
simple linear models ρ ¼ f(T,C) were adjusted.
Concerning the rheological data, the models represented
by eqs (1)–(3) were tested for the fluid flow behavior,
whereas those represented by eqs (4) and (5) were tested
for the variation of the apparent viscosity in function of
temperature and concentration, respectively.
The adequate fitting of non-linear models in parameters, or linear without the constant term (eqs 1–7),
was assessed in terms of the coefficient of determination
(R2 ), square root of the average square of the residue
(RQMR; eq. 8, estimated by maximum-likelihood), chisquared (χ 2 ; eq. 9), and absolute mean percentage error
(AMPE) described by eq. (10) [25–27].
sffiffiffiffiffiffiffiffiffiffiffiffiffiffiffiffiffiffiffiffiffiffiffiffiffiffiffiffiffiffiffiffiffi
n �
�2
1X
^i
RQMR ¼
Yi Y
n i¼1
χ2 ¼
Pn �
i¼1 Yi
n
Y^ i
p
�2
��
��
^ i ��
n �� Yi
Y
X
100
�
�
AMPE ¼
�
n i¼1 ��
Yi
�
ð8Þ
ð9Þ
ð10Þ
In eqs (8)–(10), Yi is the ith experimental score, Y^i is the
ith predicted score, n is the number of score pairs, and p
is the number of model parameters. The highest values
for R2 and the lowest values for RQMR, χ 2 , and AMPE
indicate the best fitting for the models. R2 was calculated
by the rate between the sum of squares of the model and
the sum of total squares. The sum of total squares not
Brought to you by | Universidade Federal de Viçosa UFV
Authenticated | 10.248.254.158
Download Date | 9/12/14 4:04 PM
�440
R. S. Diniz et al.: Physical Properties of Guava Pulp
corrected by the average was used to estimate R2 in the
models without the intercept.
The adequate fitting of linear regression models with
the constant term (β0 ; eq. 11) was assessed in terms of the
coefficient of determination (R2 ).
3 Results and discussion
Data of pH, soluble solids, and fixed solids for each
guava pulp (5.7, 12.1, and 15.8°Brix) are shown in Table 1.
Table 1 Averages and standard deviations for values of pH,
soluble solids, and ash, measured in five repetitions in red
guava pulp (Paluma variety) in maturation stage
Soluble solids (°Brix)
5.7 � 0.1
12.1 � 0.1
15.8 � 0.2
pH
Ash (%)
4.07 � 0.04
3.87 � 0.03
3.90 � 0.03
0.29 � 0.04
0.60 � 0.03
2.02 � 0.05
3.1 Density results
Density data obtained by pycnometry are given in
Table 2.
Density values decreased with increasing temperature probably due to volumetric expansion of the fluid
caused by the reduction in the intermolecular bond
strength. On the other hand, the density increased with
increasing concentration of the sample. Similar behavior
was observed for other fruit-derived materials, such as
mango pulp [14], peach and orange juices, and also apple
pulp [28].
A linear polynomial model of second degree was
adjusted to these density data in order to mathematically
describe the variation of density as a function of temperature and solid concentration, within the studied ranges
(10.0–70.0)°C and (5.7–15.8)°Brix. The best fitting was
obtained with a four-term polynomial model, described
by eq. (11), with parameter estimates presented in
Table 3.
ρðC; T Þ ¼ β0 þ β1 C þ β2 C2 þ β3 T
Guedes et al. [29] found a similar model to describe
the density of watermelon pulp as a function of temperature and solids concentration.
Ramos and Ibarz [28] reported the suitability of polynomial models to describe the density behavior of orange
and peach juices, as a function of these two parameters.
In addition, such reports demonstrated that the density is
Table 2 Averages and standard deviations for values of density (ρ) of red guava pulp (Paluma variety),
measured in five repetitions for three contents of soluble solids (°Brix) and four temperatures (°C)
Density, kg/m3
C (°Brix)
5.7 � 0.1
12.1 � 0.1
15.8 � 0.2
10.0°C
30.0°C
50.0°C
70.0°C
1,049.88 � 0.62
1,115.92 � 1.00
1,129.77 � 0.56
1,042.15 � 0.98
1,101.10 � 1.23
1,112.44 � 0.81
984.84 � 1.23
1,070.64 � 1.45
1,072.94 � 1.24
962.73 � 0.76
1,052.75 � 0.93
1,066.04 � 1.56
Table 3 Confidence limits, probability values of t-test, and parameter estimates (βi ) of the second
degree regressive linear model adjusted to density data (ρ), concentration (°Brix), and temperature (°C) of
red guava pulp (Paluma variety) in maturation stage
Parameter
β0
β1
β2
β3
Estimated value
910.26823
29.57076
−0.91918
−1.18504
ð11Þ
Confidence limits, 95%
Lower limit
Upper limit
822.06103
10.97916
−1.79435
−1.63414
998.47544
48.16237
−0.04400
−0.73594
t-value
Pr > |t|
22.71
3.50
−2.31
−5.81
< 0.0001
0.0050
0.0412
0.0001
Note: R2 ¼ 0:9242.
Brought to you by | Universidade Federal de Viçosa UFV
Authenticated | 10.248.254.158
Download Date | 9/12/14 4:04 PM
�R. S. Diniz et al.: Physical Properties of Guava Pulp
influenced by temperature in a linear manner and the
concentration in a quadratic way.
3.2 Rheology results
Three classical rheological models (Ostwald-de-Waele or
power law, Herschel-Bulkley, and Casson) were adjusted
to the experimental data, and the resulting regression
parameters are shown in Table 4. The rheograms were
registered for each guava pulp (5.7, 12.1, or 15.8°Brix) at
10.0, 30.0, 50.0, and 70.0°C.
For the Ostwald-de-Waele model, the flow behavior
index (n) varied from 0.223 to 0.406 at all conditions
evaluated. Therefore, n was less than unity which allows
the characterization of red guava pulp as pseudoplastic
non-Newtonian fluid. It was not possible to identify the
models with better adjustment to experimental data using
the R2 value as the only criterion for decision. Choice for
the best adjustments was made by putting together adequacy indicators (R2 , χ 2 , RQMR, and AMPE) in only one
empirical equation (eq. 12).
GS ¼
χ2
R2
� RQMR � AMPE
ð12Þ
In eq. (12), GS is a general score attributed to each of the
adjusted models. Higher values of GS correspond to better adjustments of the models to experimental data. In
Table 4, GS is normalized to a value rate from zero to one
hundred. The guava pulp becomes more pseudoplastic
with increasing soluble solids concentration because at a
given temperature, the consistency coefficient (K) tends
to rise and the flow behavior index (n) tends to decrease
with increasing concentration. It was also observed that
consistency coefficient decreased with increasing
temperature.
A pseudoplastic behavior for guava juice at the temperature range between 60 and 90°C for 9 and 11°Brix
was observed by Zainal et al. [19]. Also Guedes et al. [29],
Cabral et al. [13], and Anuradha et al. [12] observed the
same behavior for the watermelon pulp, pineapple juice,
and mango puree. The Ostwald-de-Waele model was
used to determine the consistency coefficient (K). These
authors observed an increase in K with the increment of
solids concentration and a decrease of K with the temperature increasing.
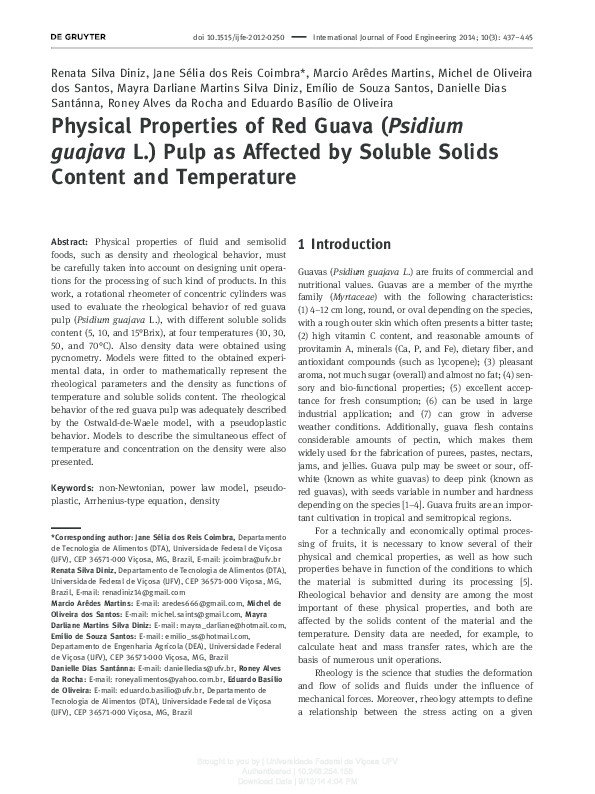
Figure 1 represents the relation between shear stress
(τ) and shear rate (_γ) at all the temperatures and all the
441
concentrations studied with red guava pulp. The shear
stress value decreased with increase in temperature at a
constant shear rate value.
Arrhenius-like model (eq. 4) proved satisfactory to
describe the temperature effect (10.0–70.0)°C on the
apparent viscosity of guava pulp (η). Estimated parameters, η0 and Ea , were obtained from 12 observations
and are reported in Table 5, for the different concentrations of soluble solids. Results of R2 > 0.91 indicate that
the adjusted models were satisfactory in all
concentrations.
It is observed that the values of the constant η0
increase with increasing the concentration of soluble
solids. On the other hand, the values of Ea decrease
when increasing concentration of 5.7–12.1 °Brix; however,
they remain closer when the concentration is increased
from 12.1 to 15.8°Brix.
Many authors observed the suitability of Arrheniuslike equations to describe the reduction on apparent
viscosity of fruits products with the increasing in
temperature such as: Ah-Hen et al. [9] for pulps and
purees from murta berries; Chuah et al. [16] for dragon
fruit (pitaya) juice; and Haminiuk et al. [18] for butia
pulp. Moraes et al. [11] also found this behavior for passion fruit pulp. The authors noted that higher temperatures increase particle mobility with a consequent
decrease in the viscosity of fruit pulp, which consists of
solid particles dispersed in a liquid medium. Indeed,
the apparent viscosity of fruit purees or pulps depends
on the concentration, size, and shape of suspended
solids [30].
To estimate the parameters of eq. (5), which relates
the effect of concentration on apparent viscosity, the
model was fitted to experimental data at all temperatures studied. The parameters of this model were
estimated from 12 observations and are presented in
Table 6.
The combined effect of temperature and concentration on the apparent viscosity of red guava pulp can be
expressed in a single equation, as in eqs (6) and (7). The
parameters of these equations were estimated from 12
observations and are presented in Table 7, together with
confidence limits, coefficient of determination, and probability values of t-test.
Due to the high coefficients of determination and
small amplitude of confidence limits, the two models
can be satisfactorily used [31–32] to describe the variation
of viscosity with concentration and temperature simulta-
Brought to you by | Universidade Federal de Viçosa UFV
Authenticated | 10.248.254.158
Download Date | 9/12/14 4:04 PM
�Ostwald-de-Waele
5.7
Brought to you by | Universidade Federal de Viçosa UFV
Authenticated | 10.248.254.158
Download Date | 9/12/14 4:04 PM
12.1
15.8
Herschel-Bulkley
5.7
12.1
15.8
Casson
5.7
12.1
15.8
Model parameters
T
(°C)
K
ðPa sn Þ
n
10.0
30.0
50.0
70.0
10.0
30.0
50.0
70.0
10.0
30.0
50.0
70.0
4.168
3.951
2.166
2.113
28.516
23.166
16.483
15.675
100.200
80.727
84.830
50.971
�
�
�
�
�
�
�
�
�
�
�
�
0.301
0. 144
0.054
0.071
1.809
0.664
0.486
0.482
2.228
0.762
1.578
1.375
0.406
0.349
0.399
0.384
0.291
0.274
0.314
0.305
0.223
0.228
0.229
0.262
�
�
�
�
�
�
�
�
�
�
�
�
0.014
0.007
0.005
0.006
0.012
0.006
0.006
0.006
0.004
0.002
0.004
0.005
10.0
30.0
50.0
70.0
10.0
30.0
50.0
70.0
10.0
30.0
50.0
70.0
3.777
4.028
2.085
1.311
24.042
77.259
29.947
24.636
22.179
82.528
57.757
251.600
�
�
�
�
�
�
�
�
�
�
�
�
2.620
1.744
0.590
0.442
25.136
40.669
13.407
11.207
3.788
17.542
21.404
122.700
0.419
0.346
0.404
0.450
0.312
0.150
0.243
0.251
0.410
0.226
0.272
0.110
�
�
�
�
�
�
�
�
�
�
�
�
0.096
0.056
0.038
0.047
0.129
0.046
0.050
0.052
0.023
0.023
0.044
0.035
10.0
30.0
50.0
70.0
10.0
30.0
50.0
70.0
10.0
30.0
50.0
70.0
Kc
ðPa s0:5 Þ
τ0
ðPaÞ
0.944
−0.153
0.193
1.964
7.750
−71.785
−21.723
−14.362
131.700
−2.538
40.310
−245.900
�
�
�
�
�
�
�
�
�
�
�
�
6.444
3.418
1.406
1.210
44.813
48.342
19.804
16.757
9.036
24.629
33.851
135.500
10.483
9.035
5.505
5.169
58.761
45.920
35.636
32.799
175.400
143.400
150.600
97.646
�
�
�
�
�
�
�
�
�
�
�
�
0.668
0.396
0.213
0.190
2.780
1.834
1.415
1.379
2.270
3.519
3.588
4.008
0.191
0.139
0.131
0.122
0.269
0.221
0.232
0.218
0.336
0.310
0.320
0.305
�
�
�
�
�
�
�
�
�
�
�
�
0.007
0.005
0.003
0.003
0.013
0.010
0.008
0.009
0.006
0.011
0.011
0.015
Adequacy indicators
2
2
RQMR
AMPE
GS
0.9993
0.9998
0.9999
0.9998
0.9994
0.9999
0.9999
0.9998
0.9999
0.9999
0.9999
0.9999
0.8554
0.1161
0.0246
0.0391
10.7068
1.2672
0.9309
0.9021
9.5306
1.1505
4.9933
5.0356
0.8651
0.3187
0.1467
0.1849
3.0608
1.0530
0.9025
0.8885
2.8878
1.0034
2.0902
2.0991
1.8667
1.0069
0.7683
1.1770
1.7927
0.9484
0.9815
0.8910
0.7872
0.2447
0.6200
0.9078
0.20
7.44
100.00
32.58
0.00
0.22
0.34
0.39
0.01
0.98
0.04
0.03
0.9880
0.9958
0.9986
0.9972
0.9800
0.9970
0.9968
0.9961
0.9993
0.9992
0.9973
0.9981
0.9198
0.1250
0.0264
0.0365
11.5057
0.8838
0.8761
0.8963
1.6801
1.2380
4.9845
2.2458
0.8645
0.3187
0.1466
0.1722
3.0575
0.8474
0.8437
0.8534
1.1684
1.0029
2.0124
1.3508
1.8831
1.0154
0.7655
0.9782
1.7412
0.7857
0.8820
0.8825
0.2816
0.2430
0.5719
0.5550
0.18
6.83
93.46
44.97
0.00
0.47
0.42
0.41
0.50
0.92
0.05
0.16
0.9990
0.9994
0.9996
0.9996
0.9991
0.9993
0.9994
0.9993
0.9999
0.9997
0.9997
0.9992
1.3249
0.3921
0.1245
0.0997
16.1795
6.8870
4.3758
4.3349
9.8317
23.5922
24.7343
33.0686
1.0767
0.5857
0.3300
0.2953
3.7626
2.4548
1.9567
1.9476
2.9330
4.5435
4.6522
5.3791
2.9228
2.0622
1.8283
1.8255
2.2236
2.1728
2.1690
2.3324
0.8021
1.5887
1.4561
2.4963
0.07
0.58
3.69
5.16
0.00
0.01
0.01
0.01
0.01
0.00
0.00
0.00
R
χ
R. S. Diniz et al.: Physical Properties of Guava Pulp
C
(°Brix)
442
Table 4 Average values and standard deviations of estimates of regressive model parameters by Ostwald-de-Waele, Herschel-Bulkley, and Casson, used for the rheological characterization
of red guava pulp, Paluma variety, in maturation stage. Adequacy indicators R2 , χ 2 , RQMR, and AMPE describe the quality of model adjustments to experimental data. GS is a general score,
obtained from adequacy indicators
�443
R. S. Diniz et al.: Physical Properties of Guava Pulp
200
50
40
Shear stress (Pa)
Shear stress (Pa)
150
30
20
100
50
10
0
0
0
50
100
150
200
250
300
350
0
50
100
Shear rate (s–1)
150
200
250
300
350
Shear rate (s–1)
(b)
(a)
400
Shear stress (Pa)
300
200
100
0
0
50
100
150
200
250
300
350
Shear rate (s–1)
(c)
Figure 1 Rheograms with average values and standard deviations of shear stress (τ, Pa) and shear rate (_γ, s 1 ) of red guava pulp, Paluma
variety, in maturation stage, for different concentrations of soluble solids and temperature values: (a) 5.7°Brix, (b) 12.1°Brix, and (c) 15.8°
Brix. Temperatures: ●, 10.0°C; H , 30.0°C; and ■, 50.0°C. Lines: Ostwald-de-Waele model
Table 5 Averages and standard deviations of estimates of
Arrhenius-like model parameters used to assess the effect of
temperature (T; K) on the apparent viscosity (η) of red guava pulp,
Paluma variety, in maturation stage, for the different concentrations
of soluble solids
C (°Brix)
5.7 � 0.1
12.1 � 0.1
15.8 � 0.2
η0 (Pa s)
E a (kJ/mol)
R2
2.08 � 0.01
104.87 � 0.05
150.00 � 0.01
11.44
5.31
6.89
0.980
0.910
0.990
Table 6 Averages and standard deviations of estimates of
exponential model parameters used to assess the effect of
concentration (°Brix) on the apparent viscosity (η) of red guava pulp,
Paluma variety, in maturation stage, for the different temperatures
T (°C)
10.0
30.0
50.0
70.0
K1 (Pa sA1 )
3.16
5.04
3.85
2.49
�
�
�
�
0.00
0.00
0.00
0.00
Brought to you by | Universidade Federal de Viçosa UFV
Authenticated | 10.248.254.158
Download Date | 9/12/14 4:04 PM
2.51
2.26
2.30
2.41
�
�
�
�
A1
R2
0.24
0.01
0.07
0.02
0.994
0.996
0.999
0.996
�444
R. S. Diniz et al.: Physical Properties of Guava Pulp
Table 7 Confidence limits, probability values of t-test, and estimates of Arrhenius-like model parameters adjusted to the data of
concentration (°Brix), temperature (°C), and apparent viscosity (η) of red guava pulp, Paluma variety, in maturation stage
Equation (R2 )
Parameter
Estimated value
Confidence limits, 95%
Lower limit
Upper limit
t-value
Pr > |t|
4 (0.998)
a1
b1
Ea
2:56 � 10 4
2.379537
807.1639
2:02 � 10 4
2.318737
766.0768
3:10 � 10 4
2.440337
848.2510
4.75
39.16
19.65
0.0010
<0.0001
<0.0001
5 (0.993)
a2
b2
Ea
6:710 � 10 3
0.211385
811.0146
4:916 � 10 3
0.202775
739.4470
8:496 � 10 3
0.219995
882.5822
3.75
24.56
11.33
0.0046
<0.0001
<0.0001
neously and thus can be very useful in engineering
calculations.
Acknowledgments: The authors wish to acknowledge the
CNPq, FAPEMIG, and FINEP for their financial support.
4 Conclusions
Nomenclature
The red guava pulp behaved as a non-Newtonian pseudoplastic fluid. The model of Ostwald-de-Waele can be
used to describe the rheological behavior of the pulp. The
Arrhenius-like equation described the effect of temperature for red guava pulp, indicating the decrease trend of
apparent viscosity with temperature increasing.
Exponential model can be used to evaluate the effect of
concentration on apparent viscosity of the pulp. In addition, models that describe the variation of density and
viscosity as a function of temperature and concentration
found in this study are of importance for process optimization in the food industry.
A1
C
Ea
K
K1
Kc
N
R
T
Η
ηa
γ_
Ρ
Τ
τ0
Constant (eq. 5)
Concentration of soluble solids (°Brix; eq. 5)
Activation energy of flow (J/mol; eq. 4)
Consistency index (Pa sn; n: flow behavior index; eqs 1–3)
Constant (eq. 5)
Plastic viscosity of Casson (Pa s; eq. 3)
Flow behavior index (eqs 1 and 2)
Universal gas constant (8.314 J/mol K; eq. 4)
Absolute temperature (K; eq. 4)
Constant (eq. 4)
Apparent viscosity (Pa s; eqs 4 and 5)
Shear rate (s−1; eqs 1–3)
Density (kg/m3; eq. 9)
Shear stress (Pa; eqs 1–3)
Threshold stress (Pa; eqs 2 and 3)
References
1. Osorio C, Forero DP, Carriazo JG. Characterization and performance assessment of guava (Psidium guajava L.)
Microencapsulates obtained by spray drying. Food Res Int
2011;44:1174–81.
2. Restrepo-Sanchez DC, Narvaez-Cuenca CE, Restrepo-Sanchez
LP. Extraction of compounds with antioxidant activity in guava
(Psidium guajava L.) fruit produced in Velez-Santander,
Colombia. Química Nova 2009;32:1517–22.
3. Steinhaus M, Sinuco D, Polster C, Osorio C, Schieberle P.
Characterization of the key aroma compounds in pink guava
(Psidium guajava L.) by means of aroma re-engineering
experiments and omission tests. J Agric Food Chem
2009;57:2882–8.
4. Tangirala S, Sarkar BC, Sharma HK, Kumar N. Modeling and
characterization of blended guava pomace and pulse powder
based rice extrudates. Int J Food Eng 2012;8:Article 1.
DOI:10.1515/1556-3758.2366.
5. Alstolfi-Filho Z, Telis VR, Oliveira EB, Coimbra JS, Telis-Romero
J. Rheology and fluid dynamics properties of sugarcane juices.
Biochem Eng J 2011;53:260–5.
6. Cabral RA, Orrego-Alzate CE, Gabas AL, Telis-Romero J.
Rheological and thermophysical properties of blackberry
juice. Ciên Tecnologia Alimentos 2007;27:589–95.
DOI:10.1590/S0101-20612007000300025.
7. Chen J. Food oral processing – a review. Food Hydrocolloids
2009;23:1–25.
8. Tabilo-Munizaga G, Barbosa-Canovas GV. Rheology for the
food industry. J Food Eng 2005;67:147–56.
9. Ah-Hen KS, Vega-Galvez A, Moraga NO, Lemus-Mondaca R.
Modelling of rheological behaviour of pulps and purees from
fresh and frozen-thawed murta(UGNIMOLINaeTURCZ) berries.
Int J Food Eng 2012;8:Article 6. DOI:10.1515/1556-3758.2738.
10. Augusto PE, Cristianini M, Ibarz A. Effect of temperature on
dynamic and steady-state shear rheological properties of
Brought to you by | Universidade Federal de Viçosa UFV
Authenticated | 10.248.254.158
Download Date | 9/12/14 4:04 PM
�R. S. Diniz et al.: Physical Properties of Guava Pulp
11.
12.
13.
14.
15.
16.
17.
18.
19.
siriguela (Spondias purpurea L.) pulp. J Food Eng
2012;108:283–9.
Moraes IC, Fasolin L, Cunha RL, Menegalli FC. Dynamic and
steady-shear rheological properties of xanthan and guar gums
dispersed in yellow passion fruit pulp (Passifloraedulis f.
flavicarpa). Braz J Chem Eng 2011;28:483–94.
Anuradha G, Ramaswamy HS, Ahmed J. Effect of soluble solids
concentration and temperature on thermo-physical and
rheological properties of mango puree. Int J Food Properties
2011;14:1018–36.
Cabral RA, Gut JA, Telis VR, Telis-Romero J. Non-Newtonian
flow and pressure drop of pineapple juice in a plate heat
exchanger. Braz J Chem Eng 2010;27:563–71.
Bon J, Vaquiro H, Benedito J, Telis-Romero J. Thermophysical
properties of mango pulp (Mangifera indica L. cv. Tommy
Atkins). J Food Eng 2010;97:563–8.
Sato AC, Cunha RL. Effect of particle size on rheological
properties of jaboticaba pulp. J Food Eng 2009;91:566–70.
Chuah TG, Ling HL, Chin NL, Choong TS, Fakhru’l-Razi A. Effects
of temperatures on rheological behavior of dragon fruit
(Hylocereus sp.) juice. Int J Food Eng 2008;4:Article 4.
DOI:10.2202/1556-3758.1519.
Chuah TG, Keshani S, Chin NL, Lau MC, Chin DS.
Rheological properties of diluted pummelo juice as affected by
three different concentrations. Int J Food Eng 2008;4:Article 1.
DOI:10.2202/1556-3758.1299.
Haminiuk CW, Sierakowski MR, Maciel GM, Vidal JR,
Branco IG, Masson ML. Rheological properties of butia
pulp. Int J Food Eng 2006;2:Article 4.
DOI:10.2202/1556-3758.1039.
Zainal BS, Abdulrahman R, Ariff AB, Saari BN. Thermophysical
properties of pink guava juice at 9 and 11°brix. J Food Process
Eng 2001;24:87–100.
445
20. Oliveira RC, Rossi RM, Barros ST. Estudo do efeito da temperatura sobre o comportamento reologico das polpas de
gabiroba e goiaba. Acta Sci Technol 2011;33:31–7.
21. Williams S. Official methods of analysis of the association of
official analytical chemists, 14th ed. Washington, USA:
AOAC Inc., 1990.
22. Steffe JF. Rheological methods in food process engineering,
2nd ed. East Lansing, MI: Freeman Press, 1996.
23. Rao MA. Rheology of fluid and semisolid foods, 2nd ed.
Geneva: Springer, 2010.
24. Smith JM, Van Ness HC, Abbott MM. Introduction to chemical
engineering thermodynamics, 7th ed. Boston, USA: McGraw
Hill Higher Education, 2005.
25. Ferreira LF, Pirozi MR, Ramos AM, Pereira JA. Modelagem
matemática da secagem em camada delgada de bagaço de
uva fermentado. Pesq. Agropec. Bras. Brasília 2012;47:855–62.
26. Kvalseth TO. Cautionary note about R2. Am Stat 1985;39:279–85.
27. Searle SR. Linear models. New York: John Wiley & Sons,
1971:532p.
28. Ramos AM, Ibarz A. Density of juice and fruit puree as a
function of soluble solids content and temperature. J Food
Eng 1998;35:57–63.
29. Guedes DB, Ramos AM, Diniz MD. Effect of temperature and
concentration on the physical properties of watermelon pulp.
Braz J Food Technol 2010;13:279–85.
30. Saravacos GD. Effect of temperature on viscosity of fruit juices
and purees. J Food Sci 1970;5:12–125.
31. Lane DM, Scott D, Hebl M, Guerra R, Osherson D, Zimmer H.
Online statistics education: an interactive multimedia course
of study. Houston, TX; http://onlinestatbook.com/
Online_Statistics_Education.pdf. Accessed: 25 Oct 2013.
32. Ratkowsky DA. Handbook of nonlinear regression models. New
York and Basel: Marcel Dekker, 1990:241p.
Brought to you by | Universidade Federal de Viçosa UFV
Authenticated | 10.248.254.158
Download Date | 9/12/14 4:04 PM
�
 Jane Coimbra