Peleliu’s Forgotten WWII Battlefield
Toni L. Carrell, John H.R. Burns, Jennifer F. McKinnon, Michael C. Krivor, Jeff Enright
Madeline J. Roth, Kailey Pascoe, Jason T. Raupp, W. Shawn Arnold, Mark Keusenkothen
2020
�Photographs Top: LVTs racing to shore, Sept 15, 1944, NARA RG-127. Bottom: UHM Library Margo
Duggen Collection, 1951.
�Peleliu’s Forgotten WWII Battlefield
NOAA Ocean Exploration Research Program
Grant Agreement No. NA17OAR0110214
Toni L. Carrell, John H.R. Burns, Jennifer F. McKinnon, Michael C. Krivor, Jeff Enright
Madeline J. Roth, Kailey Pascoe, Jason T. Raupp, W. Shawn Arnold, Mark Keusenkothen
2020
This material is based upon work assisted by a grant from the Department of Commerce, National Oceanic and Atmospheric
Administration. Any opinions, findings, and conclusions or recommendations expressed in this material are those of the
author(s) and do not necessarily reflect the views of the Department of Commerce.
�Recommended Citation:
Carrell, T.L., J.H.R. Burns, J.F. McKinnon, M.C. Krivor, J. Enright, M.J. Roth, K. Pascoe, J.T.
Raupp, W.S. Arnold, M. Keusenkothen
2020
Peleliu’s Forgotten WWII Battlefield. Prepared under Grant NA17OAR0110214 for
NOAA Ocean Exploration and Research Program. Ships of Exploration and Discovery
Research, Inc., Santa Fe.
ii
�Acknowledgements
This project would not have occurred without the help of a number of individuals and groups.
The Palau Historic Preservation Office was instrumental in making this project happen, clearing
the way for a site visit and assisting with the field reconnaissance. Special thanks go to Sunny
Ngirmang, HPO, and Calvin T. Emesiochel, Deputy HPO. Both were extremely helpful and
gracious with their time and support.
The agencies and organizations that supported this project on island include the Office of the
President Republic of Palau, the Office of the Governor State of Peleliu, the Belau National
Museum, the Office of the Palau Automated Land and Resource Information Systems
(PALARIS), the Palau National Aviation Administration, and the Bureau of Customs and Border
Protection.
Thanks go to Shawn Arnold, Jeff Enright, Michael Krivor, Mark Keusenkothen, Jason Nunn, and
Jason Raupp; their fieldwork skills, hard work, and sense of humor made the project memorable
in the best possible way. A special thank you goes to Madeline Roth, for her amazing GIS skills,
and to Jennifer McKinnon, for throwing caution to the wind and getting involved in yet another
joint project. Both women also contributed their considerable research, writing, and investigative
expertise.
I also want to thank John Burns and Kailey Pascoe, University of Hawai’i Hilo, for
enthusiastically embracing a somewhat unusual project from the standpoint of coral studies.
Their willingness to explore the possibility that the WWII Underwater Demolition Team blast
zones might yield interesting data on coral recovery and their 3D characterization of the
underwater cultural heritage sites contributed greatly to a better understanding of coral health
and the impact of corals on the survivability of the archeological sites. The project and this report
benefited greatly from everyone on this team.
A thank you is also extended to the NOAA Ocean Exploration and Research program and Frank
Cantelas. A National Park Service American Battlefield Protection Program Grant (GA-2287-17015) augmented the NOAA-OER funds, allowing for a longer site visit and expanded KOCOA
analysis.
Toni L. Carrell, Santa Fe
Ships of Discovery
iii
�Table of Contents
Acknowledgements ........................................................................................................................ iii
Table of Contents ........................................................................................................................... iv
List of Figures ............................................................................................................................... vii
List of Tables ............................................................................................................................... xiii
List of Acronyms and Abbreviations ........................................................................................... xiii
Executive Summary ...................................................................................................................... 14
Chapter 1: Introduction ................................................................................................................. 15
Introduction ............................................................................................................................... 15
Chapter 2: Remote Sensing ........................................................................................................... 20
Remote Sensing Survey ............................................................................................................ 20
Side-Scan Sonar .................................................................................................................... 20
Analysis............................................................................................................................. 21
Magnetometer Survey ........................................................................................................... 26
Methodology and Equipment ............................................................................................ 26
Data Analysis .................................................................................................................... 31
Magnetometer Results .......................................................................................................... 34
Correlation of Clustered Magnetic Anomalies ................................................................. 37
Correlation of Isolated Magnetic Anomalies .................................................................... 44
Summary ........................................................................................................................... 46
Chapter 3: Identification of Underwater Cultural Heritage Sites ................................................. 47
Reef Towed Swimmer Survey .................................................................................................. 47
Tractor with Blade ................................................................................................................ 48
Navy Stockless Anchors ....................................................................................................... 51
Pontoons................................................................................................................................ 54
LVT Wreck ........................................................................................................................... 61
LVT Dump Site..................................................................................................................... 64
Lagoon Survey .......................................................................................................................... 67
DUKW (Amphibious Truck) ................................................................................................ 68
LCM (Landing Craft, Mechanized) ...................................................................................... 77
US Aircraft ............................................................................................................................ 81
Chapter 4: Terrestrial Inshore Survey ........................................................................................... 91
Introduction ............................................................................................................................... 91
iv
�Previously Recorded Japanese Defensive Positions ............................................................. 95
Previously Unrecorded Japanese Defensive Positions ......................................................... 96
Chapter 5: Biological Characterization....................................................................................... 101
Introduction ............................................................................................................................. 101
Methodology ....................................................................................................................... 101
UDT Blast Impacts on Reef Structures ................................................................................... 102
Results ................................................................................................................................. 103
Benthic Characterization................................................................................................. 103
Percent Coral Cover ........................................................................................................ 104
3D Surface Area Complexity.......................................................................................... 106
Discussion ........................................................................................................................... 108
Summary ............................................................................................................................. 109
Underwater Cultural Heritage Sites ........................................................................................ 110
Results ................................................................................................................................. 110
Tractor with Blade .......................................................................................................... 110
LVT Dump Site Wreck #1 .............................................................................................. 111
LVT Dump Site Full Model ............................................................................................ 112
LVT Wreck ..................................................................................................................... 113
Pontoon Barge ................................................................................................................. 114
Summary ............................................................................................................................. 114
Chapter 6: KOCOA Analysis...................................................................................................... 115
Introduction ............................................................................................................................. 115
Pre-invasion Planning ............................................................................................................. 117
Pre-invasion Beach Reconnaissance ................................................................................... 119
D-Day Landing and Initial Assault ......................................................................................... 121
White Beaches .................................................................................................................... 122
Orange Beaches .................................................................................................................. 126
Aftermath of the Landing and Beach Modifications .............................................................. 130
Summary of KOCOA Features and Battlefield Boundaries ............................................... 131
Post-Battle Landscape Modification and Integrity ............................................................. 131
Battlefield, Core, and PotNR Boundaries ....................................................................... 134
Chapter 7: Conclusion................................................................................................................. 135
References Cited ......................................................................................................................... 137
Appendix 1: Summary Table of Sites Revisited or Documented ............................................... 143
v
�vi
�List of Figures
Figure 1. Location of Palau in the Western Caroline Islands. USMC map, n.d. ......................... 15
Figure 2. Location of Peleliu at the southern end of the island chain. Hough 1950:5, Map 2. ... 16
Figure 3. Project Area. Map by Roth/Ships of Discovery Science Team. ................................... 18
Figure 4. Side scan track plots and targets. Map by SEARCH, Inc............................................. 21
Figure 5. Historic map used for pre-planning and survey during the current investigation (Palau
Islands “Peleliu I. and Angaur I.”; from U.S.S. Hydrographer Survey November 1944 – January
1945). ............................................................................................................................................ 27
Figure 6. Six planned track lines (in blue), spaced at 20 meters, were plotted to conduct the
magnetometer survey along the west coast of Peleliu (Palau Islands “Peleliu I. and Angaur I.”;
from U.S.S. Hydrographer Survey November 1944 – January 1945). Krivor/Recon Offshore. .. 28
Figure 7. Nearshore conditions were ideal for the magnetometer survey. View to southeast along
exposed reef line and landing beaches, Peleliu. Carrell/Ships of Discovery Science Team. ....... 29
Figure 8. Panasonic Toughbook survey laptop outfitted with Hypack® Navigation Software and
Trimble® DSM-232 dGPS (yellow box). Carrell/Ships of Discovery Science Team. ............... 30
Figure 9. Geometrics G-882 magnetometer. Carrell/Ships of Discovery Science Team. ........... 30
Figure 10. A CAT INV2000 inverter generator provided power during the magnetometer survey.
Carrell/Ships of Discovery Science Team. ................................................................................... 31
Figure 11. Prepping for the magnetometer survey aboard the M/V Dukl out of Koror, Palau.
Carrell/Ships of Discovery Science Team. ................................................................................... 32
Figure 12. The exposed reef and shallow water prevented two track lines from being completed.
View east toward exposed reef line; Peleliu in the background. Carrell/Ships of Discovery
Science Team. ............................................................................................................................... 32
Figure 13. Typical single beam window showing data spreadsheet (time stamp, X/Y location,
and gamma reading), survey window (showing survey vessel track line), and profile window
(showing magnetic anomalies along a given track line). Krivor/Recon Offshore. ....................... 33
Figure 14. Magnetic Contour Map 1 of the Peleliu Landing Beach; contour interval equals 5
gammas (Palau Islands “Peleliu I. and Angaur I.”; from U.S.S. Hydrographer Survey November
1944 – January 1945). Krivor/Recon Offshore............................................................................. 34
Figure 15. Magnetic Contour Map 2 of the Peleliu Landing Beach; contour interval equals 5
gammas (Palau Islands “Peleliu I. and Angaur I.”; from U.S.S. Hydrographer Survey November
1944 – January 1945). Krivor/Recon Offshore............................................................................. 35
Figure 16. Magnetic Contour Map 3 of the Peleliu Landing Beach; contour interval equals 5
gammas (Palau Islands “Peleliu I. and Angaur I.”; from U.S.S. Hydrographer Survey November
1944 – January 1945). Krivor/Recon Offshore............................................................................. 35
Figure 17. Magnetic Contour Map 4 of the Peleliu Landing Beach; contour interval equals 5
gammas (Palau Islands “Peleliu I. and Angaur I.”; from U.S.S. Hydrographer Survey November
1944 – January 1945). Krivor/Recon Offshore............................................................................. 36
Figure 18.Magnetic contour map of Targets M1 and M8]; Contour interval equals 5 gammas
(Palau Islands “Peleliu I. and Angaur I.”; from U.S.S. Hydrographer Survey November 1944 –
January 1945). Krivor/Recon Offshore......................................................................................... 37
Figure 19. Magnetic contour map of Targets M1 and M8 with previously documented targets
(P.05 and P.11) plotted; Contour interval equals 5 gammas (Palau Islands “Peleliu I. and Angaur
I.”; from U.S.S. Hydrographer Survey November 1944 – January 1945). Krivor/Recon Offshore.
....................................................................................................................................................... 38
vii
�Figure 20. Magnetic contour map of Targets M2 and M11 with previously documented targets
(Ships025 and Ships035) plotted; Contour interval equals 5 gammas (Palau Islands “Peleliu I.
and Angaur I.”; from U.S.S. Hydrographer Survey November 1944 – January 1945).
Krivor/Recon Offshore. ................................................................................................................ 39
Figure 21. Magnetic Targets M3, M4, M14, and M19 are located near the entrance to the
manmade jetty near the south end of the project area; Contour interval equals 5 gammas (Palau
Islands “Peleliu I. and Angaur I.”; from U.S.S. Hydrographer Survey November 1944 – January
1945). Krivor/Recon Offshore. ..................................................................................................... 40
Figure 22. Magnetic Targets M3, M4, M14, and M19 and Targets Ships023 represent the
remains of a Pontoon Barge and Pontoon Fragments; Contour interval equals 5 gammas (Palau
Islands “Peleliu I. and Angaur I.”; from U.S.S. Hydrographer Survey November 1944 – January
1945). Krivor/Recon Offshore. ..................................................................................................... 41
Figure 23. Magnetic Targets M12 and M16; Contour interval equals 5 gammas (Palau Islands
“Peleliu I. and Angaur I.”; from U.S.S. Hydrographer Survey November 1944 – January 1945).
Krivor/Recon Offshore. ................................................................................................................ 41
Figure 24. Magnetic Targets M12 and M16 and previously documented targets located nearby;
Contour interval equals 5 gammas (Palau Islands “Peleliu I. and Angaur I.”; from U.S.S.
Hydrographer Survey November 1944 – January 1945). Krivor/Recon Offshore. ...................... 42
Figure 25. Magnetic Targets M13 and M18; Contour interval equals 5 gammas (Palau Islands
“Peleliu I. and Angaur I.”; from U.S.S. Hydrographer Survey November 1944 – January 1945).
Krivor/Recon Offshore. ................................................................................................................ 43
Figure 26. Magnetic Targets M13 and M18 are associated with Target Ships038 identified as an
LVT; Contour interval equals 5 gammas (Palau Islands “Peleliu I. and Angaur I.”; from U.S.S.
Hydrographer Survey November 1944 – January 1945). Krivor/Recon Offshore. ...................... 43
Figure 27. Magnetic Target M10; Contour interval equals 5 gammas (Palau Islands “Peleliu I.
and Angaur I.”; from U.S.S. Hydrographer Survey Nov. 1944 – January 1945). Krivor/Recon
Offshore. ....................................................................................................................................... 44
Figure 28.Magnetic Target M10 and previously documented anomalies in the area; Contour
interval equals 5 gammas (Palau Islands “Peleliu I. and Angaur I.”; from U.S.S. Hydrographer
Survey November 1944 – January 1945). Krivor/Recon Offshore. ............................................. 45
Figure 29. Caterpillar D4 Tractor, Type 2T. U.S. Army, War Department, Figure 2, 1943. ...... 49
Figure 30. Tractors on the Peleliu shoreline after the successful capture of the southern beaches.
Norm Hatch Collection, National Museum of the Pacific War, image Peleliu 031, 1944. .......... 50
Figure 31. Nearly intact tractor with blade off Orange beach (Ships027). View is from the right
rear. McKinnon/Ships of Discovery Science Team. ..................................................................... 50
Figure 32. Admiralty anchor. The Mariners’ Museum and Park. ................................................ 51
Figure 33. Stockless anchor. The Mariners’ Museum and Park. ................................................. 52
Figure 34. Navy stockless anchor (Ships030). The shank is 2.50m long, and the flukes are
1.15m. The anchor was found in a scatter of unidentifiable debris. Raupp/Ships of Discovery
Science Team. ............................................................................................................................... 53
Figure 35. Navy stockless (Ships021) anchor in approximately 40 ft. of water. Carrell/Ships of
Discovery Science Team............................................................................................................... 53
Figure 36. Navy Anchor (Ships028) located off White Beach. The shank is 1.14m long, and the
flukes are 1.35m wide. Raupp/Ships of Discovery Science Team. .............................................. 54
Figure 37. Stockpile of pontoons at Port Hueneme. Note the absence of right angles at the
corners of each pontoon. Department of the Navy, Bureau of Yards and Docks 1947a:158. ...... 55
viii
�Figure 38. Pontoon causeway section being released from the side of an LST. Department of the
Navy, Bureau of Yards and Docks 1947b:78. .............................................................................. 56
Figure 39. Pontoon causeways and LSTs at Purple Beach, Peleliu. NARA RG-127 .................. 57
Figure 40. Causeway on Peleliu at Orange Beach 3. Hough 1950:22. ........................................ 57
Figure 41. Soldiers land on Peleliu using pontoon causeway. Hough 1950:110. ........................ 58
Figure 42. Pontoon barge with crane at Peleliu. Hough 1950:24; Department of Defense Photo,
USMC 95354. ............................................................................................................................... 59
Figure 43. Harbor at Peleliu. Department of the Navy, Bureau of Yards and Docks 1947b:331.60
Figure 44. Remains of a pontoon used in the construction of the harbor. Roth/Ships of Discovery
Science Team. ............................................................................................................................... 60
Figure 45. 3D model of the three sections of pontoon found outside the harbor in approximately
40 ft. of water. Model rendering by Pascoe/UHH/Ships of Discovery Science Team. ................ 61
Figure 46. LVT-2/LVT-4 could carry up to 24 troops with a crew of 2-3. Photo
Milityfactory.com. ........................................................................................................................ 62
Figure 47. Portion of the disarticulated remains of an LVT (Ships032). Raupp/Ships of
Discovery Science Team............................................................................................................... 63
Figure 48. Roller assembly from disarticulated remains of an LVT (Ships032). Raupp/Ships of
Discovery Science Team............................................................................................................... 63
Figure 49. Cannon-mounting LVT(A)-1. Photo http://www.tanksencyclopedia.com/ww2/US/photos/photo_us_lvt-2_1-cdts-TheWorldWarsnet.jpg .................... 64
Figure 50. 3D image of an LVT (A)-4 dumped offshore of Camp Beck. 3D Model by Burns and
Pascoe/UHH/Ships of Discovery Science Team. ......................................................................... 65
Figure 51. LVT #2 has collapsed under the weight of the coral (Ships039). 3D model by
Burns/UHH/Ships of Discovery Science Team. ........................................................................... 65
Figure 52. LVT #3 (Ships040) (annotated #3) is nearly indistinguishable from the corals in
which it is embedded. 3D model by Burns/UHH/Ships of Discovery Science Team. ................. 66
Figure 53. Drawing of DUKW from US Army Service Manual. Note the dual rear wheels.
(ww2db.com). ............................................................................................................................... 69
Figure 54. DUKW using aft-mounted A-frame boom to load jeep onto a CCKW 6 x 6 truck.
Headquarters United States Army Forces, Pacific Ocean Areas 1944:2. ..................................... 71
Figure 55. DUWK smoldering on beach Peleliu after taking a direct hit. Norm Hatch Collection,
National Pacific War Museum, image Peleliu 039, 1944. ............................................................ 74
Figure 56. Wheel rims and axles from a DUKW exposed during low tide off White Beach 2
(Ships052). Carrell/Ships of Discovery Science Team................................................................. 76
Figure 57. DUKW wheel in shallow water off Orange Beach 1 (Ships015). Arnold/Ships of
Discovery Science Team............................................................................................................... 76
Figure 58. The LCM in Peleliu is likely similar to the pictured LCM(3) offloading a bulldozer
on the Aleutian Islands in April 1945. Greenfield, 1952, pg. 181. ............................................... 77
Figure 59. LCM-3 production line at the Boston Naval Shipyard 1942. NARA 7326808 ......... 78
Figure 60. LCM-3 ship model plans, modified. Vintage Model Plans Full Sized Printed Plans
Landing Craft Mechanized; adapted by East Carolina University Program in Maritime Studies;
https://www.vintagemodelplans.com/products/full-size-printed-plan-landing-craft-mechanizedscale-1-16-l37-b-10-suitable-for-radio-control. ............................................................................ 79
Figure 61. Aerial view of LCM in the shallow lagoon at Orange Beach 3. The nearly 13m by 4
m remains are barely awash at high tide and completely exposed at low tide. Raupp/Ships of
Discovery Science Team............................................................................................................... 80
ix
�Figure 62. Camp Beck LCM site. Map by Raupp/Ships of Discovery Science Team. ............... 81
Figure 63. Inverted wing section with three .50 caliber gun ports and square light port to the
right outlined in red circle. Note the bend to the right of light port. Keusenkothen/Ships of
Discovery Science Team............................................................................................................... 82
Figure 64. F4U Corsair inverted gull wing showing gun port and square light port outlined in red
circle. Photograph by Julian Hertzog, Wikipedia Creative Commons. ........................................ 83
Figure 65. Inverted wing. Note rectangular and circular ports patterns. McKinnon/Ships of
Discovery Science Team............................................................................................................... 83
Figure 66. F4U Corsair underside of starboard wing. Note rectangular and circular ports patterns
similar to the wreckage. Photo by Kevin Reynolds
http://warbirdlegends.com/Allied_Fighters.html)......................................................................... 84
Figure 67. Aerial view of the aircraft wing at low tide in the lagoon. The landing strut is visible
at the bottom of the photo. Raupp/Ships of Discovery Science Team. ........................................ 85
Figure 68. Detached strut located in shallow water. Arnold/Ships of Discovery Science Team. 86
Figure 69. Radial engine exposed on the reef. Arnold/Ships of Discovery Science Team. ........ 87
Figure 70. Radial engine. Keusenkothen/Ships of Discovery Science Team. ............................. 87
Figure 71. Possible engine cowling. Keusenkothen/Ships of Discovery Science Team. ............ 88
Figure 72. Curved piece of aluminum fuselage. McKinnon/Ships of Discovery Science Team. 88
Figure 73. Disarticulated portion of the main beam assembly center section of the inverted gull
wing shape. Keusenkothen/Ships of Discovery Science Team. ................................................... 89
Figure 74. Disarticulated portion of the main beam assembly center section of the inverted gull
wing shape. Keusenkothen/Ships of Discovery Science Team. ................................................... 89
Figure 75. Main Beam Assembly http://www.scharch.org/Ed_Scharch/usn-aircraft/07-f4ucorsair.html. .................................................................................................................................. 90
Figure 76. Section of an August 1945 Japanese defensive plan. The red arrows are the Japanese
presumed US avenues of approach for the invasion. The blue arrows represent the fields of fire
of the gun emplacements across the invasion beaches and reef. The blue half-circles on the
beaches represent general defensive positions. Peleliu State Museum......................................... 91
Figure 77. A section of the southern invasion beach with the historic UDT blast zones map
overlaying a modern aerial. Two of the blast zones are at the top. Immediately after the invasion,
the Seabees extensively modified a shallow coral flat and created a small harbor. Map by
Roth/Ships of Discovery Science Team. .................................................................................... 102
Figure 78. Percent cover of benthic types found among regions. Pascoe and Burns/UHH/Ships
of Discovery Science Team. ....................................................................................................... 103
Figure 79. Percent cover of coral genera found in each region. Pascoe and Burns/UHH/Ships of
Discovery Science Team............................................................................................................. 104
Figure 80. Coral cover percent among regions. Scatter plot points represent the averages for
each plot surveyed at each region. Along with the average with standard deviation for each
region. Pascoe and Burns/UHH/Ships of Discovery Science Team. .......................................... 105
Figure 81. Average coral cover found for each plot among depth ranges and region. Region
average and standard deviation represented with large point and error bars. Pascoe and
Burns/UHH/Ships of Discovery Science Team. ......................................................................... 105
Figure 82. Average 3D surface area complexity found for each plot among depth ranges and
region. Region average and standard deviation represented with large point and error bars.
Pascoe and Burns/UHH/Ships of Discovery Science Team. ...................................................... 106
x
�Figure 83. 3D surface area complexity among regions with plotted averages per each plot. Mean
values and standard deviation is represented with the large point and variance. Pascoe and
Burns/UHH/Ships of Discovery Science Team. ......................................................................... 107
Figure 84. Diversity of coral showed a positive relationship with 3D surface area complexity.
Between regions White and Orange there was also a significant difference in 3D surface area
complexity. Pascoe and Burns/UHH/Ships of Discovery Science Team. .................................. 107
Figure 85. Coral cover showed a positive relationship with depth. As depth increased coral cover
also increased. Pascoe and Burns/UHH/Ships of Discovery Science Team. ............................. 108
Figure 86. SfM model of tractor wreck found in eight feet of water on the reef flats at Orange
beach. Pascoe and Burns/UHH/Ships of Discovery Science Team. ........................................... 110
Figure 87. Sfm model of one of the LVT wrecks located in the LVT dumpsite at Peleliu, Island.
Pascoe and Burns/UHH/Ships of Discovery Science Team. ...................................................... 111
Figure 88. Large SfM model of an LVT Dump Site located off Orange Beach, Peleliu.
Potentially there are three LVT located within this model. Pascoe and Burns/UHH/Ships of
Discovery Science Team............................................................................................................. 112
Figure 89. SfM model of remains of an LVT engine and roller assembly. Pascoe and
Burns/UHH/Ships of Discovery Science Team. ......................................................................... 113
Figure 90. SfM model of remains a pontoon barges. Pascoe and Burns/UHH/Ships of Discovery
Science Team. ............................................................................................................................. 114
Figure 91. U.S. Invasion Objectives at Peleliu. Top inset: Location of Landing Beaches in
Palauan Archipelago. Bottom inset: Location of Landing Beaches on Peleliu Island. Image by
Roth/Ships of Discovery Science Team. .................................................................................... 119
Figure 92. Reconnaissance Map of the White Beaches created by UDT 7. Burke 1944. NARA
RG-38. ......................................................................................................................................... 120
Figure 93. Smoke from the naval and aerial bombardment rises from Peleliu the morning of 15
September 1944. Photograph taken from USS Clemson. Image from Bureau of Aeronautics
Materials, 247290. ...................................................................................................................... 122
Figure 94. Japanese military beach obstacles and fields of fire from coastal defenses on the
White beaches. Although range markers were removed by UDT 7, they remain in this image to
aid reader with artillery visualization. Artillery caliber sizes and associated ranges were
calculated from 2018 site investigation and previous investigation of coastal defenses (Denfeld
1988; Price et al. 2012; Price and Knecht 2015). Map by Roth/Ships of Discovery Science Team.
..................................................................................................................................................... 123
Figure 95. Burning amphibious vehicles off White beaches 1 and 2 on September 15, 1944. The
White/Orange coral promontory is visible with smoke rising behind in center of image. Note
range markers and posts off the beach. Bureau of Aeronautics Materials, 46697...................... 125
Figure 96. The White/Orange promontory, seen on the right, caused little delay in troop
movement on White 2. By the time Davis reached the area, the majority of men were already
nearing the airfield. Frederick R. Findtner Collection, USMC Archives, 2-10. ......................... 126
Figure 97. Japanese beach obstacles and fields of fire from coastal defenses on the Orange
beaches. Artillery caliber sizes and associated ranges were calculated from 2018 site
investigation and previous investigation of coastal defenses (Denfeld 1988; Price et al. 2012;
Price and Knecht 2015). Map by Roth/Ships of Discovery Science Team. ............................... 127
Figure 98. Andy Anderson, UDT 7, with a Japanese J-13 mine at Peleliu, 1944. National Navy
UDT Seal Museum, 2002.00334.12. .......................................................................................... 128
xi
�Figure 99. KOCOA terrain features on the Peleliu Landing Beaches. Map by Roth/Ships of
Discovery Science Team............................................................................................................. 132
Figure 100. Detail from 1946 map of Peleliu titled “Ngarmoked NW-D, Palau Islands.” Note
southern harbor and tent areas on the White and Orange beaches. U.S. Army Map Service, 1946.
..................................................................................................................................................... 133
Figure 101. Suggested Battlefield, Core, and Potential National Register Boundary following
2018 fieldwork. Map by Roth/Ships of Discovery Science Team.............................................. 134
xii
�List of Tables
Table 1. Side scan targets. Analysis Enright/SEARCH. .............................................................. 22
Table 2. Geodetic Parameters Used During the Current Investigation ........................................ 27
Table 3. Remote Sensing Instrument Layback (in meters) from the Center point of the Dukl
Survey Vessel................................................................................................................................ 28
Table 4. Survey Area, Number of Survey Track Lines, Total Linear Feet, and Total Line Miles
....................................................................................................................................................... 29
Table 5. Magnetic Anomalies, Location, Gamma Deviation, Duration, Type, and Description
Documented Within the Peleliu Landing Beaches Survey Area. ................................................. 36
Table 6. Clustered and Isolated Magnetic Anomalies Description and Potential Significance. .. 45
Table 7. Summary of Reef Sites................................................................................................... 47
Table 8. Summary of Lagoon Sites .............................................................................................. 67
Table 9. Summary of Terrestrial Sites Located Inshore of the Invasion Beaches ....................... 92
Table 10. Summary of Previously Recorded Japanese Defensive Positions ............................... 95
Table 11. Previously Unrecorded Japanese Defensive Positions................................................. 96
Table 12. Overview of KOCOA Attributes (after NPS 2016:5 and Babits et al. 2011) ............ 115
Table 13. Terrain Features and KOCOA Attributes Associated with Peleliu Amphibious
Invasion ....................................................................................................................................... 116
List of Acronyms and Abbreviations
ABPP
dGPS
DOI
DUKW
fsw
Km
KOCOA
LCM
LCVP
LST
LVT
m
NARA
NOAA
NPS
ONI
PAD
SfM
UCH
UDT
UID
WWII
American Battlefield Protection Program
Differential Global Positioning System
Department of the Interior
Amphibious Truck
Feet of Seawater
Kilometers
Key terrain, Observation, Cover/concealment, Observation, Avenue of
approach or withdrawal
Landing Craft, Mechanized
Landing Craft, Personnel
Landing Ship, Tank
Landing Vehicle, Tank
Meters
National Archives and Records Administration
National Oceanic and Atmospheric Administration
National Park Service
Office of Naval Intelligence
Pontoon Assembly Detachment
Structure from Motion
Underwater Cultural Heritage
Underwater Demolition Team
Unidentified
World War II
xiii
�Executive Summary
The focus of this project is the World War II (WWII) battle that began on September 12, 1944 in
the Palau Islands in the Caroline Island archipelago. The island was a strategic objective for both
the Japanese and U.S. militaries. It is the first effort to study the Peleliu WWII invasion beaches
and the offshore battlespace.
Archeological research on Peleliu has been remarkably limited given the importance and
tremendous loss of life. Prior research has focused on the terrestrial battle. No systematic remote
sensing survey of the invasion beaches, lagoon, and reef to identify underwater cultural heritage
sites (UCH) has ever been undertaken at Peleliu.
The goal was to locate the scattered material remains of Peleliu’s submerged battlefield, to
photogrammetrically record those remains, and to examine the reef substrate and its coral
communities to determine if the scars from the U.S. military blasting of the reef to create access
ramps into the lagoon were still visible after 74 years.
The science team revisited or located 100 sites that represent both WWII specific remains and
modern debris. The terrestrial survey inshore of the invasion beaches identified 60 artifact
scatters, miscellaneous debris, pieces of equipment, or Japanese defensive positions. The team
revisited 14 archaeological sites previously recorded by Denfeld (1980) and/or by Knecht, Price,
and Lindsay (2012) and identified 11 previously unrecorded sites. A brief discussion of selected
sites investigated during the project and their WWII battlefield context is included.
It is the first ever effort to undertake characterizations of coral reef structures to quantify and
model the long-term effects of WWII blasting. Biological characterization of the reefs included
high-resolution (mm-scale) 3D reconstructions from 424 reef plots. Three blast zones were
modeled in entirety to create 3D maps of these unique areas and to quantify the geomorphology
produced by these activities. Five UCH sites were modeled providing baseline information on
the condition and status of these WWII remains.
The results of the 3D surveys is available for public view at the Multi-scale Environmental
Graphical Analyses (MEGA) Lab University of Hawaiʻi at Hilo on Sketchfab at:
https://sketchfab.com/BurnsLab/collections/peleliu-project.
The side-scan sonar imaged 18 acoustic contacts that were investigated by divers; none resulted
in identification of UCH. The magnetomer survey produced 20 anomalies. Of these, 12 were
associated with project-located UCH, 7 remain unidentified, but are likely associated with singlepoint ferrous metal objects consistent with the historic Battle of Peleliu.
A KOCOA analysis of the invasion beaches and inshore area documented the effects of both
defensive and offensive actions on the battlefield. This is the first such analysis of this aspect of
the battle and these areas of the battle.
14
�Chapter 1: Introduction
Introduction
The focus of this project is the World War II (WWII) battle that began on September 12, 1944 in
the Palau Islands in the Caroline Island archipelago (Figure 1). Peleliu, located at the southern
end of the island chain, was a strategic objective for both the Japanese and U.S. militaries
(Figure 2). This project is the first effort to study the Peleliu WWII invasion beaches and the
offshore battlespace.
Figure 1. Location of Palau in the Western Caroline Islands. USMC map, n.d.
Archeological research on Peleliu has been remarkably limited given the importance and
tremendous loss of life during the battle. D. Colt Denfeld’s survey in 1981 was the first, funded
through the National Park Service (NPS) as part of the on-going Micronesian Archeological
Survey (Denfeld 1988). A long needed revisiting, reexamination, and expansion on Denfeld’s
1981 survey was completed in 2010. Funded under an NPS American Battlefield Protection
Program (ABPP) Grant, Rick Knecht, Neil Price, and Gavin Lindsay lead a team on an intensive
nine-day survey of a portion of the Peleliu terrestrial battlefield (Knecht et.al. 2012). Both of
these archeological investigations focused on the terrestrial battle.
The goal of this project was to locate the scattered material remains of Peleliu’s submerged
battlefield, to photogrammetrically record those remains, and to examine the reef substrate and
15
�its coral communities to determine if the scars from the U.S. military blasting of the reef to
create access ramps into the lagoon were still visible after 74 years.
No systematic remote sensing survey of the invasion beaches, lagoon, and reef to identify
underwater cultural heritage sites (UCH) has ever been undertaken at Peleliu. Previous periods of
shoreline reef clean-up have already altered the amount and type of WWII sites that are
preserved, which directly affects battlefield interpretation. The location and identification of all
remaining UCH sites is critical to understanding the full battlefield on land and underwater.
Figure 2. Location of Peleliu at the southern end of the island chain. Hough 1950:5, Map 2.
16
�No biological characterizations of coral reef structures have ever been undertaken to quantify
and model the long-term effects of WWII blasting in the Pacific. The health and recovery of
reefs is important for understanding the human impacts and because the date of impact is known,
it allows a baseline to model recovery and for comparison to other similarly impacted reefs in the
Pacific theater.
This project is a Phase I submerged cultural resources survey and inventory, as defined by the
Secretary of the Interior Standards, which included:
• geophysical remote sensing using a side scan sonar and magnetometer
• swimmer/diver reconnaissance in the shallow areas of the reef
• target diving on anomalies to identify submerged sites
• standard archaeological documentation for a Phase 1 survey (photographs, written
documentation of significant features, etc.)
• walking survey of the invasion beaches from the shoreline to approximately 30 meters
inland to facilitate a KOCOA analysis
• swimmer/diver examination reef to locate areas of pre-invasion destruction resulting from
explosives used to permit amphibious landings
• marine biological characterization of:
• coral reef structures and substrate encompassing the submerged sites and debris fields
• coral reef structures in the known areas of pre-invasion blasting
• control areas (not disturbed by human activity)
The swimmer/diver reconnaissance and terrestrial shoreline survey identified a number of sites.
The documentation of selected sites was not intended to be exhaustive nor definitive. The
information provided is an overview of the site with historical context, description, and
preliminary analysis and serves as a baseline inventory.
Biological characterization of the reefs included high-resolution (mm-scale) 3D reconstructions
from 424 reef plots by collecting overlapping images (70-80% overlap) from planar and oblique
angles of reef plots. The plots were located from the base of the blast zones to the top of the reef
flat at locations impacted by blasting during the invasion and locations where no blasting
occurred.
A secondary component of this project was to produce a KOCOA analysis of the maritime
battlefield. KOCOA is a widely used method in conflict archeology to model battlefield action
and troop movements. In this context, it was used to understand the activities that influenced the
invasion and the decisions and limitations imposed by the natural terrain and built environment.
These features directly influence the loss of men and materiel in the first hours of the invasion.
A NOAA Ocean Exploration Grant funded this project under agreement NA17OAR0110214.
The Department of the Interior (DOI), NPS, ABPP grant under agreement GA-2287-17-015,
augmented these funds and permitted a longer site visit and in-depth KOCOA analysis. The
results of the ABPP grant are reported in Carrell et.al. 2020.
17
�The scope of the project is limited to the Peleliu invasion beaches designated as White 1, White
2, Orange 1, Orange 2, and Orange 3, to approximately 30 m (100 ft.) inland. Seaward, it
includes the lagoon, the reef, and the immediate area just beyond the reef (Figure 3).
Figure 3. Project Area. Map by Roth/Ships of Discovery Science Team.
18
�The environmental characteristics of the invasion beaches necessitated that project area and
investigation be broken into four zones: outside the reef; the reef top and margins, the shallow
lagoon from the reef to the shore, and the area just inshore of the invasion beaches.
In each location, there were some challenges including large fluctuations in tidal range and
longshore current, sometimes helping and other times hindering the search. The heavily
overgrown shore made walking and locating Japanese defensive positions a challenge.
19
�Chapter 2: Remote Sensing
Remote Sensing Survey
Marine remote-sensing survey of the Project Area occurred from April 2-14, 2018. Jeff Enright,
from SEARCH Inc., participated in the survey from April 2-7, 2018. Equipment issues during
the first week of fieldwork delayed the start of survey and prevented data collection while the
team conducted troubleshooting of the equipment. A faulty magnetometer tow cable prohibited
the collection of any magnetic data during this period, further hampering data collection. Only
two lines of side-scan sonar imagery were acquired before a connection fault in the topside
processing unit again delayed the side scan survey. The team identified a workaround on April 7
that allowed the side-scan survey to continue after Enright departed. Despite the problems, the
remote sensing survey in April 2018, acquired side-scan sonar imagery over 5 parallel survey
lines spaced 20 meters (66 ft.) apart (Figure 4). Two lines were collected the first week, while the
remaining lines were collected during the second week. In total, the team acquired approximately
12 line-miles of imagery equating to approximately 8.5 gigabytes of data. Water depths in the
survey area varied from less than 3.0 to approximately 35 meters (9.8 and 115 ft.).
On July 18, 2019, project PI Dr. Toni Carrell and Michael Krivor, Recon Offshore, returned to
Peleliu to conduct a magnetometer survey of the offshore beaches. In total 13.66 line miles of
data were collected, equating to approximately 135 megabytes of data. Water depths in the
survey area varied from less than 3.0 to approximately 35 meters (9.8 to 115 ft.).
Side-Scan Sonar
The team reviewed each line of raw side-scan sonar imagery from the survey to locate acoustic
contacts indicative of man-made features and potential submerged cultural resources protruding
above the seafloor. Each contact was assigned a unique identifier, and descriptive information
was collected and tabulated (e.g., length, width, dGPS position, etc.).
The team also generated a mosaic image of the project area comprising all raw sonar imagery.
The ability to mosaic the imagery was made possible with embedded positional data from the
dGPS utilizing Chesapeake Technology, Inc., SonarWiz 7 sonar processing software. Highfrequency imagery files (600 kHz) were imported into the software using settings adjusted for
the EdgeTech 4125 acquisition methods.
Following importation of the raw imagery, bottom tracking was performed to identify the first
acoustic return, which determines the altitude of the towfish above the seafloor, creates a slantrange-corrected record, and removes the water column from the nadir region. Gain, color, and
contrast settings were adjusted for each file in order to produce an optimal and even image across
the entire mosaic. Returns from overlapping files were averaged. Thus, if a contact contrasts
well on one trackline, but not on an adjacent line, averaged returns from both lines ensure
significant contrast for contact detection. The mosaic was exported as a geo-rectified image
(geotiff format) with a resolution of 0.15 meter/pixel (0.5 feet/pixel).
20
�Figure 4. Side scan track plots and targets. Map by SEARCH, Inc.
Analysis
The side-scan sonar imaged 18 acoustic contacts that could represent manmade features.
Extensive coral growth complicated contact selection because it was difficult to differentiate
21
�between natural coral reef and artificial coral reef. Figure 4 illustrates the locations of the 18
contacts, while Table 1 provides images and statistics. Each of the 18 targets were investigated
by divers, but did not result in the identification of any UCH.
Table 1. Side scan targets. Analysis Enright/SEARCH.
Target Image
Target Info
User Entered Info
Dimensions and attributes
PEL.01S
● Sonar Time at Target: 4/7/2018 5:41:03 AM
● Target Width: 3.53 Meters
● Click Position
● Target Height: 2.47 Meters
6.9973262328 134.2155186254 (WGS84)
● Target Length: 4.46 Meters
(X) 413350.09 (Y) 773525.56 (Projected ● Target Shadow: 3.14 Meters
Coordinates)
● Map Projection: UTM84-53N
●
Acoustic
Source
File:
C:\SonarWizProjects\180033_Peleliu\RAW\Line2C.jsf
● Ping Number: 20916
● Range to target: 16.89 Meters
● Fish Height: 28.41 Meters
● Heading: 10.300 Degrees
● Line Name: Line2C
PEL.02S
Dimensions and attributes
● Sonar Time at Target: 4/7/2018 5:40:29 AM
● Target Width: 6.02 Meters
● Click Position
● Target Height: 4.05 Meters
6.9967020519 134.2159584606 (WGS84)
● Target Length: 6.48 Meters
(X) 413398.56 (Y) 773456.47 (Projected ● Target Shadow: 6.71 Meters
Coordinates)
● Map Projection: UTM84-53N
●
Acoustic
Source
File:
C:\SonarWizProjects\180033_Peleliu\RAW\Line2C.jsf
● Ping Number: 20422
● Range to target: 26.85 Meters
● Fish Height: 27.10 Meters
● Heading: 351.200 Degrees
● Line Name: Line2C
PEL.03S
Dimensions and attributes
● Sonar Time at Target: 4/7/2018 5:30:25 AM
● Target Width: 3.23 Meters
● Click Position
● Target Height: 3.94 Meters
6.9845471066 134.2183754430 (WGS84)
● Target Length: 5.03 Meters
(X) 413663.31 (Y) 772112.22 (Projected ● Target Shadow: 8.64 Meters
Coordinates)
● Map Projection: UTM84-53N
●
Acoustic
Source
File:
C:\SonarWizProjects\180033_Peleliu\RAW\Line2C.jsf
● Ping Number: 11820
● Range to target: 24.21 Meters
● Fish Height: 17.61 Meters
● Heading: 355.290 Degrees
● Line Name: Line2C
22
�Target Image
Target Info
PEL.04S
User Entered Info
Dimensions and attributes
● Sonar Time at Target: 4/7/2018 5:29:44 AM
● Target Width: 4.24 Meters
● Click Position
● Target Height: 3.45 Meters
6.9838638361 134.2183596934 (WGS84)
● Target Length: 4.07 Meters
(X) 413661.45 (Y) 772036.68 (Projected ● Target Shadow: 5.93 Meters
Coordinates)
● Map Projection: UTM84-53N
●
Acoustic
Source
File:
C:\SonarWizProjects\180033_Peleliu\RAW\Line2C.jsf
● Ping Number: 11229
● Range to target: 20.31 Meters
● Fish Height: 20.09 Meters
● Heading: 359.200 Degrees
● Line Name: Line2C
PEL.05S
Dimensions and attributes
● Sonar Time at Target: 4/7/2018 5:38:30 AM
● Target Width: 4.31 Meters
● Click Position
● Target Height: 4.30 Meters
6.9942130932 134.2162131942 (WGS84)
● Target Length: 8.49 Meters
(X) 413426.24 (Y) 773181.25 (Projected ● Target Shadow: 9.71 Meters
Coordinates)
● Map Projection: UTM84-53N
●
Acoustic
Source
File:
C:\SonarWizProjects\180033_Peleliu\RAW\Line2C.jsf
● Ping Number: 18733
● Range to target: 25.39 Meters
● Fish Height: 18.10 Meters
● Heading: 352.390 Degrees
● Line Name: Line2C
Dimensions and attributes
PEL.06S
● Sonar Time at Target: 4/7/2018 5:38:05 AM
● Target Width: 3.30 Meters
● Click Position
● Target Height: 2.99 Meters
6.9936499557 134.2162400040 (WGS84)
● Target Length: 7.81 Meters
(X) 413429.10 (Y) 773118.99 (Projected ● Target Shadow: 7.83 Meters
Coordinates)
● Map Projection: UTM84-53N
●
Acoustic
Source
File:
C:\SonarWizProjects\180033_Peleliu\RAW\Line2C.jsf
● Ping Number: 18372
● Range to target: 35.63 Meters
● Fish Height: 18.26 Meters
● Heading: 351.790 Degrees
● Line Name: Line2C
PEL.07S
Dimensions and attributes
● Sonar Time at Target: 4/7/2018 4:51:05 AM
● Target Width: 2.77 Meters
● Click Position
● Target Height: 1.96 Meters
6.9926160892 134.2165583332 (WGS84)
● Target Length: 7.72 Meters
(X) 413464.07 (Y) 773004.63 (Projected ● Target Shadow: 5.47 Meters
Coordinates)
● Map Projection: UTM84-53N
●
Acoustic
Source
File:
C:\SonarWizProjects\180033_Peleliu\RAW\Line3B.jsf
● Ping Number: 168215
● Range to target: 35.81 Meters
● Fish Height: 16.06 Meters
● Heading: 349.100 Degrees
● Line Name: Line3B
23
�Target Image
Target Info
PEL.08S
User Entered Info
Dimensions and attributes
● Sonar Time at Target: 4/7/2018 4:44:02 AM
● Target Width: 4.00 Meters
● Click Position
● Target Height: 1.43 Meters
6.9856733150 134.2185612594 (WGS84)
● Target Length: 10.57 Meters
(X) 413684.04 (Y) 772236.69 (Projected ● Target Shadow: 3.65 Meters
Coordinates)
● Map Projection: UTM84-53N
●
Acoustic
Source
File:
C:\SonarWizProjects\180033_Peleliu\RAW\Line3B.jsf
● Ping Number: 162182
● Range to target: 27.11 Meters
● Fish Height: 13.23 Meters
● Heading: 355.890 Degrees
● Line Name: Line3B
Dimensions and attributes
PEL.09S
● Sonar Time at Target: 4/7/2018 4:41:25 AM
● Target Width: 1.38 Meters
● Click Position
● Target Height: 2.16 Meters
6.9835285270 134.2179897008 (WGS84)
● Target Length: 3.64 Meters
(X) 413620.51 (Y) 771999.68 (Projected ● Target Shadow: 5.15 Meters
Coordinates)
● Map Projection: UTM84-53N
●
Acoustic
Source
File:
C:\SonarWizProjects\180033_Peleliu\RAW\Line3B.jsf
● Ping Number: 159945
● Range to target: 35.07 Meters
● Fish Height: 18.89 Meters
● Heading: 352.790 Degrees
● Line Name: Line3B
Dimensions and attributes
PEL.10S
● Sonar Time at Target: 4/7/2018 4:00:43 AM
● Target Width: 7.16 Meters
● Click Position
● Target Height: 5.29 Meters
6.9932817639 134.2170231984 (WGS84)
● Target Length: 9.96 Meters
(X) 413515.54 (Y) 773078.14 (Projected ● Target Shadow: 8.63 Meters
Coordinates)
● Map Projection: UTM84-53N
●
Acoustic
Source
File:
C:\SonarWizProjects\180033_Peleliu\RAW\Line4B.jsf
● Ping Number: 140396
● Range to target: 0.00 Meters
● Fish Height: 13.24 Meters
● Heading: 354.700 Degrees
● Line Name: Line4B
Dimensions and attributes
PEL.11S
● Sonar Time at Target: 4/7/2018 3:59:13 AM
● Target Width: 3.70 Meters
● Click Position
● Target Height: 4.03 Meters
6.9914828448 134.2170735746 (WGS84)
● Target Length: 5.29 Meters
(X) 413520.78 (Y) 772879.25 (Projected ● Target Shadow: 11.78 Meters
Coordinates)
● Map Projection: UTM84-53N
●
Acoustic
Source
File:
C:\SonarWizProjects\180033_Peleliu\RAW\Line4B.jsf
● Ping Number: 139117
● Range to target: 29.19 Meters
● Fish Height: 15.32 Meters
● Heading: 347.100 Degrees
● Line Name: Line4B
24
�Target Image
Target Info
PEL.12S
User Entered Info
Dimensions and attributes
● Sonar Time at Target: 4/7/2018 3:48:34 AM
● Target Width: 7.47 Meters
● Click Position
● Target Height: 2.38 Meters
6.9815259259 134.2191816676 (WGS84)
● Target Length: 16.02 Meters
(X) 413751.82 (Y) 771778.06 (Projected ● Target Shadow: 4.58 Meters
Coordinates)
● Map Projection: UTM84-53N
●
Acoustic
Source
File:
C:\SonarWizProjects\180033_Peleliu\RAW\Line4B.jsf
● Ping Number: 130012
● Range to target: 27.34 Meters
● Fish Height: 19.99 Meters
● Heading: 341.890 Degrees
● Line Name: Line4B
PEL.13S
Dimensions and attributes
● Sonar Time at Target: 4/7/2018 3:29:16 AM
● Target Width: 6.00 Meters
● Click Position
● Target Height: 3.25 Meters
6.9959117733 134.2163312995 (WGS84)
● Target Length: 7.19 Meters
(X) 413439.60 (Y) 773369.03 (Projected ● Target Shadow: 5.75 Meters
Coordinates)
● Map Projection: UTM84-53N
●
Acoustic
Source
File:
C:\SonarWizProjects\180033_Peleliu\RAW\Line5B.jsf
● Ping Number: 105093
● Range to target: 13.18 Meters
● Fish Height: 14.17 Meters
● Heading: 159.100 Degrees
● Line Name: Line5B
PEL.14S
Dimensions and attributes
● Sonar Time at Target: 4/4/2018 3:05:54 AM
● Target Width: 0.92 Meters
● Click Position
● Target Height: 2.08 Meters
6.9831860832 134.2188245615 (WGS84)
● Target Length: 4.46 Meters
(X) 413712.67 (Y) 771961.66 (Projected ● Target Shadow: 4.24 Meters
Coordinates)
● Map Projection: UTM84-53N
●
Acoustic
Source
File:
C:\SonarWizProjects\180033_Peleliu\RAW\Line6.jsf
● Ping Number: 29896
● Range to target: 8.44 Meters
● Fish Height: 7.68 Meters
● Heading: 1.290 Degrees
● Line Name: Line6
PEL.15S
Dimensions and attributes
● Sonar Time at Target: 4/4/2018 3:02:41 AM
● Target Width: 1.36 Meters
● Click Position
● Target Height: 1.00 Meters
6.9798845991 134.2204804323 (WGS84)
● Target Length: 2.21 Meters
(X) 413894.99 (Y) 771596.36 (Projected ● Target Shadow: 2.74 Meters
Coordinates)
● Map Projection: UTM84-53N
●
Acoustic
Source
File:
C:\SonarWizProjects\180033_Peleliu\RAW\Line6.jsf
● Ping Number: 25243
● Range to target: 4.39 Meters
● Fish Height: 2.94 Meters
● Heading: 326.890 Degrees
● Line Name: Line6
25
�Target Image
Target Info
User Entered Info
Dimensions and attributes
PEL.16S
● Sonar Time at Target: 4/4/2018 3:27:53 AM
● Target Width: 1.73 Meters
● Click Position
● Target Height: 0.00 Meters
7.0094565159 134.2183009909 (WGS84)
● Target Length: 12.21 Meters
(X) 413659.66 (Y) 774866.13 (Projected ● Target Shadow: 0.00 Meters
Coordinates)
● Map Projection: UTM84-53N
●
Acoustic
Source
File:
C:\SonarWizProjects\180033_Peleliu\RAW\Line6.001.jsf
● Ping Number: 61661
● Range to target: 15.70 Meters
● Fish Height: 8.42 Meters
● Heading: 331.700 Degrees
● Line Name: Line6.001
PEL.17S
Dimensions and attributes
● Sonar Time at Target: 4/7/2018 3:06:39 AM
● Target Width: 1.46 Meters
● Click Position
● Target Height: 0.00 Meters
7.0003838994 134.2169456136 (WGS84)
● Target Length: 9.58 Meters
(X) 413508.28 (Y) 773863.34 (Projected ● Target Shadow: 0.00 Meters
Coordinates)
● Map Projection: UTM84-53N
●
Acoustic
Source
File:
C:\SonarWizProjects\180033_Peleliu\RAW\Line6B.jsf
● Ping Number: 72405
● Range to target: 15.70 Meters
● Fish Height: 7.11 Meters
● Heading: 14.600 Degrees
● Line Name: Line6B
PEL.18S
Dimensions and attributes
● Sonar Time at Target: 4/7/2018 2:54:38 AM
● Target Width: 0.00 Meters
● Click Position
● Target Height: 0.00 Meters
6.9885250415 134.2182629249 (WGS84)
● Target Length: 17.59 Meters
(X) 413651.61 (Y) 772552.02 (Projected ● Target Shadow: 0.00 Meters
Coordinates)
● Map Projection: UTM84-53N
●
Acoustic
Source
File:
C:\SonarWizProjects\180033_Peleliu\RAW\Line6B.jsf
● Ping Number: 55045
● Range to target: 9.55 Meters
● Fish Height: 4.51 Meters
● Heading: 346.890 Degrees
● Line Name: Line6B
Magnetometer Survey
The magnetometer survey of the Peleliu Landing Beaches was undertaken on July 18, 2019. The
following methods were used to document all magnetic anomalies within the project area.
Methodology and Equipment
All remote sensing survey data for the magnetometer survey was collected in the following
geodetic parameters (Table 2).
26
�Table 2. Geodetic Parameters Used During the Current Investigation
Predefined Grid
UTM North
Ellipsoid
WGS84
Zone
Zone 53 (132E-138E)
Distance Unit
Meter
An historic map (Palau Islands “Peleliu I. and Angaur I.”; U.S.S. Hydrographer Survey Nov.
1944 – January 1945) was used as a background file for pre-planning the survey area,
placement/orientation of survey area track lines, and navigation during the remote sensing survey
(Figure 5).
Figure 5. Historic map used for pre-planning and survey during the current investigation (Palau
Islands “Peleliu I. and Angaur I.”; from U.S.S. Hydrographer Survey November 1944 – January
1945).
27
�One of the more important aspects of any remote sensing survey includes the accuracy of the
remote sensing data and survey instrument layback. Layback includes the X, Y, and Z distance
(in meters) from each of the remote sensing instruments tow point(s) relative to the “zero
(center) point” on the survey vessel. The layback was physically measured, entered into the
survey software prior to initiating activity, and corroborated at the end of the survey during data
processing (Table 3). The magnetometer, towed 15 meters behind the survey vessel, used a
towfish device driver (towfish.dll) in Hypack™. This uses cable out (15 meters) and a catenary
factor to accurately determine the position of the towfish during the survey.
Table 3. Remote Sensing Instrument Layback (in meters) from the Center point of the Dukl
Survey Vessel.
Instrument
GPS
Magnetometer
X (Starboard)
-1.00
Y (Aft)
-3.00
Z (Vertical)
3.60
-2.0
-5.50
1.00
Six (n=6) parallel track lines were plotted to accurately survey the western shoreline of Peleliu.
Transect interval was 20 meters (66 ft.) and the survey vessel speed did not to exceed 5 knots.
Parallel survey track lines were oriented based on the geography (primarily the extant reef line)
running parallel to the shoreline of Peleliu.
Figure 6. Six planned track lines (in blue), spaced at 20 meters, were plotted to conduct the
magnetometer survey along the west coast of Peleliu (Palau Islands “Peleliu I. and Angaur I.”;
from U.S.S. Hydrographer Survey November 1944 – January 1945). Krivor/Recon Offshore.
Table 4 provides the total number of survey track lines, total linear feet, and total line miles of
the survey area.
28
�Table 4. Survey Area, Number of Survey Track Lines, Total Linear Feet, and Total Line Miles
Survey Area
Mag Survey Areas
Number of Survey
Track Lines
6
Total Linear Feet
Total Line Miles
72,128
13.66
Nearshore conditions were ideal during the remote sensing survey (Figure 7). Winds, primarily
out of the northeast, fluctuated from calm (Beaufort Wind Scale 0) in the morning to a light
breeze (Beaufort Wind Scale 2) during the afternoon (https://www.weather.gov/mfl/beaufort).
Figure 7. Nearshore conditions were ideal for the magnetometer survey. View to southeast along
exposed reef line and landing beaches, Peleliu. Carrell/Ships of Discovery Science Team.
The equipment used included Hypack® Navigation Software (integrated with a Trimble® DSM232 dGPS (Figure 8) and Geometrics G-882 magnetometer (Figure 9). A Cat INV2000 generator
was used to provide clean power to the instruments (Figure 10).
29
�Figure 8. Panasonic Toughbook survey laptop outfitted with Hypack® Navigation Software and
Trimble® DSM-232 dGPS (yellow box). Carrell/Ships of Discovery Science Team.
.
Figure 9. Geometrics G-882 magnetometer. Carrell/Ships of Discovery Science Team.
30
�Figure 10. A CAT INV2000 inverter generator provided power during the magnetometer survey.
Carrell/Ships of Discovery Science Team.
The survey vessel, provided by Surangel and Sons of Palau, had ample room to conduct the
magnetometer survey along the west coast of Peleliu (Figure 11). Named the Motor Vessel
(M/V) Dukl, the crew mobilized the vessel in Malakal Harbor, Palau and then transited south to
Peleliu for the magnetometer survey.
Data Security and Preservation
Vessel navigation and positioning data, along with field data files from the magnetometer were
saved to a computer file and backed up on an external hard drive. All data collected during field
operations (navigation, positioning, and ancillary data) were duplicated and stored on two hard
drives, typically a primary laptop and an external hard drive. This storage occurs as soon as
possible after collection but within the same day, depending on the field deployment. While on
site, backup media are stored separately from the field computer.
Data Analysis
Following completion of the fieldwork, the analysis of the field data sets was accomplished to
identify, characterize, and evaluate the magnetic anomalies for potential historical significance
and correlate the findings with the previous remote sensing operations and diver investigations.
31
�Figure 11. Prepping for the magnetometer survey aboard the M/V Dukl out of Koror, Palau.
Carrell/Ships of Discovery Science Team.
Figure 12. The exposed reef and shallow water prevented two track lines from being completed.
View east toward exposed reef line; Peleliu in the background. Carrell/Ships of Discovery
Science Team.
32
�Navigation Post Plot
All track lines were successfully surveyed during the current investigation (except for two track
lines (1 and 2) that were too shallow to survey due to the exposed reef (Figure 12).
Magnetometer Data Analysis
After completion of the remote sensing survey the magnetometer data was processed, edited, and
contoured in Hypack™. Processing the RAW magnetometer data involves a careful review of
each track line including a profile view of the data, which identifies magnetic anomalies along a
given track line (Figure 13). Errant data (commonly referred to as “spikes”) are also visible and
deleted from the RAW data. Spikes are typically one-second points that are easily discernable
and removed when reviewing the data. Actual magnetic anomalies tend to be longer in duration
and have either monopole, dipole, or multi-component characteristics. Magnetometer layback
(15 meters) is automatically accounted for in Hypack™ during the processing of RAW data.
Figure 13. Typical single beam window showing data spreadsheet (time stamp, X/Y location,
and gamma reading), survey window (showing survey vessel track line), and profile window
(showing magnetic anomalies along a given track line). Krivor/Recon Offshore.
Once all individual track lines of data are edited, a .LOG file is assembled for each survey area
that includes all corresponding track lines, associated magnetic data, and X/Y positioning.
Individual magnetic targets are then pinpointed and evaluated for location (X/Y), type
(monopole, dipole, multi-component), deviation, and duration. A target (.TGT file) is
subsequently created for each target within the survey area.
After documentation, a magnetic contour map (TIN Model) is produced. This entails identifying
the minimum and maximum gamma values within each area, allowing for the production of an
33
�accurate contour map. Using Hypack™ the operator chooses the contour interval for the
prescribed area; for this project all magnetic data was contoured at 5-gamma intervals.
Additional attributes can then be chosen such as contour colors, line width, TIN Max Side,
Export type (.DXF, .XYZ, .KMZ), and contour type (2D, 3D).
Once a magnetic contour map is produced it can then be downloaded as a Background File in
Hypack™, overlaid on a NOAA Raster Chart or aerial photograph, and correlated with other
data such as .TGT files and/or side-scan sonar overlays.
Magnetometer Results
In July 2019, SHIPS completed the marine magnetometer survey of the Peleliu Landing
Beaches. The results of the magnetometer survey identified twenty anomalies (N=20) within the
survey area (Figures 13-16). Table 5 provides the Name, Location (Easting and Northing),
Gamma Deviation, Duration (in meters), Type (M=Monopole, D=Dipole, MC= MultiComponent) and Description, of each magnetic anomaly.
Figure 14. Magnetic Contour Map 1 of the Peleliu Landing Beach; contour interval equals 5
gammas (Palau Islands “Peleliu I. and Angaur I.”; from U.S.S. Hydrographer Survey November
1944 – January 1945). Krivor/Recon Offshore.
34
�Figure 15. Magnetic Contour Map 2 of the Peleliu Landing Beach; contour interval equals 5
gammas (Palau Islands “Peleliu I. and Angaur I.”; from U.S.S. Hydrographer Survey November
1944 – January 1945). Krivor/Recon Offshore.
Figure 16. Magnetic Contour Map 3 of the Peleliu Landing Beach; contour interval equals 5
gammas (Palau Islands “Peleliu I. and Angaur I.”; from U.S.S. Hydrographer Survey November
1944 – January 1945). Krivor/Recon Offshore.
35
�Figure 17. Magnetic Contour Map 4 of the Peleliu Landing Beach; contour interval equals 5
gammas (Palau Islands “Peleliu I. and Angaur I.”; from U.S.S. Hydrographer Survey November
1944 – January 1945). Krivor/Recon Offshore.
Table 5. Magnetic Anomalies, Location, Gamma Deviation, Duration, Type, and Description
Documented Within the Peleliu Landing Beaches Survey Area.
Peleliu
M1
M2
Easting
413486.12
413584.61
Northing
773232.64
772665.24
Gamma
Deviation
-56
-7
Duration
(in meters)
56
27
M3
413651.03
772036.87
-20
66
M
M4
M5
413654.86
413467.81
771990.00
773801.88
-5
-2
39
18
M
M
Description
Associated with M8
Associated with M11
Associated with M4, M14, M19. Near
entrance to ferry dock.
Associated with M3, M14, M19. Near
entrance to ferry dock.
Isolated
M6
M7
M8
M9
M10
M11
413442.72
413470.14
413476.09
413495.75
413547.96
413555.19
773678.10
773264.95
773231.13
773109.26
772792.65
772662.77
+.5/-.3
-2
-5
+3/-7
-3
-3
21
18
36
63
38
33
D
M
M
D
M
M
Isolated
Isolated
Associated with M1
Isolated
Isolated
Associated with M2
M12
M13
413600.47
413620.90
772390.41
772159.83
+1/-11
-15
45
47
D
M
M14
413628.76
772003.55
+1/-8
99
MC
Associated with M16
Associated with M18
Associated with M3, M4, M19. Near
entrance to ferry dock.
M15
413516.96
772877.83
-1
25
M
Isolated
36
Type
M
M
�Peleliu
M16
M17
M18
Easting
413581.09
413590.81
413597.79
Northing
772380.47
772236.18
772156.66
Gamma
Deviation
-3
-2
-10
Duration
(in meters)
50
52
52
M19
413610.59
771998.84
+1/-3
111
M20
413609.04
771912.17
+2
48
(Type M=Monopole, D=Dipole, MC=Multi-Component).
Type
M
M
M
MC
M
Description
Associated with M12
Isolated
Associated with M13
Associated with M3, M4, M14. Near
entrance to ferry dock.
Isolated
Analysis of the magnetic anomalies indicated the majority are low gamma (˃10 gammas), short
duration, monopole anomalies indicative of small, single-point ferrous metal objects. These types
of anomalies are consistent with the historic use of the area as multiple Landing Beaches
associated with the Battle of Peleliu. A number of larger magnetic anomalies (˂10 gammas)
were also recorded that have associated magnetic anomalies meaning they were recorded over
more than one track line. These anomalies are likely larger ferrous metal objects.
Correlation of Clustered Magnetic Anomalies
All clustered magnetic anomalies consisting of more than one magnetic anomaly located on
adjacent track lines were correlated with findings from the previous side-scan sonar survey and
diver investigations and are presented below. Target locations from the previous investigations
were imported into Hypack™ and compared to the magnetometer target locations.
Targets M1 and M8
Targets M1 and M8 comprise one ferrous metal target located near the reef line and is one of the
larger anomalies documented during the magnetometer survey (Figure 18).
Figure 18.Magnetic contour map of Targets M1 and M8]; Contour interval equals 5 gammas
(Palau Islands “Peleliu I. and Angaur I.”; from U.S.S. Hydrographer Survey November 1944 –
January 1945). Krivor/Recon Offshore.
37
�Plotting targets from the side-scan sonar survey and diver investigations indicate two targets are
in the general location of Targets M1 and M8 (Figure 19). Review of the previous investigation
indicate both Targets P.05 and P.11 are “Survey points identified during Sonar Anomaly. No
cultural material located.” Therefore, side-scan sonar targets were plotted in the area, but nothing
was confirmed during diver investigations. Targets M1 and M8 remain unidentified.
Figure 19. Magnetic contour map of Targets M1 and M8 with previously documented targets
(P.05 and P.11) plotted; Contour interval equals 5 gammas (Palau Islands “Peleliu I. and Angaur
I.”; from U.S.S. Hydrographer Survey November 1944 – January 1945). Krivor/Recon Offshore.
Targets M2 and M11
Targets M2 and M11 represent another single ferrous metal anomaly documented on more than
one survey track line. Plotting the location of previously recorded anomalies indicates Targets
M2 and M11 are associated with Targets Ships025 and Ships035 (Figure 20).
38
�Figure 20. Magnetic contour map of Targets M2 and M11 with previously documented targets
(Ships025 and Ships035) plotted; Contour interval equals 5 gammas (Palau Islands “Peleliu I.
and Angaur I.”; from U.S.S. Hydrographer Survey November 1944 – January 1945).
Krivor/Recon Offshore.
Review of the previously documented targets indicate Ships025 and Ships035 was identified as a
“Large stud link anchor chain which runs from the reef crest to edge.” In addition, an
unidentified (UID) site was documented in the area. Results of the magnetometer survey would
indicate Targets M2 and M11 represent the same stud-link anchor chain that continues to extend
offshore from the reef line.
Targets M3, M4, M14, and M19
Magnetic Targets M3, M4, M14, and M19 represent a large cluster of magnetic anomalies
located near the mouth of the manmade jetty located at the southern end of the project area and
Landing Beaches (Figure 21).
39
�Figure 21. Magnetic Targets M3, M4, M14, and M19 are located near the entrance to the
manmade jetty near the south end of the project area; Contour interval equals 5 gammas (Palau
Islands “Peleliu I. and Angaur I.”; from U.S.S. Hydrographer Survey November 1944 – January
1945). Krivor/Recon Offshore.
Plotting the target locations from the previous investigations indicate the cluster of magnetic
anomalies are associated with Targets Ships023 identified as a “Pontoon Barge and Pontoon
Barge Fragments” (Figure 22).
40
�Figure 22. Magnetic Targets M3, M4, M14, and M19 and Targets Ships023 represent the
remains of a Pontoon Barge and Pontoon Fragments; Contour interval equals 5 gammas (Palau
Islands “Peleliu I. and Angaur I.”; from U.S.S. Hydrographer Survey November 1944 – January
1945). Krivor/Recon Offshore.
Targets M12 and M16
Targets M12 and M16 represent a single magnetic anomaly documented on two adjacent track
lines (Figure 23).
Figure 23. Magnetic Targets M12 and M16; Contour interval equals 5 gammas (Palau Islands
“Peleliu I. and Angaur I.”; from U.S.S. Hydrographer Survey November 1944 – January 1945).
Krivor/Recon Offshore.
41
�Plotting the location of previously documented targets near Targets M12 and M16 indicate the
anomalies are likely associated with Targets Ships030 identified as a “Pipe at Orange 3 and
Dock” as well as a “Stockless Navy Anchor, associated with a continuation of debris scatter”
(Figure 24). Target Ships024, located inshore of the magnetic anomalies, were documented as an
“Aircraft Propeller Blade”.
Figure 24. Magnetic Targets M12 and M16 and previously documented targets located nearby;
Contour interval equals 5 gammas (Palau Islands “Peleliu I. and Angaur I.”; from U.S.S.
Hydrographer Survey November 1944 – January 1945). Krivor/Recon Offshore.
Targets M13 and M18
Targets M13 and M18 represent one magnetic target located immediately north of the manmade
jetty located near the southern end of the Landing Beaches (Figure 25).
42
�Figure 25. Magnetic Targets M13 and M18; Contour interval equals 5 gammas (Palau Islands
“Peleliu I. and Angaur I.”; from U.S.S. Hydrographer Survey November 1944 – January 1945).
Krivor/Recon Offshore.
Review of the previously documented targets indicates that Magnetic Targets M13 and M18 are
associated with Targets Ships038 (Figure 26) identified as an “LVT identified in previous survey
by Bent Prop”. This is also associated with the LVT dumpsite.
Figure 26. Magnetic Targets M13 and M18 are associated with Target Ships038 identified as an
LVT; Contour interval equals 5 gammas (Palau Islands “Peleliu I. and Angaur I.”; from U.S.S.
Hydrographer Survey November 1944 – January 1945). Krivor/Recon Offshore.
43
�Correlation of Isolated Magnetic Anomalies
All isolated magnetic anomalies consisting of a single magnetic anomaly were also correlated
with findings from the previous side-scan sonar survey and diver investigations. Target locations
from the previous investigations were imported into Hypack™ and compared to the
magnetometer target locations.
Target M10
Target M10 is a single, isolated 3-gamma magnetic anomaly documented on one track line
(Figure 27).
Figure 27. Magnetic Target M10; Contour interval equals 5 gammas (Palau Islands “Peleliu I.
and Angaur I.”; from U.S.S. Hydrographer Survey Nov. 1944 – January 1945). Krivor/Recon
Offshore.
Review of the previously documented targets indicate Target M10 is associated with Targets
P.03 (large cable), Ships034 (steel cable), and Ships020 (Unexploded Ordnance) (Figure 28).
44
�Figure 28.Magnetic Target M10 and previously documented anomalies in the area; Contour
interval equals 5 gammas (Palau Islands “Peleliu I. and Angaur I.”; from U.S.S. Hydrographer
Survey November 1944 – January 1945). Krivor/Recon Offshore.
All remaining isolated magnetic anomalies (M5-M9, M15, M17, and M20) do not have any
correlating targets and remain unidentified.
Table 6 provides the results of the magnetometer survey including description of anomalies that
were successfully correlated with targets documented during the previous side-scan sonar survey
and diver investigations.
Table 6. Clustered and Isolated Magnetic Anomalies Description and Potential Significance.
Clustered
Anomalies
Easting
Northing
Gamma
Deviation
Duration
(in meters)
Type
413486.12
413476.09
413584.61
413555.19
413651.03
413654.86
773232.64
773231.13
772665.24
772662.77
772036.87
771990.00
-56
-5
-7
-3
-20
-5
56
36
27
33
66
39
M
M
M
M
M
M
M12/M16
413628.76
413610.59
413600.47
772003.55
771998.84
772390.41
+1/-8
+1/-3
+1/-11
99
111
45
MC
MC
D
M13/M18
413581.09
413620.90
772380.47
772159.83
-3
-15
50
47
M
M
413597.79
772156.66
-10
52
M
M1/M8
M2/M11
M3/M4/M14/M19
45
Description
Unidentified
Stud Link
Anchor Chain
Pontoon Barge
and Pontoon
Barge
Fragments
Pipe and
Stockless Navy
Anchor
LVT previously
identified by
Bent Prop
Potentially
Significant
Unknown
Yes
Yes
Yes
Yes
�Clustered
Anomalies
Isolated
Anomalies
M5
Easting
Northing
Duration
(in meters)
Type
Northing
773801.88
Gamma
Deviation
Gamma
Deviation
-2
Easting
413467.81
M6
M7
M9
M10
M15
M17
M20
M
Description
Unidentified
Potentially
Significant
Potentially
Significant
Unknown
Duration
Type
18
413442.72
413470.14
413495.75
413547.96
413516.96
413590.81
773678.10
773264.95
773109.26
772792.65
772877.83
772236.18
+.5/-.3
-2
+3/-7
-3
-1
-2
21
18
63
38
25
52
D
M
D
M
M
M
Unidentified
Unidentified
Unidentified
Steel Cable
Unidentified
Unidentified
Unknown
Unknown
Unknown
No
Unknown
Unknown
413609.04
771912.17
+2
48
M
Unidentified
Unknown
Description
Summary
Of the 20 anomalies identified, 12 were associated with UCH and 1 is modern, and all were
located during the field investigation, representing clearly discernable remains. The seven
unidentified isolated anomalies are off the Orange Beaches, which saw some of the heaviest
defensive fire during the invasion. The defensive fire was so intense that the units tasked with
landing on Orange 3 were forced to divert north and land closer to Orange 2. The nature of these
low gamma anomalies suggests small single-point ferrous metal objects. These types of
anomalies are consistent with the historic use of the area as multiple landing beaches associated
with the Battle of Peleliu.
46
�Chapter 3: Identification of Underwater Cultural Heritage Sites
Because the reef is shallow with limited boat and remote sensing equipment access, the search
for UCH included a towed swimmer survey of the reef margins and seaward reef flat. A walking
survey of the shallow lagoon from the mean low water line to the reef completed the inspection.
Reef Towed Swimmer Survey
The towed swimmer survey on April 8 consisted of four of overlapping lines spaced
approximately 20 meters (66 ft.) apart covering approximately 9-1/2 line miles. Water visibility
was in excess of 60 ft., making visual inspection possible. Because the survey occurred during
high tide, the two-person teams were able to get very close to the reef resulting in the location of
12 sites. A Garmin GPSMAP 64st was use to record survey tracks and site locations.
Both historic and modern debris sites were recorded during this survey (Table 7). Selected sites
discussed below represent remains only associated with the WWII invasion of Peleliu.
Table 7. Summary of Reef Sites
Site
Number
Ships020
Ships021
Ships022
Ships023
Ships024
Denfeld
Site ID
N/A
N/A
N/A
N/A
N/A
Price/Knecht
Site ID
N/A
N/A
N/A
N/A
N/A
Description and Designation Historic/Modern
UXO, HIST
Navy Stockless Anchor, HIST
Anchor, MOD
Pontoon Barge Fragments, HIST
American Aircraft Propeller Blade, HIST
This blade may be associated with aircraft remains
found in the lagoon, discussed elsewhere in this report.
Ships025
Ships026
Ships027
Ships028
Ships029
N/A
N/A
N/A
N/A
N/A
N/A
N/A
N/A
N/A
N/A
Stud Link Anchor Chain, HIST
Metal Scatter w/3” cable, MOD
Tractor with blade, HIST
Navy Stockless Anchor, HIST
Danforth Anchor, MOD
47
�Ships030
Ships031
Ships032
Ships033
Ships034
Ships035
Ships036
Ships037
Ships038
Ships039
Ships040
N/A
N/A
N/A
N/A
N/A
N/A
N/A
N/A
N/A
N/A
N/A
N/A
N/A
N/A
N/A
N/A
N/A
N/A
N/A
N/A
N/A
N/A
Debris Scatter (poss. Pontoons) and Stockless Navy Anchor,
HIST
Concrete Mooring Block, MOD
LVT, disarticulated HIST
Iron Rod/Beam, MOD
Steel Cable, MOD
Stud Link Anchor Chain, HIST
LCM, HIST
Anchor, MOD
LVT, HIST
LVT, HIST
LVT, HIST
Tractor with Blade
The reasonably intact remains of a tractor with blade (Ships027) sits in about 10 ft. of water off
Orange 2 Beach.
Historic Context
During WWII, tractors were used by the U.S. military for combat construction in Europe, Asia,
and the Pacific theaters. The tractors had unsurpassed capability to move and tow in the muddy
jungles of the Pacific islands, which made them especially valued by Seabee, Marine Corps, and
Army units. When equipped with a bulldozer blade, they could level ground for roads and
airfields, clear debris, construct fortifications, and more.
Tractors were produced in a great variety, from small, air transportable units that flew with
airborne engineers to those used to move the heaviest field artillery under adverse conditions.
According to TM 9-2800 (U.S. War Department 1943) War Department tractors were
standardized under three general classifications, with several commercially available models in
each group. While other tractors were used by the military during WWII, the most common were
the following standardized units:
Tractor, Light
o Caterpillar Tractor Co. Model D4 (G-151)
o International Harvester Model TD9 (G-99)
• Tractor, Medium, M1
o Allis-Chalmers Co. Model HD7W (G-125)
o Caterpillar Tractor Co. Model D6 (G-69)
o Cleveland Tractor Co.
o International Harvester Co. Model TD14 (G-132)
• Tractor, Heavy, M1
o Allis-Chalmers Co. Model HD10W (G-98)
o Caterpillar Tractor Co. Model D7 (G-126)
o International Harvester Co. Model TD18 (G-101)
•
48
�During the war, the D4 was one of the tractors collectively known as “Tractor, Light.” The
Caterpillar D4 models, Ordnance G-151 (US War Department 1943), was used to move light
artillery, for general duty as a tractor, or as a bulldozer when equipped with a suitable blade
attachment (D-4 Caterpillar https://olive-drab.com/idphoto/id_photos_d4cat.php).
The evolution of the D4 included these models:
• D4 4G series 1937-1938, Orchard model
• D4 7J series 1939-1942
• D4 2T series 1943-1945
• D4 5T series 1945-1947
• D4 6U series 1947-1959, 44 inch gauge
• D4 7U series 1947-1959, 60 inch gauge
The diesel powered Caterpillar D4 (Figure 29) evolved from the Cat R4 gasoline tractor. In
1936, the Cat R4 was joined by the diesel RD4 (4G series) and in 1937 the RD4, with some
minor modifications, was renamed the D4 (4G series). The early D4 models (4G, 7J, 2T, 5T)
were powered by the Cat D4400 engine with 35 drawbar horsepower. A small gasoline pony
motor was used to start the diesel. The 6U and 7U were upgraded to the Cat D315 4 cylinder
diesel with 43 drawbar horsepower. Tractor serial numbers were composed of the series (e.g. 4G,
6J) followed by a four or five digit serial number (D-4 Caterpillar https://olivedrab.com/idphoto/id_photos_d4cat.php).
Figure 29. Caterpillar D4 Tractor, Type 2T. U.S. Army, War Department, Figure 2, 1943.
49
�Analysis
Immediately following the Peleliu invasion, the Seabees used tractors to clear the beaches of
debris, disabled LVTs, and upended DUKWs before setting to work on rebuilding the airfield
(Figure 30). This tractor appears to be a Caterpillar D-4 Type 2T fitted with a bulldozer blade.
Based on the tractor’s location in a small bomb crater, it may have foundered while working to
clear debris in the lagoon and, unable to drive itself out, was abandoned in place (Figure 31.)
Figure 30. Tractors on the Peleliu shoreline after the successful capture of the southern beaches.
Norm Hatch Collection, National Museum of the Pacific War, image Peleliu 031, 1944.
Figure 31. Nearly intact tractor with blade off Orange beach (Ships027). View is from the right
rear. McKinnon/Ships of Discovery Science Team.
50
�Navy Stockless Anchors
Three navy stockless anchors were found at the edge of the Peleliu reef shelf. One was
positioned south of the harbor entrance and designated Ships021, another off Orange beach
designated Ships030, and a third off White Beach designated Ships028.
Historic Context
Navy stockless anchors, or “patent anchors” as they were known during WWII, began to replace
Admiralty, or “old fashioned” anchors in the United States Navy around 1875 (Figure 32 and
Figure 33). Admiralty anchors had fixed flukes and stocks. The stocks were set at 90 degrees
from the direction of the flukes. During the war, Admiralty anchors were only used on some
older destroyers. Admiralty anchors were stowed on horizontal platforms near the bow.
Deploying and recovering them presented some challenges because as they had to be brought
completely over the side of a vessel during either process (U.S. Naval Institute, 1940:442-445).
Stockless anchors had no stock and flukes that could swing from 40 to 45 degrees. The lack of a
stock allowed the anchor to be brought up into a hawse pipe rather than completely onboard a
vessel – so deployment and recovery of these anchors was less complicated than that of
Admiralty anchors (U.S. Naval Institute, 1940:445).
Figure 32. Admiralty anchor. The Mariners’ Museum and Park.
51
�Figure 33. Stockless anchor. The Mariners’ Museum and Park.
Analysis
Crane barges were positioned at the reef’s edge during the invasion. Two barges were situated
off Orange Beach 3, and a third was located off the right flank of Orange Beach. Initially, these
barges were moored to buoys. However, the buoys proved to be too light, and the barges were set
with anchors. On September 16, 1944 one crane lost its anchor during the process of anchoring,
and thereafter had to moor alongside craft to unload (Wright 1944:7-8). Crane barges at Peleliu
were equipped with two 200lbs navy stockless anchors (Bureau of Yards and Docks 1942:49,
51).
Ships030 was found off Orange Beach 3 (Figure 34) and Ships021 (Figure 35) was found in the
vicinity of the “right flank of Orange Beach” in 40 ft. of water. No other related artifacts were
located in the area. The potential exists that either Ships030, or Ships021, is the anchor lost from
the crane barge. Ships028 (Figure 36) was located off White Beach in approximately 6 ft. of
water. It is not associated with any other debris or site.
52
�Figure 34. Navy stockless anchor (Ships030). The shank is 2.50m long, and the flukes are
1.15m. The anchor was found in a scatter of unidentifiable debris. Raupp/Ships of Discovery
Science Team.
Figure 35. Navy stockless (Ships021) anchor in approximately 40 ft. of water. Carrell/Ships of
Discovery Science Team.
53
�Figure 36. Navy Anchor (Ships028) located off White Beach. The shank is 1.14m long, and
the flukes are 1.35m wide. Raupp/Ships of Discovery Science Team.
Pontoons
Pontoon debris (Ships023), consisting of three sections, were found outside the entrance to the
harbor. Two are resting parallel to each other and appear joined while the third section is nearby.
Historic Context
Pontoons were welded buoyant steel boxes designed by the U.S. Navy’s Bureau of Yards and
Docks. In February 1941, the Pittsburgh-Des Moines Steel Company received a contract to
produce pontoons for the Navy. Disassembled pontoons were shipped to the Pacific to
designated U.S. Navy Pontoon Assembly Detachments (PADs). There were five PADs situated
in various locations including Guam, New Caledonia, and New Guinea. Each PAD could
assemble around 1,800 pontoons per month (Naval History and Heritage Command 2019).
Pontoons were 5 x 7 x 5 ft. and weighed approximately 2,000 lbs. each. They had an interior
support structure consisting of six-inch steel plates welded together to form a “T” shape, which
was welded girth-wise inside the pontoons. Pontoons could be connected to each other to create a
variety of structures. To facilitate this connection, the right-angled corners of the pontoons were
removed, and punched steel angles were welded in their place. Each pontoon was rated to
support 2,240 lbs. (Department of the Navy, Bureau of Yards and Docks 1947a:157-158,
Friedman 2002:197).
54
�Figure 37. Stockpile of pontoons at Port Hueneme. Note the absence of right angles at the
corners of each pontoon. Department of the Navy, Bureau of Yards and Docks 1947a:158.
In addition to the standard 5 x 7 x 5 ft. pontoon, a curved bow pontoon was also made. These
could be attached to standard pontoons to create mobile barges, or Rhino ferries, powered by
Murray-Tregurtha outboard engines. Rhino ferries were typically 6 x 18 ft., 4 x 12 ft., or 3 x 7 ft.
individual pontoons. Other sizes of barges were also built (Department of the Navy, Bureau of
Yards and Docks 1947a:159, Friedman 2002:199).
Pontoons were used for a wide variety of purposes. The Bureau of Yards and Docks published
the Pontoon Gear Manual in 1944 listing 31 standard configurations. These included causeways,
dry-docks, finger piers, and crane barges. Pontoons were also used to store gasoline (Department
of the Navy, Bureau of Yards and Docks 1947a:157-158).
The draft of a loaded LST (Landing Ship, Tank) ranged from more than three feet forward to
over nine feet aft (Department of the Navy, Bureau of Yards and Docks 1947a:114). This draft
was too deep for LSTs to be beached and unloaded in many areas. So, pontoon causeways were
often used to help facilitate offloading. LSTs transported causeway sections slung on shelves and
secured by rope on the ship’s sides. They were released as the vessel moved shoreward letting
momentum carry the sections toward the shore where one end was beached (Figure 38).
55
�Figure 38. Pontoon causeway section being released from the side of an LST. Department of the
Navy, Bureau of Yards and Docks 1947b:78.
On Peleliu, pontoons were used for three primary purposes: as causeways, barges, and in the
construction of the harbor. Causeways were constructed on Orange Beach 3 and on Purple Beach
(Figure 39). The causeway at Orange Beach 3 was started on D-day September 15, 1944 and
completed six days later (Figure 40). Seabees and engineers built it under Japanese fire using
bulldozers to clear coral heads from the reef before the causeway could be installed. (Doane
1945:414-415, Hough 1950:22). Six LSTs brought pontoon causeway sections to Peleliu
consisting of 2 x 30 pontoons, and were approximately 175 ft. long and 14 ft. wide (Figure 41)
(Doane 1945:414, Hough 1950:23).
56
�Figure 39. Pontoon causeways and LSTs at Purple Beach, Peleliu. NARA RG-127
Figure 40. Causeway on Peleliu at Orange Beach 3. Hough 1950:22.
57
�Figure 41. Soldiers land on Peleliu using pontoon causeway. Hough 1950:110.
A storm destroyed the Peleliu causeways about two weeks after they were constructed scattering
pontoons over the beaches for several miles (Doane 1945:415). The causeways were quickly
rebuilt and were back in operation within 24 hours. Pontoons composing the causeway at Orange
3 were filled with coral rubble to prevent them being washed away again (Doan 1945:415-417).
Landing craft other than DUKWs and LVTs generally could not cross the shallow fringing reef
at Peleliu, so moving cargo from ship to shore was challenging. An innovative solution using
motorized barges and cranes was tried for the first time at Peleliu. Barges were outfitted with
cranes in landing operations such as Guadalcanal. However, these stationary barges were
vulnerable to enemy fire. Cranes mounted on barges, however, could move out of range of
Japanese fire when necessary. To address this issue, nine motorized barges, each seven pontoons
long and three wide, were transported to Peleliu intact and slung on the sides of LSTs. When cut
loose, they moved under their own power to specially designated ships and each received a
crane. From there the barges went to stations on the reef (Figure 42). Landing craft loaded with
cargo approached from one side, and the crane picked up the cargo and transferred it to an LVT
or DUKW moored on the other side. In this way, cargo was efficiently transferred from ship to
beach. These crane-mounted barges were a successful innovation (Hough 1950:23).
58
�Figure 42. Pontoon barge with crane at Peleliu. Hough 1950:24; Department of Defense Photo,
USMC 95354.
Additionally, small pontoon rafts were used as intermediate aid stations for wounded being
transported by DUKW or LVT between Peleliu and ships offshore. They were marked with a
Red Cross insignia, consisted of six pontoons, and were operated by one doctor and two
corpsmen (Bronemann 1982:44).
Construction of a channel and harbor began on October 20, 1944 (Figure 43). The channel was
located just south of the causeway at Orange 3. The causeway became the northern bulkhead of
the channel, and was eventually covered with coral rubble. Cranes for dredging the channel were
mounted on barges and on the beach. Dredging continued 24 hours per day for three months.
Coral-filled pontoons were laid alongside the channel to form a dock on which cranes could be
mounted. Pontoons were also used to line the harbor to create bulkheads and piers for a boat
basin. This was the final stage of harbor construction, and because they were no longer needed to
support operations, pontoons were taken from the barges and causeways used in the invasion
(Doane 1945:415-417). These pontoons are still in evidence today at the harbor (Figure 44).
59
�Figure 43. Harbor at Peleliu. Department of the Navy, Bureau of Yards and Docks 1947b:331.
Figure 44. Remains of a pontoon used in the construction of the harbor. Roth/Ships of Discovery
Science Team.
60
�Analysis
The three sections of pontoon barge remains are located outside the harbor in approximately 40
ft. of water (Figure 45). Two conjoined sections and a separate section are clearly
distinguishable. It is possible that the pontoon debris found outside the entrance to the harbor are
sections of the causeway destroyed by a storm shortly after they were installed. Subsequently,
pontoons composing the causeway at Orange 3 were filled with coral rubble to prevent them
being washed away again (Doan 1945:415-417).
Figure 45. 3D model of the three sections of pontoon found outside the harbor in approximately
40 ft. of water. Model rendering by Pascoe/UHH/Ships of Discovery Science Team.
LVT Wreck
The disarticulated remains of a landing vehicle, tracked (LVT) (Ships032) in 30 ft. of water off
the White beach are scattered across a 30-meter area.
Historic Context
LVTs used in the invasion of Peleliu were the troop carrying LVT-2 and -4 (Figure 46 ) and the
cannon mounting LVT (A)-1 and (A)-4. Troop transport LVTs could carry 24 troops plus a crew
of 2-3 during the initial waves of the invasion.
Analysis
The site consists of a radial engine, miscellaneous framing, and multiple roller assembly pieces
(Figure 47). The remains of this LVT were few and widely scattered across the sea floor. Most of
the pieces remaining of this LVT are unidentifiable pieces of metal and tubing (Figure 48).
Divers searched the area but were unable to locate any further remains of this vehicle. However,
the radial engine is recognizable and still inside its engine mount. Three rollers that were used to
guide the vehicle’s tracks are also scattered about around the site. The only other identifiable
61
�piece is a ring hook that is located towards the beach from the engine. Ring hooks like this were
found on the bow of most LVTs. The scatter and lack of material remains at this site are what
one would expect to find in the event of a catastrophic loss. It is impossible to determine the
model of this LVT, but it is probably a LVT-2 or -4 based on the fact that there is not a turret
nearby. This LVT was most likely destroyed on its way to the beach.
Figure 46. LVT-2/LVT-4 could carry up to 24 troops with a crew of 2-3. Photo
Milityfactory.com.
62
�Figure 47. Portion of the disarticulated remains of an LVT (Ships032). Raupp/Ships of
Discovery Science Team.
Figure 48. Roller assembly from disarticulated remains of an LVT (Ships032). Raupp/Ships
of Discovery Science Team.
63
�LVT Dump Site
Prior to the project, the science team reached out to Bent Prop to inquire about reports of at least
one LVT sunk off Orange Beach 3 at Camp Beck. Based on information from Bent Prop, the site
was just outside of the harbor mouth in approximately 70-80 ft. of water (Dan O’Brien, personal
communication February 5, 2018). After relocating the site, the first objective was to determine
if these vehicles were catastrophic losses or post war wreckage that was dumped.
Analysis
The first vehicle lies in 61 ft. of water with the bow pointing roughly north at 353 degrees
(Ships038). LVT #1 is almost completely encrusted with hard corals. The most obvious feature
of the site is a large open top 75mm howitzer turret. The only WWII LVT that used a 75mm
howitzer was the LVT(A)-4 (Figure 49). Early versions of the turret have a 50-caliber machine
gun “ring mount” located in the rear of the turret. This turret does not contain a ring mount and
therefore clearly indicates that this is a late model LVT(A)-4 (Figure 50).
Figure 49. Cannon-mounting LVT(A)-1. Photo http://www.tanksencyclopedia.com/ww2/US/photos/photo_us_lvt-2_1-cdts-TheWorldWarsnet.jpg
64
�Figure 50. 3D image of an LVT (A)-4 dumped offshore of Camp Beck. 3D Model by Burns and
Pascoe/UHH/Ships of Discovery Science Team.
LVT #2 (Ships039) is located down slope from LVT #1 and just before the reef drops steeply off
into the abyss. In 96 ft. of water, this vehicle is essentially completely covered with hard corals
and is nearly unrecognizable (Figure 51). The only portion of this vehicle that is not covered in
coral is the underside of the bow. What remains of the superstructure has collapsed under the
tons of coral now anchored to the vessel making the type unidentifiable.
Figure 51. LVT #2 has collapsed under the weight of the coral (Ships039). 3D model by
Burns/UHH/Ships of Discovery Science Team.
65
�A series of straight lines in the coral slightly east of LVT #1 and north of LVT #2 were noted
while attempting to identify LVT #2. Upon closer inspection, the outline of a third vehicle, LVT
#3 (Ships040) began to appear in 75-80 ft. of water (Figure 52). This LVT is also almost
completely covered in coral and collapsing under the weight. It is apparent that this LVT is an
armored (A) version, meaning that it had a large caliber weapon turret mounted to the top of it.
The turret is not present. However, the presence of two lifting hooks on each side of the
wrecking identify this as a LVT(A)-4.
Figure 52. LVT #3 (Ships040) (annotated #3) is nearly indistinguishable from the corals in
which it is embedded. 3D model by Burns/UHH/Ships of Discovery Science Team.
The LVT(A)-4’s predecessor was the LVT (A)-1. This LVT had a 37mm cannon mounted to the
top. The (A)-1 and the (A)-4 used the same vehicle base. The LVT (A)-4’s 75mm turret is
significantly larger and heavier. Therefore the super structure of the LVT(A)-1 needed to be
extended in order to accommodate the 75mm howitzer turret. A pair of lifting hooks was
attached to either side of the rear portion of this elongated superstructure in order to facilitate
assembly. Due to coral growth and the lack of turret, it was not possible to determine if this
LVT(A)-4 is an early or late model.
Based on the preliminary inspections of the three sites, is no indication any of these vehicles
possess the mechanical or electrical equipment required to operate. During WWII, troops
regularly salvaged every piece of usable material from the wreckage of battle. The purpose was
twofold. One, these parts could be used to repair other vehicles. Two, the opposition would
salvage and use anything available to them against the invasion forces. The coral encrusted
breach of LVT #1 is the only item that seems to not have been salvaged.
The fact that three LVTs lay in such close proximity and completely salvaged of usable parts
supports a conclusion that this is the location of a post war dumpsite. The location of the site
between the harbor and just before the reef edge further supports this conclusion. After the initial
invasion, it was imperative for troops to remove wreckage and debris from the battlefield in
order to facilitate supply deliveries and the evacuation of casualties. It is likely that these
66
�vehicles were deemed beyond repair, salvaged of usable equipment, and disposed of at sea. It is
also very probable that beyond LVT #2 off the reef edge, there are likely to be more military
vehicles. That the sites are heavily coral encrusted and extremely well camouflaged attest to the
health of the reefs in general and are in stark contrast to the UDT blast zones.
Lagoon Survey
The walking survey, undertaken on April 10 and 11, 2018, consisted of a 5-person team spaced
approximately 5-6 meters apart. The lagoon is less than 3 ft. deep and the visibility is excellent,
making visual identification possible. An unusual storm in October 2017 eroded areas of the
landing beaches, exposing some remains previously buried but now visible for documentation.
The survey area was roughly rectangular from the south end at the existing harbor at Orange
Beach 3 to the northernmost end of White 1 beach, a distance of approximately 2.25 km (1.4
miles) and from the mean low water line out to the fringing reef, approximately 300 meters (800
ft.). Survey tracks and site locations were recorded using a Garmin GPSMAP 64st GPS.
Sites identified included: disarticulated Sherman tank tracks, DUKW wheels and axels, LCM-3
(Landing Craft, Mechanized model 3), possible bulldozer blade, possible LVT roller and tread,
unidentified engine components, the remains of a U.S. aircraft, and miscellaneous unidentifiable
pipe and cable. Some of the sites recorded are definitely associated with WWII activities (HIST)
or are presumably modern (MOD). Table 8 is a summary of recorded sites. Selected sites
discussed below represent remains only associated with the WWII invasion of Peleliu.
Table 8. Summary of Lagoon Sites
Site
Number
Ships001
Ships002
Denfeld
Site ID
N/A
N/A
Price/Knecht
Site ID
N/A
N/A
Description and Designation Historic/Modern
Ships003
Ships004
Ships005
Ships006
Ships007
N/A
N/A
N/A
N/A
N/A
N/A
N/A
N/A
N/A
N/A
Ships008
Ships009
Ships010
Ships011
N/A
N/A
N/A
N/A
N/A
N/A
N/A
N/A
Remnants of a pipe, approx. 20cm diameter, MOD
Remnants of a pipe, approx. 20cm diameter, MOD
Remnants of a pipe, approx. 20cm diameter, MOD
Remnants of a pipe, approx. 20cm diameter, MOD
Unidentified metal scatter that may be part of a steel casing.
MOD.
Remnants of a pipe, approx. 20cm diameter, MOD
Metal Plate, MOD
LVT Roller, HIST
American Aircraft Landing Gear Strut, HIST
Ships012
N/A
N/A
American Aircraft Plane wing with landing gear, HIST
Ships012
Ships012
Ships013
N/A
N/A
N/A
N/A
N/A
N/A
American Aircraft Plane section (curved), HIST
American Aircraft Plane fragment (shot up), HIST
American Aircraft Radial Engine (1.25 x 1.2m), HIST
Ships014
N/A
N/A
Wheel, DUKW, HIST
Remnants of a pipe, approx. 20cm diameter, MOD
Remnants of a pipe, approx. 20cm diameter, MOD
67
�Site
Number
Ships015
Ships016
Ships017
Ships018
Denfeld
Site ID
N/A
N/A
N/A
N/A
Price/Knecht
Site ID
N/A
N/A
N/A
N/A
Description and Designation Historic/Modern
Ships019
N/A
N/A
Bulldozer bucket, HIST
Ships042
Ships052
N/A
Site 1,
Fea. 5
N/A
N/A
Two Axles with vehicle debris, DUKW, HST
DUKW, Axel and wheel assemblies, HIST
Wheel, DUKW, HIST
LVT Tread, HIST
Two strands of cable, MOD
Sherman tank tread possibly Model M4A2, HIST
DUKW (Amphibious Truck)
Axle and wheel assemblies from amphibious vehicles known as the DUKW (pronounced duck)
were exposed on the beach off White Beach 2 (Ships052), Orange Beach 3 (Ships042), and
68
�Orange Beach 1 (Ships015). The presence of these assemblies from different vehicles in widely
spaced locations attested to their extensive use during the battle of Peleliu.
Historic Context
The DUKW was a six-wheeled amphibious modification of the Army’s 2 ½-ton truck that was
designed to deliver equipment and troops to shore during amphibious landings (Figure 53). The
developmental path of these vehicles differed from that of most other types of landing craft and
landing vehicles used in WWII. Some landing craft, such as the LCM-2, were developed by the
Navy Bureau of Ships (Friedman 2002:98). Other craft were developed by private contractors.
Andrew Higgins designed the LCVP (landing craft, personnel). This vessel became the standard
WWII small landing craft which “literally made large scale U.S. amphibious operations
possible.” Donald Roebling designed the LVT, which was used extensively by Marines in the
Pacific Theater (Friedman 2002:207, 99-100).
Figure 53. Drawing of DUKW from US Army Service Manual. Note the dual rear wheels.
(ww2db.com).
The DUKW was developed by the National Defense Research Committee (NDRC). This
governmental agency was formed to connect the U.S. military with “rapidly advancing science,”
and was not part of the War Department (Doyle 2013:5). Rather, the committee was placed
under the purview of the Office of Scientific Research and Development. The NDRC was
composed of a number of prominent scientists and engineers including Karl Taylor Compton,
President of MIT, James Bryant Constant, President of Harvard University, and Frank Baldwin
Jewett, President of the National Academy of Sciences and President of Bell Telephone
Laboratories. Rear Admiral Harold G. Bowen, Director of the Naval Research Laboratory, also
served on the committee. The goals of the NDRC were lofty – they would essentially coordinate
the input of the scientific community of the U.S. into matters of defense. As such, the committee
was composed of several divisions, which addressed a variety of defense related issues including
69
�armor and ordinance, bombs, fuels, gases, chemical problems, and patents and inventions.
Division C, Communication and Transportation, assisted the Army’s Quartermaster Corps in
designing amphibious vehicles (Doyle 2013:6-7).
The needs for an amphibious truck were manifold. Trucks were integral in amphibious warfare
for moving material from established beachheads to points inland. Amphibious exercises
conducted in 1941 revealed however, that landing craft were unable to bring sufficient numbers
of trucks to shore. An amphibious truck could help remedy this problem (Friedman 2002:100101). Additionally, the Army was interested in amphibious trucks that could work in tandem to
carry tanks ashore, and to serve as pontoon units in bridges and ferries. Finally, such a truck
would be capable of moving large amounts of equipment and men ashore in areas where dock
facilities were lacking (Doyle 2013:14-20).
Members of Division C coordinated with the Yellow Truck and Coach Manufacturing Company
of General Motors, the design firm of Sparkman and Stephens, and the Drexel Institute, on plans
for a 2 ½ ton amphibious truck in April 1942 and was given the model designation DUKW. “D”
indicated the year of vehicle introduction, 1942. “U” meant “Utility,” “K” stood for front wheel
drive, and “W” indicated 6–wheel dual-driving axels. The initial pilot version of the DUKW was
built in Pontiac, Michigan, and tested in June 1942 (Doyle 2013:20).
Mass production of the DUKW began at the Yellow Truck and Coach’s plant in Pontiac,
Michigan in late September 1942. Orders for the DUKW became so large that, to accommodate
them, a Chevrolet plant in St. Louis, Missouri also began producing the vehicle in October 1943
(Doyle 2013:51,131). By the end of WWII, General Motors had produced 21,147 DUKWs
(Doyle 2013:304).
The basis for the DUKW was the CCKW 6x6 truck. This standard Army truck was produced in
great numbers, and so facilitated the production of DUKWs as well (Doyle 2013:14, 35). To
create the DUKW, the truck chassis was fitted with a watertight hull, rudder, propeller, and bilge
pumps (Younts 1950:35). The length of the DUKW was 31ft with a beam of 8 ft. Total weight
was 13,000 lbs (ONI 226 1944:20). DUKWs were powered by a 91-hp GMC Model 270 sixcylinder gasoline engine that could move the vehicle in water at 5.5 knots and on land at 50 mph
(ONI 226 1944:104). The carrying capacity of the DUKW was 5,000 lbs. or 25 troops and their
equipment. The standard crew was two men, a driver and an assistant driver or gunner; however,
the driver could operate the vehicle alone (Headquarters United States Army Forces, Pacific
Ocean Areas 1944:3).
DUKWs were designed to accomplish a variety of missions in different environments.
Beginning in June, 1943, DUKWs were equipped with a central tire inflation system (CTIS) that
could be used to automatically deflate or inflate tires as needed (Doyle 2013:118). Deflation of
tires was necessary in order for DUKWs to move efficiently through sand, and tires had to be
properly inflated to cross coral reefs and move on firm surfaces (Headquarters United States
Army Forces, Pacific Ocean Areas 1944:42, Doyle 2013:118). Prior to the development of the
CTIS, this process was quite laborious and time-consuming, and drivers had to exit the vehicle.
The CTIS allowed the adjustment of tire pressure while the vehicle was in motion (Younts
1950:35, Doyle 2013:118).
70
�The principle function of the DUKW was bringing cargo from ships to dumps and transfer
points, particularly on undeveloped beaches inaccessible to standard trucks, and to areas where
docks were damaged or destroyed. DUKWs could operate in environments that landing craft
could not. They were capable of crossing fringing reefs and offshore bars that might prevent the
use of landing craft, and could also operate in rough surf that would stop landing craft (Younts
1950:5). An A-frame boom with a 5,000 lbs. capacity could be mounted on the rear of a DUKW
(Figure 54). This A-frame allowed a DUKW to unload other vehicles when cranes were not
available (Doyle 2013:101).
Figure 54. DUKW using aft-mounted A-frame boom to load jeep onto a CCKW 6 x 6 truck.
Headquarters United States Army Forces, Pacific Ocean Areas 1944:2.
DUKWs were particularly adept at transporting the 105mm Howitzer, and this was another
primary function of the vehicle. The DUKW could get these howitzers into action sometimes
days before other means of conveyance were available (Younts 1950:35). Unarmored DUKWs
were not really designed for use during the assault phase of amphibious landings, the lack of
armor providing no protection from enemy fire (Headquarters United States Army Forces,
Pacific Ocean Areas 1944:2). However, they were used in this capacity in some actions. They
could be outfitted with a variety of armament, and could provide fire support when called upon
to do so. DUKWs had ring mounts for .50 caliber machine guns, and could carry a pallet of quad
.50 caliber machine guns that could be fired during transit. Additionally, 105mm Howitzers were
71
�carried by DUKWs, and these could be rigged so that they could fire while being transported.
They could also carry Mark 7 and Type 7, Model 1 rocket launchers (Headquarters United States
Army Forces, Pacific Ocean Areas 1944:5, 7-8, Younts 1950:35).
Evacuating wounded from battlefields to hospital ships was another of the primary functions of
DUKWs (Doyle 2013:135). DUKWs were outstanding in this capacity for a variety of reasons.
Wounded could be loaded onto the vehicle on land rather than at the water’s edge, which was
preferable, particularly if surf conditions were rough. Additionally, DUKWs had a very low
center of gravity, and so were stable relative to other craft used for this purpose. This helped
insure the safety and comfort of the wounded. Finally, DUKWs could drive up the ramp of an
LST so that patients would not need to be unloaded to be taken aboard (Younts 1950:61).
Up to 12 casualties on stretchers were carried by a DUKW in a two-tiered configuration
(Headquarters United States Army Forces, Pacific Ocean Areas 1944:5). Six stretchers could rest
in the cargo hold on a lower level, and six more stretchers could be arranged above those resting
on specially designed combings with guardrails that prevented this top tier from becoming
dislodged and falling (Doyle 2013:132-137). DUKWs could carry up to 40 walking wounded as
well (Headquarters United States Army Forces, Pacific Ocean Areas 1944:5).
The DUKW did have certain limitations. The size of the cargo area was somewhat limited, so
that they could not carry larger artillery such as 155mm Howitzers. The largest vehicle that could
be transported by a DUKW was a ¾-ton truck. There was no ramp or gate for loading or
offloading, so all cargo had to be moved over the side of the vehicle, presenting challenges when
handling cargo. Additionally, the slow cruising speed while transiting water meant that the
DUKW was not generally deployed far from shore. Finally, DUKWs had trouble gaining traction
in mud and could not negotiate large rocks. Therefore, they avoided swamps, marshes, rivers
with muddy banks, and areas with tree stumps, boulders, and wreckage (Headquarters United
States Army Forces, Pacific Ocean Areas 1944:2-3, Younts 1950:62)
DUKWs were used in every theater of battle in WWII. In July, 1943, 400 participated in the
invasion of Sicily in their first operational use of the war (Younts 1950:60, Doyle 2013:153). At
Normandy, they brought ashore roughly 40 percent of all cargo between the invasion on June 6,
1944, and September 1, 1944. Some 2,000 DUKWs were used in this action (Younts 1950:6061). In the Pacific, DUKWs were used in New Guinea, Kwajalein, and the Mariana Islands.
During the battle of Saipan in June, 1944, they landed behind waves of LVTs, and brought
ashore men, ammunition, and medical supplies and were used extensively to evacuate wounded
to hospital ships. Later, Marines used DUKWs in the assaults on Tinian, Guam, Peleliu, the
Philippines, Iwo Jima, and Okinawa.
The assault on Peleliu began on September 15, 1944, and DUKWs encountered one of the most
difficult landings of the war (Doyle 2013 203-213). Despite being unarmored, DUKWs very
much played a role in the assault phase of the battle.
The 454th and 456th Amphibian Truck Companies (Marine Div 1 1944:1) operated DUKWs at
Peleliu. These were U.S. Army units attached to the 1st Marine Division. Each truck company
consisted of 6 officers and approximately 170 men (Headquarters, III Amphibious Corps
72
�1944:1). These two companies were each to have operated 50 DUKWs at Peleliu (Rottman
2005:54). According to one primary source however, there were only a 95 DUKWs present
during the assault (Brittain 1944:9).
DUKWs were deployed to the Peleliu beaches in the fourth and fifth waves of the attack (Leroy
B. Bronemann Collection). Vehicles in these assault waves faced intense mortar and artillery
fire, particularly on White Beach 1 and Orange Beach 3, where Japanese defenders were
positioned on the flanks of the invasion force (Figure 55) (Marine Division 1 1944:37). To
provide some indication of the volume of this fire, high explosive shells struck all but one of the
18 Sherman medium tanks landing in the fourth wave.(Hough 1950:37). One source stated that
25 of the 454th Amphibian Truck Company’s 50 DUKWs were destroyed that morning
(Bronemann 1982:47-48). Another report stated that on September 16, only 45 of the original 95
DUKWs were still operating, while 33 were under repair, and 17 had been knocked out (Brittain
1944:9).
Passages from Eugene Sledge, a 1st Division Marine who landed on Orange Beach, and Leroy
Bronemann, a soldier with the 454th Amphibian Truck Company, provide insights into what
conditions were like on the invasion beaches on September 15 and detail some of the human
costs associated with the invasion. Sledge landed on Orange Beach 2, and Bronemann landed on
one of the White Beaches (he did not specify which) (Sledge 1981:62, Bronemann 1982:40).
“I glanced back across the beach and saw a DUKW (rubber-tired amphibious truck) roll
up on the sand at a point near where we had just landed. The instant the DUKW stopped,
it was engulfed in thick, dirty black smoke as a shell scored a direct hit on it. Bits of
debris flew into the air. I watched with that odd, detached fascination peculiar to men
under fire, as a flat metal panel about two feet square spun high into the air then
splashed into shallow water like a big pancake. I didn’t see any men get out of the
DUKW.” Eugene Sledge (Sledge 1981:59)
“Some of our DUKWs were on the 4th wave and I was on the 5th wave. On the 4th wave,
hell almighty! We go in on a high tide and the DUKWs are up there to move the Marines
in to shore, and the Marines that went in on Higgins boats were layin’ in the water on
high tide! And we couldn’t…those ducks were up to the edge of the men, they couldn’t go
over the men, so everybody piled out and there was more men in the water. Everybody
with their head out of the water. And along come our 5th wave and we couldn’t advance
‘cause here the other DUKWs are being knocked out and burning. Out of 50 DUKWs, 25
of ‘em are knocked out the first morning. 25. Half of them! Half of them! Well, hell
almighty, I was with, our group, was in communications and they had a little van like on
a trailer, and they had all their equipment in their like in a box, like a shoe box, and we
had to throw that into the water and push it up onto the beach, and I got into position
between two rocks, so that I couldn’t get shot at except from the ocean side, they couldn’t
hit me from either side, and I was poking around there wondering what the hell this is all
about, and somebody says “Get DUKW 427 out of here,” and I said that’s my DUKW, so
I got the hell off of between these two rocks, went down there, and here there were
wounded men crawling over to the DUKW to be evacuated, and one guy says “Don’t
touch me, don’t touch me.” I said “What’s the matter?” and he says “I’ve been shot
73
�through the chest,” and he said “And I’m doped up on morphine.” He says “don’t let me
lie down, I can’t breathe.” You could see the blood bubbling out of his chest, and so I
said “Buddy, I’ll hold you,” and I put my gun up on top of the hood of the DUKW, and
hoisted him up, and I held him in my arms like this, across my legs, and I held him.”
We got at least 8 men that were badly wounded. And we took off, my buddy and I, with
our DUKW, and we got out to the platform where we were supposed to take any
wounded. And here was a doctor, and his crew, the medics, and they were so stunned,
and amazed - they didn’t know what to do. And I says for cripes sakes men, these are
men that need your help. And we started lifting over. And what happened, we’ll never
know, because… anyway, you never know what happens to your buddies. As I said 25 of
our 50 ducks were knocked out that very day. And what happened to those men I’ll never
know. And, in the meantime, the casualties in our team were the same as the first marine
division. Four of our boys were killed that very morning.” Leroy Bronemann (Oral
History Interview, Veterans History Project).
Figure 55. DUWK smoldering on beach Peleliu after taking a direct hit. Norm Hatch Collection,
National Pacific War Museum, image Peleliu 039, 1944.
DUKWs were tasked with bringing men, communications equipment, artillery, ammunition,
flamethrower fuel, water, and rations ashore on D-day (Wright 1944:7, Bronemann 1982:40-46).
74
�Later in the battle, DUKWs continued to move equipment ashore from ships and from transfer
points at the reef (Wright 1944:7). They also moved reinforcements, ammunition, rations,
communications gear, and even war dogs from beach areas to the front lines. DUKWs acted as
prime movers for artillery as well (Bronemann 1982:52).
Despite experiencing heavy casualties and the loss, permanent or temporary, of more than half of
the available DUKWs on D-day, the men of the 454th and 456th Amphibian Truck Companies
performed their jobs with great bravery during the battle for Peleliu. As part of the First Marine
Division, Reinforced, both units earned Presidential Unit Citations (Navy). The Citation reads as
follows (Department of the Army, 1948:3):
For extraordinary heroism in action against enemy Japanese forces at Peleliu and
Ngesebus from September 15 to 29, 1944. Landing over a treacherous coral reef against
hostile mortar and artillery fire, the First Marine Division, Reinforced, seized a narrow,
heavily mined beachhead and advanced foot by foot in the face of relentless enfilade fire
through rain-forests and mangrove swamps toward the air strip, the key to the enemy
defenses of the southern Palaus. Opposed all the way by thoroughly disciplined, veteran
Japanese troops heavily entrenched in caves and in reinforced concrete pillboxes which
honeycombed the high ground throughout the island, the officers and men of the Division
fought with undiminished spirit and courage despite heavy losses, exhausting heat and
difficult terrain, seizing and holding a highly strategic air and land base for future
operations in the Western Pacific. By their individual acts of heroism, their
aggressiveness and their fortitude, the men of the First Marine Division, Reinforced,
upheld the highest traditions of the United States Naval Service.
Analysis
Three axle and wheel assemblies (Ships052) are exposed on the shore at White Beach 2 (Figure
56). The distribution of these axles indicates that they probably originated from a single
amphibious vehicle. Denfeld previously recorded this as Site 1, Feature 5 (Denfeld 1988:54). A
previously unrecorded DUKW wheel was found in shallow water off Orange Beach 1 (Ships015)
(Figure 57). No other remains were located in association with Ships015, suggesting it was
dumped rather than from of a combat loss.
75
�Figure 56. Wheel rims and axles from a DUKW exposed during low tide off White Beach 2
(Ships052). Carrell/Ships of Discovery Science Team.
Figure 57. DUKW wheel in shallow water off Orange Beach 1 (Ships015). Arnold/Ships of
Discovery Science Team.
76
�LCM (Landing Craft, Mechanized)
The deteriorated remains of a landing craft (Ships036) were identified in the lagoon adjacent to
Camp Beck/Orange Beach 3. The wreck was noted along with several other metallic objects of
varying size while scanning the lagoon at low tide. Based on physical measurements and
observations of the remains, the wreck appears to be that of a U.S. Navy Landing Craft
Mechanized, Mark III (LCM (3).
Historic Context
Equipped with bow ramps, the LCM (3) type was primarily employed for landing bulldozers,
medium tanks, guns, and trucks in ship-to-shore traffic (Vagts 1963:634) (Figure 58). Until
1940, amphibious warfare vessels were not part of the U.S. Naval fleet; instead ship's launches
and lifeboats were employed as landing craft, though they were entirely unsuited for the task
(Rottman 2004:31). With the entry of the U.S. into WWII, it soon became clear that purposebuilt landing craft were needed for amphibious invasions.
Figure 58. The LCM in Peleliu is likely similar to the pictured LCM(3) offloading a bulldozer
on the Aleutian Islands in April 1945. Greenfield, 1952, pg. 181.
77
�Though numerous designs were considered, an adaptation of the Higgins Corporation’s “Eureka
Boat” was adopted by the U.S. Navy Bureau of Ships in 1942 (
Figure 59) and designated the LCM (Neushul 1998:153). Used during battle and the ensuing
aftermath, the LCM (3) was essential to securing WWII battlefields and establishing necessary
infrastructure thereafter.
Figure 59. LCM-3 production line at the Boston Naval Shipyard 1942. NARA 7326808
The LCM (3) was a variation of Higgins’ original design that incorporated increased size and
cargo capacity (Figure 60). Measuring 50 ft. (15.15 meters (m)) long with a beam of 14 ft. (4.25
m), the LCM (3) weighed approximately 25 tons and incorporated a cargo space of 32 ft. (9.7 m)
by 9.5 ft. (2.87 m) (U.S. Navy 1945: 13).
Often referred to as a tank lighter due to its ability to ferry tanks and other vehicles, the vessel
could carry up to 60,000 pounds of cargo or 120 troops ashore on each run (U.S. Navy 1945:13).
Twin Gray Marine Diesel engines capable of producing 225 hp. provided an average operating
speed of 10 miles per hour (16.1 km per hour). To allow the vessel to be driven well up on the
beach, the LCM (3) incorporated a very shallow draft forward, and but a few feet aft. Two wing
78
�tanks, divided into watertight compartments extend the length of the LCM (3), could keep the
boat afloat even when the cargo space was flooded (U.S. Navy 1945:13-14).
Figure 60. LCM-3 ship model plans, modified. Vintage Model Plans Full Sized Printed Plans
Landing Craft Mechanized; adapted by East Carolina University Program in Maritime Studies;
https://www.vintagemodelplans.com/products/full-size-printed-plan-landing-craft-mechanizedscale-1-16-l37-b-10-suitable-for-radio-control.
The LCM (3) was extensively used for support operations at Peleliu both during the battle and in
the afterwards. Preliminary planning for the battle assumed that various types of landing craft,
including the LCM (3), would be able to beach themselves on the shore for loading and
unloading activities. In reality, the reef proved to be an obstacle that made beaching operations
dependent on the tide. Instead, the LCMs transported cargo from ships positioned offshore to
floating pontoon causeways that were established off the landing beaches. The LCM (3) carried
cargos of fuel drums, barbed wire, and ammunition, as well as bulldozers, vehicles, and trailers.
Analysis
Though heavily deteriorated, much of the lower portion of the landing craft hull is visible (Figure
61). While the exposed wreckage measures 12.95 m (42.7 ft.) in length and 4.1 m (13.5 ft.) in
beam, it is clear that a portion of the bow is missing. Visible remains of the vessel’s structure
include: two wing tanks and their compartment partitions; two of the six manhole covers used to
access them; cargo space plating including two circular hatch covers; many of the 1 m (3.3 ft.)
79
�long raised battens that created traction for vehicle wheels; remains of the engine room’s aft
bulkhead; and sections of rounded deck plate from lower portion of the starboard side, which
created a tunnel for the propeller.
Other discernable features that correspond with construction diagrams for the LCM (3) include
raised deck plating used to create a “non-skid” surface; mooring bitts in the corners of stern; and
pulley sheaves situated near the bow, which were components of the ramp raising and lowering
mechanism.
Portions of iron wreckage thought to be associated with the LCM (3) are also located adjacent to
the wreck site (Figure 61). Approximately 10 m (33 ft.) to the south are the remains of a bow
ramp, which corresponds in size and design to one used on an LCM (3). Though heavily
deteriorated, at the time of inspection the ramp measured approximately 3.63 m (12 ft.) long and
3.2 m (10.5 ft.) wide, and 32 cm (12.6 inches) thick. Located east of the wreck, and situated on
the riprap structure used to support the Camp Beck doc, is a pile of iron debris consisting of
“non-skid” deck plating, possible hull plating, and structural members. This material may be
portions of superstructure that have been displaced over time.
Figure 61. Aerial view of LCM in the shallow lagoon at Orange Beach 3. The nearly 13m by 4
m remains are barely awash at high tide and completely exposed at low tide. Raupp/Ships of
Discovery Science Team.
80
�Figure 62. Camp Beck LCM site. Map by Raupp/Ships of Discovery Science Team.
US Aircraft
The scattered remains of a U.S. aircraft was located off Orange 3 Beach. The four pieces of
aluminum and iron aircraft wreckage are located within a 200-m area in 1-2ft. (.25-5m) of water.
The aircraft identified as a U.S. aircraft because of several English language and numeric part
numbers. The largest single element of the site scatter consists of a portion of a wing with
landing strut in approximately 2 ft. of water (Ships012). Present elsewhere in the lagoon is a
separate piece of landing gear (Ships011), a radial engine (Ships013) and an unidentified curved
piece of aluminum aircraft. Just offshore of the reef a single propeller blade (Ships024) was also
located that may be associated with this site (Table 7).
Historic Context
The F4U Corsair were designed and manufactured by Chance Vought, but as more were needed
and additional production developed, Goodyear built more designated by FG and Brewster built
more designated by F3A. Developed as a carrier-based aircraft, Corsairs entered service in
WWII late in 1944 and early 1945. They were powered by the Pratt & Whitney Double Wasp
twin-row, 18-cylinder radial engine and to extract as much power as possible they were fitted
with the large Hamilton Standard Hydromatic three-blade propeller (13ft and 4 inches [4.06m]).
Built for carriers, Corsairs were designed with a folded inverted gull wing, which shortened the
required length of the struts. They were also fitted with six .50 caliber guns, three in each wing
81
�due to reports coming back from Europe that planes fitted with four were insufficient. This
greatly increased the Corsair’s ability to shoot down enemy aircraft.
Analysis
Aircraft Wing: A large section of disarticulated aluminum aircraft wing and strut was located
during the lagoon survey. The port wing is inverted with three .50 caliber gun ports, the ailerons
are missing, and one piece of landing gear is still attached. Bullet holes are present on the
surfaces of the wreckage (Figure 63).
Based on the short length of the strut and configuration, the curvature of the wing and port
configurations configuration, as well as the three .50 caliber wing ports, this structure matches a
Corsair plane design (Figure 64, Figure 65, Figure 66, and Figure 67).
Figure 63. Inverted wing section with three .50 caliber gun ports and square light port to the
right outlined in red circle. Note the bend to the right of light port. Keusenkothen/Ships of
Discovery Science Team.
82
�Figure 64. F4U Corsair inverted gull wing showing gun port and square light port outlined in red
circle. Photograph by Julian Hertzog, Wikipedia Creative Commons.
Figure 65. Inverted wing. Note rectangular and
circular ports patterns. McKinnon/Ships of
Discovery Science Team.
83
�Figure 66. F4U Corsair underside of starboard wing. Note rectangular and circular ports patterns
similar to the wreckage. Photo by Kevin Reynolds
http://warbirdlegends.com/Allied_Fighters.html).
84
�Figure 67. Aerial view of the aircraft wing at low tide in the lagoon. The landing strut is visible
at the bottom of the photo. Raupp/Ships of Discovery Science Team.
Strut: A second strut (Ships011) was found approximately 143 m southwest of the wing structure
(Figure 68). The strut matches the strut still attached to the wing structure and as such is
considered to be part of the same plane.
85
�Figure 68. Detached strut located in shallow water. Arnold/Ships of Discovery Science Team.
Engine and possible engine parts: Approximately 156 m northwest of the wing is a radial engine
(Ships013) (Figure 69) and a possible section of engine cowling. The engine appears to match a
Pratt & Whitney Double Wasp twin-row, 18-cylinder radial engine, which was the type used on
Corsairs. This piece is considered to be part of the same wreckage (Figure 70). The possible
engine cowling is buried and encrusted with marine growth, which makes its identification
difficult (Figure 71). It is lying about 10 m from the engine
86
�Figure 69. Radial engine exposed on the reef. Arnold/Ships of Discovery Science Team.
Figure 70. Radial engine. Keusenkothen/Ships of Discovery Science Team.
87
�Figure 71. Possible engine cowling. Keusenkothen/Ships of Discovery Science Team.
Fuselage: Approximately 45 m northeast of the aircraft wing, lies a section of internal fuselage
(Ships012). It appears to be a portion of the main beam assembly center section that supports the
inverted gull wing shape (Figure 72, Figure 73, Figure 74, Figure 75).
Figure 72. Curved piece of aluminum fuselage.
McKinnon/Ships of Discovery Science Team.
88
�Figure 73. Disarticulated portion of the main beam assembly center section of the inverted gull
wing shape. Keusenkothen/Ships of Discovery Science Team.
Figure 74. Disarticulated portion of the main beam assembly center section of the inverted gull
wing shape. Keusenkothen/Ships of Discovery Science Team.
89
�Figure 75. Main Beam Assembly http://www.scharch.org/Ed_Scharch/usn-aircraft/07-f4ucorsair.html.
The wreckage likely belongs to a single aircraft tentatively identified as a U.S. Marine F4U or
FG Corsair based on the number wing guns, shape of wing and internal fuselage structure, and
shape and length of strut. Forty-seven Corsair are known to have been lost in 1944-45 in Peleliu
in combat or other operations. The versions of Corsairs lost include the F4U-1D, F4U-4, FG-1,
and FG-1A. If all the identified parts are related, the site would represent a catastrophic loss.
90
�Chapter 4: Terrestrial Inshore Survey
Introduction
The purpose of the inshore survey was to locate Japanese defensive positions that were
strategically located to direct enfilading fire from the shore out to the reef line (Figure 76).
Working with information recorded by Denfeld (1980), and Price and Knecht (2012) the science
team re-examined previously recorded sites and documented several previously unrecorded sites.
Fields of fire were recorded at each defensive position that had clear access to the shore to
support an invasion beach specific KOCOA analysis.
Figure 76. Section of an August 1945 Japanese defensive plan. The red arrows are the Japanese
presumed US avenues of approach for the invasion. The blue arrows represent the fields of fire
of the gun emplacements across the invasion beaches and reef. The blue half-circles on the
beaches represent general defensive positions. Peleliu State Museum.
91
�The inshore survey was conducted between April 3-6, 2018, during which a three-person survey
team, spaced 5-6 meters apart, examined the shoreline from the mean low water line to
approximately 30 meters (100 ft.) inland. The survey area was roughly rectangular from the
south end at the existing harbor to the northernmost end of White 1 beach, a distance of
approximately 2.25 km (1.4 miles). Survey tracks and site locations were recorded using a
Garmin GPSMAP 64st.
Modern and historic sites were recorded; these included: abandoned machinery, equipment
dumps, pontoon dock sections, secondary defensive positions inshore from the main landing
beaches, collapsed defensive caves, concrete “box-like” structures on the shore with unidentified
purpose, secondary low defensive positions with poured concrete, defensive trenches, and
concrete foundations for buildings associated with either the Japanese or U.S. bases were
recorded.
Table 9 summarizes the terrestrial sites inshore of the invasion beaches.
Table 9. Summary of Terrestrial Sites Located Inshore of the Invasion Beaches
Site
Number
Ships041
Ships043
Ships044
N/A
Ships045
N/A
Ships046
N/A
N/A
N/A
Ships047
Ships048
N/A
Ships049
Ships050
Ships051
Ships052
Ships053
Ships054
Ships055
Ships056
N/A
Denfeld
Site ID
N/A
N/A
N/A
N/A
N/A
N/A
N/A
N/A
Site 7
Site 7
N/A
Site 1
Feature 10
N/A
N/A
Site 1
Feature 7
Site 1
Feature 6
Site 1
Feature 5
N/A
Site 1
Feature 11
N/A
Site 1
Feature 20
N/A
Price/Knecht
Site ID
N/A
N/A
N/A
AB219
N/A
AB230
N/A
AB218
AB221
AB220
N/A
Description and Designation (MOD = Modern)
Tug Boat, MOD
Tractor Engine
Debris Scatter (Dumping Area)
Aircraft Dump, 100 m long
Pontoon from Seabee Dock
C-46 Aircraft Engine Cowling
Pontoon from Seabee Dock
LARC Amphibious Vehicle
Japanese Defensive cave
Japanese Defensive cave
Japanese Fuel Barrel Embankment Defensive platform
N/A
AB58
N/A
Japanese Defensive Structure
American Navy Officer Area, Tower Foundation
Tracked Vehicle Treads, prob. Sherman Tank
AB279
Japanese Fuel Drum Embankment Defensive platform
AB280
LVT
N/A
N/A
3 Axles with Tires, DUKW
Tracked Vehicle, prob. Tractor/Bulldozer
AB50
AB60
Japanese Defensive Structure on "the Point"
Japanese Defensive Structure on the road to White Beaches
AB55
AB148
Japanese Coral Ridges and Rifle Pits
Aircraft Dump w/Merlin Engines and Japanese Tanks
92
�Site
Number
N/A
Ships057
Ships058
Ships059
Ships060
Ships061
Ships062
Ships063
Ships064
Ships065
Ships066
Ships067
Ships068
Ships069
Ships070
Ships071
Ships072
Ships073
Ships074
Ships075
Ships076
Denfeld
Site ID
N/A
Site 1
Feature 12
Site 1
Feature 12
Site 1
Feature 12
N/A
N/A
Site 1
Feature 1
N/A
Site 1
Feature 2
N/A
Site 1
Feature 3
N/A
N/A
N/A
Site 3
Feature 1
N/A
N/A
N/A
N/A
N/A
N/A
Price/Knecht
Site ID
AB268
Description and Designation (MOD = Modern)
A6M "Zero" Aircraft
N/A
Japanese Gun and Defensive Structure
N/A
Japanese Reinforced Defensive Cave
N/A
N/A
N/A
Japanese Gun Housing
Sprocket from an Amphibious Vehicle
Japanese Fuel Drum Embankment with pipe fixture
AB52.1
AB54
Japanese Defensive Cave, Structure, and Gun
Japanese Defensive Cave
N/A
AB53
Japanese Observation Platform
Japanese Defensive Cave, collapsed
N/A
N/A
N/A
N/A
Japanese Gun Cave, Collapsed Concrete Slab and Boulders
Engine, poss. from Amphibious Vehicle
Japanese Gun
Pipe Fixture on Concrete Mount
N/A
N/A
N/A
N/A
N/A
N/A
N/A
Japanese Defensive Structure
Octagonal Platform w/trapezoidal monument
Memorial Pedestal, MOD
Concrete Slabs, collapsed box-like structures
Iron Debris, approx. 4 sq. m MOD
Tractor, disarticulated, degraded
Japanese Tug, MOD
93
�Site
Number
Ships077
Denfeld
Site ID
N/A
Price/Knecht
Site ID
N/A
Description and Designation (MOD = Modern)
Iron Buoy, MOD
Ships078
Ships079
Ships080
Ships081
Ships082
Ships083
Ships084
Ships085
Ships086
Ships087
Ships088
Ships089
Ships090
Ships091
Ships092
Ships093
Ships094
Ships095
Ships096
Ships097
Ships098
Ships099
Ships100
N/A
N/A
N/A
N/A
N/A
N/A
N/A
N/A
N/A
N/A
N/A
N/A
N/A
N/A
N/A
N/A
N/A
N/A
N/A
N/A
N/A
N/A
N/A
N/A
N/A
N/A
N/A
N/A
N/A
N/A
N/A
N/A
N/A
N/A
N/A
N/A
N/A
N/A
N/A
N/A
N/A
N/A
N/A
N/A
N/A
N/A
Vehicle Debris, multiple types
Vehicle Debris, multiple types
Disarticulated Concrete Structure
Iron Debris, poss. dock or pontoon
Engine, poss. amphibious vehicle
Japanese Low Defensive Position, poured concrete
Tower Foundations, set of 4, MOD
Japanese Defensive Trenches and American Dump
Japanese Defensive Position With Mount
Tank Base, possible fuel or water tank
Single Aluminum Fragment, MOD
Cement Marker, MOD
Concrete Foundations, prob. assoc. w/Base construction.
Iron frame, MOD
Concrete Foundations
Metal Scrap and Debris, MOD
Engine, tracked vehicle
Japanese Defensive Structure
Concrete Foundations
Concrete Foundations
Concrete Slab with Boilers
Concrete Foundations
Concrete Foundations
94
�Previously Recorded Japanese Defensive Positions
In 1980, Denfeld documented nine defensive positions along the shoreline. In 2010, Knecht,
Price, and Lindsay revisited the majority of the Denfeld shoreline sites and documented an
additional three, adding considerable details on each in their 2012 report. Table 10 summarizes
the 14 previously recorded sites.
Table 10. Summary of Previously Recorded Japanese Defensive Positions
Site
Number
Price/Knecht
Site ID
Denfeld Site ID
Ships048
Site 1 Feature 10
N/A
Japanese defensive site
Ships050
Site 1 Feature 7
AB279
Japanese defensive, Fuel drum embankment
Ships054
Site 1 Feature 11
AB50
Japanese defensive structure on “the Point”
Ships055
N/A
AB60
Japanese defensive structure
Ships056
Site 1 Feature 20 AB550
Japanese defensive structure coral ridges and rifle pits
Ships057
Site 1 Feature 12
N/A
Japanese Gun and Defensive Structure
Ships058
Site 1 Feature 12
N/A
Japanese Reinforced Defensive Cave
Ships059
Site 1 Feature 12
N/A
Japanese Gun Housing
Ships062
Site 1 Feature 1
AB52.1
Japanese Defensive Cave, Structure, and Gun
Ships063
AB54
Japanese Defensive Cave
Ships064
N/A
Site 1 Feature 2
N/A
Japanese Observation Platform
Ships065
N/A
AB53
Japanese Defensive Cave, Collapsed
Ships066
Site 1 Feature 3
N/A
Japanese Defensive, Concrete Slab and Boulders
Ships070
Site 3 Feature 1
N/A
Japanese Defensive Structure
Description
95
�Previously Unrecorded Japanese Defensive Positions
Eleven previously unrecorded Japanese defensive positions, summarized in Table 11, were
located during the shoreline survey.
Table 11. Previously Unrecorded Japanese Defensive Positions
Site
Number
Ships047
Ships061
Denfeld Price/Knecht
Site ID
Site ID
N/A
N/A
Fuel Drum Embankment.
N/A
Fuel drums were used to create the corner of a built up
Japanese defensive position. The rim of a second fuel drum
sitting upright is visible at the top edge of the fuel drum in the
foreground .Roth/Ships of Discovery Science Team.
Japanese Fuel Drum Embankment with pipe fixture
N/A
96
Description
�Site
Number
Ships068
Denfeld Price/Knecht
Site ID
Site ID
N/A
N/A
Ships069
N/A
N/A
Description
Gun. A recently exposed Japanese gun eroding out of a
defensive position (associated with Ships069). Roth/Ships of
Discovery Science Team.
Fixture on Concrete Mount; associated with Ships068.
Roth/Ships of Discovery Science Team
( as s
Ships071
N/A
N/A
Octagonal Platform, with mount
97
�Site
Number
Ships073
Denfeld Price/Knecht
Site ID
Site ID
N/A
N/A
Ships083
N/A
N/A
Description
Concrete Box-like structures, collapsed. Roth/Ships of
Discovery Science Team.
Low Defensive Position constructed of rebar and concrete.
Roth/Ships of Discovery Science Team.
98
�Site
Number
Ships085
Denfeld Price/Knecht
Site ID
Site ID
N/A
N/A
Ships086
N/A
N/A
Description
Japanese Defensive Trenches associated with a dumpsite.
Roth/Ships of Discovery Science Team.
Defensive Position With Gun Mount. Roth/Ships of Discovery
Science Team.
99
�Site
Number
Ships092
Denfeld Price/Knecht
Site ID
Site ID
N/A
N/A
Ships095
N/A
N/A
Description
Concrete Building Foundation. Roth/Ships of Discovery
Science Team.
Japanese Defensive Position (collapsed) built into rock.
Roth/Ships of Discovery Science Team.
100
�Chapter 5: Biological Characterization
Introduction
The reef characterization was conducted over 8 days, April 3-8 and 10-11, 2018. The purpose
was to document areas of the reef that were blasted by UDTs in preparation for the invasion and
to compare the condition and species of the reef with those areas that were unaffected. Several
entire blast zones were modeled in entirety to create 3D maps of these unique areas and to
quantify the geomorphology produced by these activities.
The results of the 3D surveys is available for public view at the Multi-scale Environmental
Graphical Analyses (MEGA) Lab University of Hawaiʻi at Hilo on Sketchfab at:
https://sketchfab.com/BurnsLab/collections/peleliu-project.
Archaeological features were also surveyed to provide information on the presence of coral
species and to document the impact of corals on the preservation of these sites.
Methodology
High-resolution (mm-scale) 3D reconstructions were generated at survey sites by collecting
overlapping images (70-80% overlap) from planar and oblique angles of reef plots. Images were
collected from six 2x2-m plots at three isobaths (~40fsw, ~20fsw, ~10fsw) at each survey site
(18 plots per site). The plots were located from the base of the blast zones to the top of the reef
flat. Survey plots were also conducted along the same isobaths at locations that were not affected
by bombing during the invasion battle.
Scale markers were placed across the study plots to ensure model precision and accurate spatial
rectification. The resulting photographs were digitally reconstructed using SfM modeling
software. SfM software generates 3D digital surface models in three primary stages: 1) photo
alignment, 2) geometry building, and 3) texture building. This process creates 3D point clouds
that result from the projection and intersection of pixel rays from the different positions and
oriented images in 3D space (Clayput et al. 2016, James et al. 2017). These points were then
triangulated and rendered with the original high-resolution imagery to create textured 3D mesh
and georeferenced digital elevation models, which can be used to quantify metrics of 3D
structural complexity (Burns et al. 2015a, Leon et al. 2015, James et al. 2017). The 3D
reconstructions were exported as DEMs and orthophotos to ArcGIS topographic software (ESRI
Inc., USA) for quantification of coral health, community composition and metrics pertaining to
structural complexity (Burns et al. 2015b).
The orthophoto provided a high-resolution photo-mosaic of the surveyed substrate layered with
geometrically corrected DEM such that each cell contains accurate 3D information and can be
used for measurement of topographic parameters. The orthophotos were digitized and annotated
to create unique polygon shapefiles for all individual coral colonies within each surveyed plot.
After the benthic features were annotated, the ArcGIS software was used to calculate multiple
metrics pertaining to 3D characteristics and topographic structure. The data derived from this
101
�analysis was used to characterize differences in reef composition and structure at sites located in
blast zones and those not affect by blast activities.
UDT Blast Impacts on Reef Structures
The original UDT maps, georectified over current aerials images of the invasion beaches,
facilitated preselection of several sites within and outside of the blast zones (Figure 77). At each
location six 2x2 m plots at ~40 feet seawater (fsw), ~20fsw, and ~10fsw were documented,
producing 18 plots per survey site. In total, data was collected on 425 reef plots, 3 complete blast
zones, and 5 underwater cultural heritage sites.
Figure 77. A section of the southern invasion beach with the historic UDT blast zones map
overlaying a modern aerial. Two of the blast zones are at the top. Immediately after the invasion,
the Seabees extensively modified a shallow coral flat and created a small harbor. Map by
Roth/Ships of Discovery Science Team.
This is the first time that historic UDT blast zones have been examined and characterized. The
data collected enabled a statistical comparison of coral reef communities inside and outside these
blast zones to determine the potential impacts on coral reef habitats at these sites.
102
�Results
Benthic Characterization
Orange Beach benthos was comprised of coral, turf algae and crustose coralline algae, whereas
White Barbed 1 Beach was comprised of turf algae and crustose coralline algae (Figure 78).
Similar percentages for invertebrates, macroalgae, and rock and rubble found at Orange and
White Barbed Beach. There was no significant difference in genus richness between regions. On
average Orange Beach had six genera per plot, whereas White Barbed Beach showed five genera
per plot.
White Barbed Beach showed the highest genus richness in shallow sites compared to White
Barbed Beach at mid depths. Orange Beach exhibited highest genus richness (12 genera per plot)
in deeper zones (36-50 ft.). A two-sample t-test comparing the mean genus richness between
Orange and White Beach Barbed found no significant difference (t= 0.77288, df= 47.204, p
=0.44). Porites and Montipora were the most prevalent coral genera at Orange Beach (Figure
79). Diplostrea were most prevalent at White Barbed Beach (Figure 79).
Figure 78. Percent cover of benthic types found among regions. Pascoe and Burns/UHH/Ships
of Discovery Science Team.
To differentiate between the blast zones and those areas of the reef that were not, the science team adopted the
short hand term ‘barbed’ for the blast zones. This stemmed from the presence of barbed wire placed on the reef as a
defensive measure.
1
103
�Figure 79. Percent cover of coral genera found in each region. Pascoe and Burns/UHH/Ships of
Discovery Science Team.
Percent Coral Cover
Sites within Orange Beach had greater mean values of coral cover (mean=34.9 % ± 26.0) than
sites at White Barbed Beach (mean=12.46 ± 14.90) (Figure 80). Results of a two-sample t-test
found a significant difference in coral cover between Orange and White Barbed Beach
(t=0.4832, df=73.204, p ≤ 0.01). There were many sites located within Orange Beach that had
coral cover mean values greater than 50%. White Barbed beach sites showed mean coral cover
values less than 25%, apart from White Barbed Beach 2 site, which had 45% coral cover.
Overall, Orange Beach showed the greatest percent coral cover. Depth categories were created at
both regions and cross-compared. White Barbed Beach encompassed two depth ranges Shallow
(0-15 ft.) and mid (16-35 ft.) (Figure 81). Mid depths showed highest coral cover at White
Barbed Beach (mean=16.16 ± 9.712). The mid depth range showed a contrastingly lower coral
cover for White Barbed Beach. A deep depth range was not recorded during survey due to the
steep decline in slope going down to a depth greater than 100 fsw.
Orange Beach showed the highest coral cover percentage for deeper depths (36-50 ft.). There
was significantly less percent coral cover in shallow regions at Orange Beach. A positive
significant linear relationship was found between coral cover and depth. As depth increased coral
cover also increased. This trend was found between both Orange and White Barbed Beach
(Figure 82).
104
�Figure 80. Coral cover percent among regions. Scatter plot points represent the averages for
each plot surveyed at each region. Along with the average with standard deviation for each
region. Pascoe and Burns/UHH/Ships of Discovery Science Team.
Figure 81. Average coral cover found for each plot among depth ranges and region. Region
average and standard deviation represented with large point and error bars. Pascoe and
Burns/UHH/Ships of Discovery Science Team.
105
�Figure 82. Average 3D surface area complexity found for each plot among depth ranges and
region. Region average and standard deviation represented with large point and error bars.
Pascoe and Burns/UHH/Ships of Discovery Science Team.
3D Surface Area Complexity
3D surface area complexity is 3-dimensional complexity divided by the 2-dimensional
complexity. This metric shows how structurally complex the benthic terrain is. Orange Beach
had the highest average 3D surface area complexity (mean=1.806 ± 0.431) (Figure 83).
Compared to White Barbed Beach, which exhibited a lower 3D surface area complexity (mean=
1.444 ± 0.334). A two-sample t-test found a significant difference between means at each site (t=
4.4647, d.f.= 51.334, p p ≤ 0.01).
Multiple Tukey tests analyzed the 3D surface area complexity between different depth zones.
Orange Beach, shallow had (mean=1.702 ± 0.379) 3D surface area complexity, mid depths
(mean=1.751 ± 0.194), and deep (mean=1.941 ± 0.373). The mean 3D surface area complexity at
White Barbed Beach in shallow zones was (mean=1.464 ± 0.341), and mid depths (mean=1.696
± 0.070).
Significant relationship was found between 3D surface area complexity, diversity, and region. A
positive linear relationship was found between 3D surface area complexity and diversity. As 3D
surface area complexity increased coral diversity also increased. This trend was found between
both Orange and White Barbed Beach (Figure 84).
106
�Figure 83. 3D surface area complexity among regions with plotted averages per each plot. Mean
values and standard deviation is represented with the large point and variance. Pascoe and
Burns/UHH/Ships of Discovery Science Team.
Figure 84. Diversity of coral showed a positive relationship with 3D surface area complexity.
Between regions White and Orange there was also a significant difference in 3D surface area
complexity. Pascoe and Burns/UHH/Ships of Discovery Science Team.
107
�Discussion
Negative impacts on coral reef habitat and composition due to ecological disasters have been
widely documented from hurricane disturbances to blast fishing on coral reefs and found little to
no recovery over time (McManus 1997; Mescher & Sturgess 2018). Contrastingly, this study
found significant recovery at Orange Beach, most likely because the time frame of recovery was
more substantial (74 years at the time of sampling). Given the average growth rate of common
species, Porites and Montastraea, are one to ten centimeters a year (Mescher & Sturgess 2018),
it is reasonable that regrowth was seen after 74 years. The coral composition at Orange Beach,
however, was characterized by having significantly higher percent coral cover and 3D habitat
complexity, when compared to non-blasted reef segments (Figure 80 and Figure 83).
Natural and anthropogenic ecological disturbances influence biodiversity and species richness
across all ecosystems, including coral reefs (Biswas & Mallik 2010). The intermediate
disturbance hypothesis shows that ecological disturbances play a fundamental role in shaping
biodiversity and species richness in an ecosystem (Biswas & Mallik 2010). Percent coral cover,
diversity of species, and three-dimensional (3D) habitat complexity are good indicators of a reefs
overall ecosystem health. Results were supported by the intermediate disturbance hypothesis on
coral reefs after blasting. Overall Orange beach showed a higher percent coral cover, surface area
complexity and diversity then compared to White Barbed Beach (Figure 80, Figure 83, and
Figure 85). This suggests that the ecological disturbance that occurred on Orange Beach altered
the reef by stimulating 3D habitat complexity, thereby providing an opportunistic environment
for dominant coral species to grow rapidly.
Figure 85. Coral cover showed a positive relationship with depth. As depth increased coral cover
also increased. Pascoe and Burns/UHH/Ships of Discovery Science Team.
108
�White and Orange Beaches had similarities and differences between coral genus richness (Figure
79). Both Porites, and Montipora dominated at Orange and White Beaches. Montipora is
important for reef building because colonies initially form massive boulders and flat plates that
provide reef framework, protecting against hurricanes and tropical storms by dampening the
intensity of wave action (Hummann 1993). Porites is a foundation species in the South Pacific
Ocean and carries complex morphological variations. Species of Porites have among the highest
dispersal potentials (Fadlallah 1983; Harrison 2011), and largest geographic ranges, and the
genus is one of very few to occur worldwide in the tropics (Veron & Stafford-Smith 2000).
Given the morphology and importance of these corals, it is reasonable that they exist
predominantly at Orange Beach.
While Orange Beach included a greater variety of hard corals, White Beach was composed
primarily of sand, turf, rock, and soft corals (Diploastrea). Diploastrea was likely found in the
deeper regions of White Beach due to its large mounding dome shape that favors strong currents
found in the White Beach region. Higher percent coral cover and 3D habitat complexity in
deeper waters at Orange and White Barbed Beaches, compared to shallow reef zones (Figure 82).
This is not surprising because fewer disturbances are seen on deeper portions of the reef across
the Indo-Pacific.
Habitat complexity is notable for its fundamental role in providing diverse, physical structures
for living corals (Magel & Burns 2019). Complex, or greater habitat structure supports a higher
diversity of marine organisms, and promotes resiliency to ecological disturbances (Graham et al.
2015). These results provide support for the intermediate disturbance hypothesis on coral reefs
after blasting. The same coral genera (Porties and Montipora) prevailed in both blasted and nonblasted regions. Orange Beach, however, had a significantly higher percent coral cover of Porties
and Montipora than that of White Beach (Figure 79). Perhaps the ecological disturbance that
occurred on Orange Beach caused higher 3D habitat complexity seen in the region, thereby
providing an opportunistic environment for dominant coral species to grow rapidly. These
findings provoke further research on the dynamics between 3D habitat complexity, coral cover,
and species richness in the event of growing ecological disturbances.
Summary
Orange Beach exhibits the highest levels of coral cover and 3D habitat complexity. Orange
beach is mostly coral dominated whereas White Barbed Beach was dominated by turf algae. The
differences in benthic habitat slope and water current likely drive these observed differences in
benthic cover. White Beach has a steep slope and receives more wave energy, which likely
impedes the ability of corals to colonize and grow as large and robust as seen at Orange Beach.
Coral cover increases with depth at both Orange and White Barbed Beach. Coral diversity is a
strong driver of 3D habitat complexity. This trend was found at both Orange and White barbed
beach. These findings indicate that the substantial growth and diversity of corals at Orange beach
cause a structurally complex habitat with high levels of coral cover. Although the reefs at Peleliu
experienced dramatic changes during the battle of WWII, this study found significant recovery of
corals at Orange Beach, which is most likely because the time frame of recovery was substantial
(74 years).
109
�Underwater Cultural Heritage Sites
The biological characterization of the underwater cultural heritage sites occurred during the
period of April 3-8 and 10-11, 2018. This documentation was undertaken to provide baseline
information on species recovery and potential impacts to the sites.
Results
Tractor with Blade
The tractor wreck, in eight feet of water, is mostly comprised of turf, sand, crustose coralline
algae and corals (Figure 86). The SfM model had a coverage area of 78.8 m2. Turf algae was
69.5% of the benthic characterization, while there was 10.5% crustose coralline algae present.
The coral genera that were found at the site was Favia, Isopora, Montipora, and Porites. In total
coral represented 19% of the benthic substrate.
Figure 86. SfM model of tractor wreck found in eight feet of water on the reef flats at
Orange beach. Pascoe and Burns/UHH/Ships of Discovery Science Team.
110
�LVT Dump Site Wreck #1
This site is a portion of an LVT dumpsite in 90 fsw with a coverage area of 191m2 (Figure 87).
This LVT wreck had a large percentage of coral, representing 65%. Coral genera found at this
site was Porites, Montipora, Acropora and Isopora. Soft corals cladiella, lobohypyton and
sinularia were also found at this site and made up 10% of the benthos. Crustose coralline algae
comprised of 16.5% of the benthos. Also present at this cultural site was sand at 2% of the
benthos.
Figure 87. Sfm model of one of the LVT wrecks located in the LVT dumpsite at Peleliu, Island.
Pascoe and Burns/UHH/Ships of Discovery Science Team.
111
�LVT Dump Site Full Model
This cultural site consisted of three potential LVT wrecks (Figure 88). This SfM model has a
coverage area of 443 m2. There was a large benthic percentage of coral at 45.5%; the coral
genera found at this site was Porites, Montipora, and Acropora. There was also a fair amount of
of Sinularia soft coral cover at 13%. Crustose coralline algae covered 13% of the benthic
substrate whereas turf algae covered 22%. Sand covered about 6.5% of this dumpsite. This site
was at a depth of 90-110 ft. on a slight slope in the reef.
Figure 88. Large SfM model of an LVT Dump Site located off Orange Beach, Peleliu.
Potentially there are three LVT located within this model. Pascoe and Burns/UHH/Ships of
Discovery Science Team.
112
�LVT Wreck
This site is off Orange Beach in a depth of 25 ft., with a coverage area 41.5 m2 (Figure 89). A
SfM model was created for the remains of the LVT engine and roller assembly parts. The benthic
substrate was mostly made up from Turf algae on hard substrate at 92%. There was only one
coral genius found at this site which as Montipora, and covered 3.5% of the reef. Crustose
coralline algae comprised 3.5% of the benthic substrate and there was 1% sand.
Figure 89. SfM model of remains of an LVT engine and roller assembly. Pascoe and
Burns/UHH/Ships of Discovery Science Team.
113
�Pontoon Barge
Remains of a pontoon barge was found at roughly 40 ft. (Figure 90). The SfM model had a
coverage area 313m2. The benthic substrate was mostly made up of 66% turf algae on hard
substrate and 20% coral. The coral genera found at this site was Pocillopora and Porites.
Crustose coralline algae covered 7.5% and 6.5% was sand.
Figure 90. SfM model of remains a pontoon barges. Pascoe and Burns/UHH/Ships of
Discovery Science Team.
Summary
Five underwater cultural heritage sites were reconstructed in 3D using structure-from-motion
(SfM) photogrammetry. Cultural Heritage sites consisted of a tractor, LVT dump site, remains of
an LVT, and pontoon barges. All sites were found within Orange Beach in depths of 5 to 110 ft.
The benthic communities on the cultural heritage artifacts consisted primarily of turf algae, coral
and crustose coralline algae. After a substantial amount of recovery time, coral genera Porites,
Favia, Isopora, Montipora, Acropora, and Pocillopora have been able to settle and thrive on these
wreck substrates
114
�Chapter 6: KOCOA Analysis
Introduction
KOCOA analysis was mandated as part of the overall project requirements. It is an extremely
useful tool in understanding the loss, potential presence, and potential absence of archeological
remains associated with a battlefield and their broader historical context.
KOCOA military terrain analysis originated with the U.S. armed forces as a means of analyzing
battlespace geography prior to an engagement (Army 1994:1-1). KOCOA, also written as
OCOKA or OAKOC, involves the systematic analysis of site terrain through different tactical
lenses. Significant terrain features within the battlespace are classified as one or more of the
following: Key Terrain, Observation, Cover/Concealment, Obstacles, and Avenues of Approach
and Withdrawal (Table 12). This classification assists with battle preparation and guides military
strategy.
Today, the U.S. National Park Service (NPS) American Battlefield Protection Program (ABPP)
utilizes KOCOA as one of several terrain analyses for interpreting and understanding historic
battlefield sites (NPS 2016). While initially developed for terrestrial landscape analysis, KOCOA
has successfully been applied to maritime and aerial engagements (Army 1994; Babits et al.
2011; Sabick and Dennis 2011; Frye and Resnick 2013; McKinnon and Carrell 2015). It was
selected for this research due to its flexibility and use on past ABPP projects.
Table 12. Overview of KOCOA Attributes (after NPS 2016:5 and Babits et al. 2011)
KOCOA Attribute
Definition
Examples
Key Terrain and
Features that dominate their
Navigable routes, choke
Decisive Terrain
surroundings by a quality that
points, significant
enhances attack or defeat. Decisive
infrastructure, landing areas,
terrain includes areas that must be
high ground.
controlled to succeed in the mission.
Observation and
Features that provide ability to see
High ground, entrenched
Fields of Fire
friendly and enemy forces. Fields of positions, radar operations,
fire are areas that weapons can
coastal defenses.
cover/fire upon.
Cover and
Features that provide protection
Vessels, buildings, ravines,
Concealment
from enemy fire, observation, and
ditches, overgrowth.
surveillance.
Obstacles
Natural or man-made features which Reefs, entrenchments,
prevent, impede, or divert
earthworks, defenses, swamps,
movement.
mines.
Avenues of Approach Unobstructed routes that lead
Roads, navigable channels,
and Withdrawal
to/away from objectives and key
valleys, paths.
terrain.
Prior to fieldwork, researchers compiled a list of significant terrain features, identified in primary
and secondary sources, which influenced the amphibious invasion (Table 13). During the 2018
115
�project, these features were visited and documented, if possible. While various sites were
investigated during the project, the only terrain features discussed here are those involved with
the initial amphibious landings. These are located between the offshore drying reef and the area
approximately 300 m inshore of the landing beaches.
The following paragraphs present an historical narrative of the amphibious invasion
supplemented by eyewitness accounts. KOCOA terrain features within the study area are
emphasized with bold text and are summarized in Table 13. The chapter ends with a brief
discussion on battlefield integrity and post-battle landscape modification.
Table 13. Terrain Features and KOCOA Attributes Associated with Peleliu Amphibious
Invasion
Feature
Beachhead
Attribute
Key Terrain
Observation
Drying Reef
Lagoon Defenses,
White Beach
Lagoon Defenses,
Orange Beach
The Point
Description
Located 300-700m inshore of the landing beaches, the
beachhead was the first goal of the amphibious invasion
(O-1). The beachhead stretched along the western coast
and included the southern half of the airfield, the
landing beaches, and the island's southern tip.
During the pre-invasion bombardment, both UDT teams
used the reef (and cover provided by the water) as an
observation point for investigating Japanese shoreline
defenses.
The offshore area of the beaches, a stretch of 600 yards,
Avenue of
Approach/Withdrawal remained exposed at low tide. Crossing this stretch of
reef was the only avenue of approach to the beaches.
The reef's shallow depth acted as a bottleneck for
resources moving inshore. At low tide, only wheeled
and tracked vehicles could cross, while at high tide,
Obstacle
some smaller amphibious craft such as LCVPs could
also cross in certain areas, although only for very
limited periods of time.
Prior to the invasion, Japanese troops placed barbed
wire, range markers, and posts in the shallows of the
reef to slow an amphibious invasion.
UDT-6 encountered mines, bombs, and wooden posts
strewn along the Orange drying reef. These obstacles
Obstacle
were found on the beachfront periodically throughout
the invasion. Many coral heads were also present on the
drying reef.
The mines and bombs severely impeded movement
Avenue of
ashore as they slowed and/or re-routed amphibious
Approach/Withdrawal vehicles. Coral heads worked to funnel invasion forces
into narrow avenues of approach.
Obstacle
Key Terrain
Forming the northern end of the first terrain objective
(O-1), The Point was high priority for marines coming
ashore. Control of The Point was key to forming and
maintaining a beachhead.
116
�Feature
Attribute
Observation
Cover/Concealment
Pillboxes on The Point
Obstacle
Obstacle
Tank Traps
Cover/Concealment
Amphibious Vehicles
Obstacle
White 2 Ridgeline
Cover/Concealment
Key Terrain
Orange/White
Promontory
Obstacle
Orange Beach
Obstacle
Orange Brush
Cover/Concealment
Artillery on the
Southern Peninsula
Obstacle
Description
The Point was used by the Japanese for observation over
the White Beaches. Under American control, it became
a means of watching the landing progress.
Pre-invasion bombardment caused little damage to these
structures. Construction materials were chosen carefully
to provide concealment for the occupants.
Sturdy construction and strong defenses made pillboxes
on The Point a deadly obstacle. Marines were forced to
clear the pillboxes by hand to gain cover from Japanese
fire.
On White 1, Japanese defenders were successfully able
to pin down marines caught in the tank traps.
The White 2 and Orange 3 tank traps were used as
American cover from Japanese artillery on the
Orange/White promontory and southern peninsula,
respectively.
As mortar fire increased, so did the number of damaged
LVTs and DUKWs. The heaviest losses on White 1 and
Orange 3 became obstacles for other vehicles trying to
land.
The Japanese used island stratigraphy as a means of
cover. High ground such as the White 2 ridgeline
became ideal locations for artillery and small arms
positions.
The marines who landed on White 2 were charged with
taking the Orange/White Promontory. Those who
landed closest to the promontory succeeded and moved
the forward line towards the airport.
The artillery facing the White beaches significantly
slowed the movement of those in the tank traps.
Fortunately, marines who landed on White 2 surpassed
the area and moved towards the airfield.
Lack of cover (in addition to wide Japanese fields of
fire) made crossing the Orange beaches a deadly
endeavor.
Bordering the Orange beaches was a thin strip of brush
which became the sole source of cover for marines on
the beach.
Japanese artillery on the southern peninsula destroyed
marines on Orange 3 and delayed movement towards
the beach which caused further confusion on shore.
Pre-invasion Planning
By June 1944, U.S. armed forces had made significant headway in their island-hopping
campaign across the Pacific. Having captured or destabilized the Solomon, Eastern Caroline, and
Marshall Islands, the American military was gaining momentum while looking ahead to the
117
�recapture of the Philippines and Guam. Termed Operation FORAGER, the combined Mariana
and Palau Islands campaign aimed to destroy the Japanese “Absolute National Defense Sphere”
(Moran and Rottman 2002:9). The capture of the Marianas would provide U.S. forces with
access to airfields within range of the Japanese homeland, while control of Palau would limit
Japanese reinforcement of the Philippines (Halsey and Bryan 1947:195). The Peleliu campaign,
further differentiated as Operation STALEMATE II, was planned to secure air operations by
capturing airfields on Peleliu and Angaur Islands (Halsey and Bryan 1947:195).
During the summer of 1944, U.S. forces collected aerial intelligence on Palau’s southern airfields
while periodically strafing visible ground installations on Peleliu. This effort to destabilize
Japanese resources was the continuation of air strikes conducted in late March 1944 under the
codename Operation DESECRATE I. While U.S. fighter and bomber aircraft targeted the entire
island chain, the Peleliu airfield bore the brunt of the southern bombings (Montgomery 1944:6,
10). At the onset of STALEMATE II, U.S. intelligence confirmed that the airfield was rebuilt,
which once again made it a target. One crucial element of the reconstruction was missed,
however; the continued focus on Peleliu’s airfield indicated to the Japanese that it was a resource
worth protecting (Gayle 1996:8).
Between March and July 1944, Japanese troops stationed on Peleliu were joined by
reinforcements from the Second Infantry Regiment, an elite group of soldiers who had prior
experience in the Manchuria invasion. By early summer, the total number of Imperial Japanese
Forces on the island was 10,900 (Gayle 1996:8). The arrival of these forces also brought a
change in tactics; previous defensive combat emphasized beachfront attacks using obstacles
(booby traps, mines, etc.) and banzai charges intended to destabilize the enemy (Gayle 1996:5).
American forces that encountered these attacks early in the war found them far easier to
counteract than conducting conventional assaults against fortified positions. By 1944, however,
Japanese generals incorporated a more conservative stance on defense positions into their battle
plans, which emphasized prolonged fighting (Gayle 1996:5). An already extensive cave and
phosphorus mineshaft network existed on Peleliu throughout the northern ridgeline. With the
arrival of the Second Infantry, Imperial Japanese Army and Navy personnel enlarged and
enhanced these caves and shafts with artillery, supply caches, and living quarters to facilitate
extended engagement (Phelan 1945:3). Finally, Japanese leaders anticipated American avenues
of approach and reinforced the beaches and roads with obstacles, observation posts, and artillery
(Gayle 1996:10).
The U.S. invasion of the Marianas in June 1944, proved critical for the Palau campaign because
Japanese documents detailing the troop increase on Peleliu were uncovered during the battle for
Saipan (Moran and Rottman 2002:17). As a result, D-Day was moved from September 7 to
September 15, 1944, which provided a better timeframe for landing beach reconnaissance (Fort
1944:215; Moran and Rottman 2002:17). Aerial imagery, supplemented by current and tidal data
collected via submarine scouting, suggested troops should land near the airfield on the island’s
western beaches, code named White and Orange (Fort 1944:215).
118
�Pre-invasion Beach Reconnaissance
Establishing the White and Orange beachfront, stretching 2,200 yards in length, was the first
objective (O-1) of the amphibious invasion (Figure 91). Chosen for their favorable inshore
terrain and distance from areas of higher ground, the beaches were well defended, necessitating
careful planning. The 600 yard stretch of drying reef off the beaches, which remained partially
exposed at low tide, was of further concern because it was too shallow for LSTs and LCVPs to
successfully maneuver (Rupertus 1944:5). As preparations continued, it became evident that
more information on beach hydrography and potential obstacles was needed. Three days before
the invasion, twelve swimmers from Underwater Demolition Teams (UDT) 6 and 7 deployed to
investigate the submerged reef scape and landing beach terrain (Rupertus 1944:17).
Figure 91. U.S. Invasion Objectives at Peleliu. Top inset: Location of Landing Beaches in
Palauan Archipelago. Bottom inset: Location of Landing Beaches on Peleliu Island. Image by
Roth/Ships of Discovery Science Team.
The first reports from UDT 7 investigating the White beaches were promising. The reef depth
was favorable to amphibious vehicle crossings, and few hazardous obstacles were encountered (
Figure 92). Posts and barbed wire had been driven into the seabed off the White beaches to
slow amphibious craft; however, the swimmers determined they posed no threat to vehicles
119
�(Burke 1944:3). Several pillboxes were visible along the beach; however, the swimmers reported
they “had been demolished by naval gunfire” during previous strafing runs (Burke 1944:1).
Range markers, too, were discovered on the shallow reef. Because these were built to increase
efficiency of shore-based Japanese guns, UDT 7 returned the evening of September 14 to blast
the reef and remove the markers (Burke 1944:3).
UDT 6 encountered significantly more obstacles than their counterparts did farther north. The
Orange beachfront was lined with wooden posts, and submerged mines, bombs, and boulders
were discovered on the drying reef. Following the initial swim survey, UDT 6 transformed into a
forward observation post; the swimmers relayed the positions of shore defenses to the officers on
the destroyers positioned offshore, who, in turn, targeted and shelled Japanese coastal
fortifications (Hutson 1944:2; Rupertus 1944:2). Despite the cover fire provided by the
destroyers, members of UDT 6 spent September 12 to 14 clearing the beachfront under
continuous Japanese sniper and machine gun fire (Hutson 1944:2).
Figure 92. Reconnaissance Map of the White Beaches created by UDT 7. Burke 1944. NARA
RG-38.
120
�D-Day Landing and Initial Assault
As September 15, 1944 dawned gray and overcast, fire support ships set to work delivering one
final salvo before the assault (Figure 93) (Fort 1944:2). During the night, transport vessels
carrying the 1st Marine Division had arrived off the coast; those on board woke to the deafening
sound of U.S. rockets and aircraft strafing runs (Davis 1988:3). Private Leroy Bronemann, a
soldier aboard one of the LSTs, recalls an eerie silence shrouded the island: “it seemed incredible
that anyone could be alive after the Navy’s blistering assault” (Bronemann 1982:38).
Stationed 16,000 yards from shore, naval transports began loading their cargo into smaller
Higgins boats at 0600 hours (Lea 1988:35). Receiving a signal shortly after 0700, the boats
approached the transport lines of waiting LSTs and amphibious vehicles. Each craft bore a
pennant marking the assault wave and group. Located 4,000 yards off the reef, the seemingly
random mass of vessels slowly organized as the 1st Marine Division piled into amtracs and
DUKWs (Hunt 1946:39; Lea 1988:35).
The assault tactics for each wave of amphibious craft were, in the words of Bronemann, “a
simple formation maneuver” (1982:40). The 1st, 5th, and 7th Marine Regiments, all of the 1st
Marine Division, would make a target landfall on their respective beaches with each new wave
of the assault. The 1st Marine Regiment was to land on White 1 and 2, the 5th on Orange 1 and 2,
and the 7th on Orange 3 (Sledge 2007:62).
As the first wave departed the transport lines, the din of the rockets and guns was eclipsed by the
grind and rumble of the amphibious engines (Hunt 1946:40). While the preliminary
bombardment had provided some cover for transport operations, it could do nothing to protect
the LVTs as they approached the reef flat. Fearful of hitting friendly forces, the barrage moved
500-1,000 yards inland beyond the beachfront (Fort 1944:23). Upon final approach, the
amphibious vehicles were met with a deadly mix of mortar and artillery fire (Baker 1944:3;
Bronemann 1982: 41; Sledge 2007:59). Eugene Sledge (2007:59) recalls:
Shells crashed all around. Fragments tore and whirred, slapping on the sand and
splashing into the water a few yards behind us. The Japanese were recovered
from the shock of our pre-landing bombardment. Their machine gun and rifle fire
got thicker, snapping viciously overhead in increasing volume.
As the first wave of armored LVTs touched the sand at 0832H, scheduled for high tide, those on
board threw themselves down onto the beach. The battle had begun.
121
�Figure 93. Smoke from the naval and aerial bombardment rises from Peleliu the morning of 15
September 1944. Photograph taken from USS Clemson. Image from Bureau of Aeronautics
Materials, 247290.
White Beaches
As soon as they crossed the reef, marines began moving towards their key terrain targets. For the
1st Marine Regiment, this meant securing the two massive coral promontories that flanked the
White beaches. At the northern end of White 1 stood ‘The Point’, a jagged coral outcropping,30
ft. in height, honeycombed with infantry positions (Hunt 1946:58). The entire rock face was
reinforced by heavy artillery in pillbox; one 20mm cannon and one 47mm anti-tank gun stood
atop the cliff in pillboxes while another gun, a Model 94 75-mm, was located at the
perpendicular drop to the beach (Figure 94) (Hunt 1946:58).
122
�Figure 94. Japanese military beach obstacles and fields of fire from coastal defenses on the White beaches. Although range markers were removed
by UDT 7, they remain in this image to aid reader with artillery visualization. Artillery caliber sizes and associated ranges were calculated from 2018
site investigation and previous investigation of coastal defenses (Denfeld 1988; Price et al. 2012; Price and Knecht 2015). Map by Roth/Ships of
Discovery Science Team.
123
�Leading the charge against The Point was Company K, part of the 3rd Marine Battalion, 1st
Regiment. Immediately met with an onslaught of artillery and small arms fire, Captain George
Hunt later wrote that The Point “surpassed by far anything we had conceived of when we studied
the aerial photographs” (1946:58). The intelligence provided by the UDTs and aircraft grossly
underrepresented the island’s terrain and Japanese military fortifications. For example, the
rubble topped pillboxes, which UDT 7 believed destroyed, were concealment points,
“unscarred by the terrific bombardment” (Hunt 1946:68).
To gain control of The Point, marines from Hunt’s Company climbed the rocky embrasures and
cleared the structures by hand (Hunt 1946:63-64). Despite the short duration of the fighting, it
was under U.S. military control by mid-morning, both the Japanese defenders and the First
Marine Regiment paid a steep price in casualties (Hunt 1946:69). As those on The Point awaited
reinforcements, a picture of the White beach defenses (Figure 95) began forming:
Extending from the Point inland and then running parallel to the beach was a
coral ridge about twenty-five feet high. From this as well as from the Point the
Japanese raked the beach and the flat area of the coconut grove with murderous
machine-gun, rifle, and mortar fire. On our left, by the use of two platoons, that
momentum carried us over the Point. On the right, the momentum died when the
second platoon was caught in the tank trap, which was covered by that ridge
about fifty yards in front of them (Hunt 1946:81).
While the tank traps were observed by UDT 7, Hunt’s comments indicate they were heavily
underestimated by those on White 1. The trenches measured anywhere from 5 to 15 yards across,
were close to 10 ft. deep, and ran parallel to each of the beaches for several hundred yards (Hunt
1946:75). One of the men caught in the trap later told Hunt (1946:82):
Just after we landed on the beach, the fellas began getting’ shot by machine guns
from that ridge. Then after a lot of runnin’ with bullets and shrapnel flyin’ all
over, I found myself in this deep tank trap, and already could see that everybody
was split up and separated.… Any time anybody tried to climb out and keep
attackin’, they was shot.
In a curious twist of fate, it was the arrival of amphibious tanks during the later invasion waves
that provided enough cover for the marines in the White 1 trap to retreat (Hunt 1946:86).
Other obstacles, too, slowed reinforcement of The Point. Having arrived on the front as part of
the 5th assault wave, Bronemann (1982:41) recalls:
Burning DUKWs and burning amtracs told us that all the mortar shells weren’t
missing. Marines were lying behind a small coral shelf, making it impossible to
drive our DUKWs on land. Whistling bullets bore down on us as we hit the water
like rats leaving a burning ship. By now the front line extended twenty feet from
the beach into the water!
124
�Of the 50 DUKWs in Bronemann’s transportation division, half were knocked out from mortar
and artillery fire (Figure 95) (Bronemann 1982:47). While the abandoned vessels became
chokepoints for transport across the reef, men and provisions eventually made it onto the White
beachfront.
Figure 95. Burning amphibious vehicles off White beaches 1 and 2 on September 15, 1944. The
White/Orange coral promontory is visible with smoke rising behind in center of image. Note
range markers and posts off the beach. Bureau of Aeronautics Materials, 46697.
At the southern end of the White beaches, marines were making significant inroads towards the
day’s objective. On White 2, members of the 2nd Battalion, 1st Marine Regiment, used the tank
traps to their advantage. Rifleman Russell Davis (1988:21) would later write that the trench was
“the best cover on the beach.” The tank trap bottom was out of range of the deadly artillery fire
coming from the bunker on the White/Orange promontory.
Ordered to link up with the 5th Marine Regiment, Davis used the cover provided by the trenches
as he traversed the beachfront (Davis 1988:23). By the time he arrived at the bunker, “the assault
men had it in its last stages. Riflemen worked all around it and some of them were in close to the
wall, stuffing hand grenades through the fire ports” (Figure 96) (Davis 1988:24). Shortly after,
the White/Orange promontory was taken and the 1st Marine Regiment met with the 5th on the
western edge of the airfield, thus completing O-1.
125
�Figure 96. The White/Orange promontory, seen on the right, caused little delay in troop
movement on White 2. By the time Davis reached the area, the majority of men were already
nearing the airfield. Frederick R. Findtner Collection, USMC Archives, 2-10.
Orange Beaches
Over 1,500 yards across, and close to double the length of the White beaches, both the 5th and
7th Marine Regiments assaulted the Orange beachfront (Sledge 2007:65). The initial plan for
landing was straightforward; once on the beach, the 1st Battalion, 5th Marine Regiment, was to
swing north to join the 1st Marine Regiment and push east towards the airfield. The 3rd Battalion,
5th Marine Regiment,would land on Orange 2 and work towards the airfield, only a mere 300
yards inshore. Finally, the 7th Marine Regiment, landing on Orange 3, would move southeast and
secure the southern peninsula (Sledge 2007:62). Simple in design, execution of the landing
proved far more challenging than anticipated.
Unknown to the landing parties, Japanese swimmers had returned to Orange 3 the evening of
September 14 to plant submerged mines and bombs on the reef (Figure 97 and Figure 98).
Boulders and coral heads, too, remained exposed in the surf. As amphibious vehicles carrying
the 7th Regiment churned towards shore, individual craft moved into the waiting minefield. By a
sheer stroke of luck, the Japanese military had failed to prime the devices (Baker 1944:6).
126
�Figure 97. Japanese beach obstacles and fields of fire from coastal defenses on the Orange beaches. Artillery caliber sizes and associated ranges were
calculated from 2018 site investigation and previous investigation of coastal defenses (Denfeld 1988; Price et al. 2012; Price and Knecht 2015). Map
by Roth/Ships of Discovery Science Team.
127
�Figure 98. Andy Anderson, UDT 7, with a Japanese J-13 mine at Peleliu, 1944. National Navy
UDT Seal Museum, 2002.00334.12.
Still, discovery of the trap slowed the vehicles long enough for Japanese 75mm guns on the
southern peninsula to begin firing 2 (Fort 1944:2; Lea 1988:40). LIFE magazine correspondent
Tom Lea (1988:35) later remarked that after watching a forward LVT stopped dead by a
Japanese shell, there was no way for their transport to land on the far right of Orange 3. While
Lea (1988) does not discuss their eventual landing location, it is likely many vehicles carrying
the 7th landed at Orange 2 (Moran and Rottman 2002:52). When they reached the beach, the 7th
Marines encountered more land mines and crude booby traps that again slowed movement as
the men were forced to move carefully (Lea 1988: 42-43).
Due to heavy post-war landscape modification of Orange 3, these firing positions were not relocated during the
2018 survey. Japanese defensive maps from May and August 1944 indicate there were several artillery pieces
located on the southern end of Orange 3 and on the southern peninsula.
2
128
�On Orange beaches 1 and 2, the first waves of amphibious craft landed just as American naval
gunfire shifted inshore. Nevertheless, within the first ten minutes on the beachfront, eleven LVTs
were dead in the water (Fort 1944:23). The open expanses of sand and lack of cover made any
visible structure a target of Japanese fire (Lea 1988; Sledge 2007:59). An eyewitness to the
destruction, mortar man Eugene Sledge (2007:59) writes:
I reached the edge of the beach and flattened on the deck. The world was a
nightmare of flashes, violent explosions, and snapping bullets. Most of what I saw
blurred. My mind was benumbed by the shock of it. I glanced across the beach
and saw a DUKW roll up on the sand at a point near where we had just landed.
The instant the DUKW stopped, it was engulfed in thick, dirty black smoke as a
shell scored a direct hit on it. … I didn’t see any men get out…
Despite the fiery onslaught directed towards the amphibious vehicles, rifleman Jim McEnery
states “the First Marines were on our left, and the Seventh Marines were on our right, and it
looked like both of them were catching hell. But those of us in the center of the beachhead with
the Fifth Marines weren’t as bad off” (McEnery and Sloan 2012:208). While the dead DUKWs
and LVTs again became an obstacle for landing, the wider expanse of beach at Orange 1 and 2
prevented severe congestion and allowed many of the vehicles to make it to shore.
Once on the sand, the largest obstacle to movement across the Orange beaches was the lack of
cover; nowhere along the beachhead was there any structure “over knee high” (Sledge 2007:61).
McEnery (2012:211-212) remembers the difficulties in moving towards the airfield:
Once K/3/5 got past the beach, the ground was solid coral that was next to
impossible to even dent with a trenching tool, and the only natural cover between
the beach and the field was some scrubby brush and a few low outcroppings of
coral. Some of the men were able to find enough rocks to pile up and crawl
behind, but many others were basically out in the open with nothing to protect
them.
Echoing the same sentiment, Johnston (1998:74) states:
As I stood there on that beach, it didn’t seem to me that our attack had worked out
quite as planned. Nowhere could I see that anyone had gotten across the beach
and through that little strip of brush that was between the beach and the airfield.
Mortars and artillery rounds landed up and down the length of the beach.
Automatic small arms fire came at us from the high ground on our flank. We
advanced through the fire across the beach as rapidly as possible. When we
reached the cover of the brush strip we stopped. Everywhere people were trying
to figure out where everybody was (both our elements and theirs) and what the
hell was going on.
While many of the marines took cover in the brush that formed a shallow defilade, Sledge
(2007:61) recalls only a temporary feeling of relief, as “the Japanese probably would pour mortar
fire into it to prevent it being used for shelter.” The sentiment which grasped the 5th Marine
129
�Regiment was to continue moving, pushing forward towards the other regiments. The 1st
Battalion, 5th Regiment soon encountered the 1st Regiment and was able to hold O-1 on the
outskirts of the airfield (Moran and Rottman 2002:49). The 3rd Battalion, 5th Regiment moved
south to link up with the 7th Regiment.
On Orange 3, the 7th Marine Regiment was finally able to gain some ground. U.S. dive-bombers
had targeted the southern peninsula, which silenced the Japanese 75mm guns (Lea 1988:41). As
the marines moved forward, they stumbled into the Japanese tank traps, and finding they
provided decent cover, the 3rd Marine Division 7th Regiment used the deep ditches for the
command post (Lea 1988:42).
While the 7th Regiment began clearing the area, a critical flaw in the front was discovered. In an
effort to join the 5th and 7th Regiments, twice the 3rd Battalion of the 5th Marine Regiment
outpaced their counterparts, resulting in gaps along the far-right flank. K Company of the 3rd
Battalion, 5th Marine Division, made it across to the scarlet beaches on the island’s eastern shore
before realizing their mistake (Sledge 2007:65). Fortunately, the 7th Marines were able to close
the gap by the end of the day, creating an awkward but complete frontline.
By 1800 on the evening of September 15, the 1st Marine Division had secured a beachhead
measuring over 3,000 yards in length and stretching close to 500 yards in depth, with K
Company, 3rd Battalion, 5th Marine Regiment stationed almost 1,500 yards inshore (Rupertus
1944:37). This area encompassed the majority of the first day’s objectives and was hard won;
total U.S. military casualties alone amounted to 1,298 killed, wounded, or missing in action
(Rupertus 1944:37). Tom Lea (1988:48) notes that as marines dug into the hard coral, “the Jap
mortars were far from silent, and direct hits on this kind of concentration really played hell. Yet
regardless of fire, the marines were pouring everything they could get on the beach before
nightfall and the expected counterattack.” The beachfront would survive three separate banzai
charges from Japanese soldiers before dawn.
Aftermath of the Landing and Beach Modifications
As the battle moved further inshore on D+1 (September 16, 1944), the beachfront became an
active interface between maritime and terrestrial parties. UDTs returned to the reef to remove
mines and bombs that were discovered in “unprecedented numbers” (Fort 1944:218). To more
efficiently move resources and personnel ashore, a pontoon causeway joining the shore and
deeper water was constructed at Orange 3 (Rupertus 1944:136). With the introduction of crawler
cranes mounted on barges, supplies from LSTs were directly deposited on LVTs and transferred
to waiting trucks on shore (Gayle 1996:16).
For the marines on the frontlines, stiff Japanese resistance was encountered until the end of the
battle. The discovery of an extensive network of caves on D+1 set the stage for the remainder of
fighting which stretched through November 1944. On October 20, the remaining 1st Marine
Division was withdrawn to the landing beaches, replaced by the Army 81st Infantry Division
(Mueller 1945:9). Final combat deaths from the Peleliu campaign are estimated at 10,000
Japanese and 3,000 Okinawan and Korean conscript laborers (Price and Knecht 2012:11). Of the
130
�16,459 First Marine Division personnel involved with action on the ground, 7% (1,124) were
killed in combat and 31% (5,141) were injured (Rupertus 1944:55).
Under U.S. military control after the battle, air facilities on Peleliu and Angaur were used as a
staging point for invasion of the Philippines (Hough 1950:179). The U.S. Navy commissioned
the Peleliu Naval Base in 1945 and remained in operation through 1947. During this period,
Japanese soldiers continued to emerge from entrenched positions; a group of 19 surrendered in
February 1945, while 34 emerged from a cave in 1947, the last formal surrender of WWII (Price
and Knecht 2012:12).
Summary of KOCOA Features and Battlefield Boundaries
The Peleliu landing beach invasion required coordinated efforts between U.S. Naval, Army, and
Marine forces. Key terrain for the initial assault included the beaches, the primary terrain
objective (O-1) for September 15, and coral promontories expected to hold Japanese defenders
(Figure 99). While pre-invasion observation provided detailed information on reef hydrology, it
failed to account for the Japanese island defenses including the extensive fields of fire covering
the reef tract (Figure 99). The U.S. amphibious vehicles that traversed the shallow lagoon soon
encountered artillery and mortar fire, becoming themselves obstacles for later waves of the
invasion (Figure 99). Despite the efficacy of Japanese defenses, including mines, tank traps,
and concealed gun emplacements, several obstacles became a means of cover for marines on
the beaches (Figure 99). Nevertheless, the effort to secure the beachhead was extensive and both
Japanese and American personnel endured heavy losses by the end of D-Day.
Post-Battle Landscape Modification and Integrity
Today, the landing beaches on Peleliu remain much as they were when U.S. forces left the island
in 1947. Japanese pillboxes stand empty on prominent rocky outcroppings along the shoreline
while earthen defenses are, in some cases, still present (see Ships086). The Japanese tank traps
and rifle pits, which feature prominently in historic accounts, can also be encountered in the
landscape (e.g. Ships056 and 085). Perhaps most significant to understanding post-battle activity
is that some of these pits became middens for WWII materials. While visiting the Orange
beaches in 2018, researchers encountered a wide array of material culture including rolls of
barbed wire, U.S. military canteens, and both Japanese and American vehicles buried at
Ships085. The location of these materials on site suggests they were bulldozed into the traps as
the airfield and surrounding areas was cleared for American use (Figure 99). While these actions
did not occur during the initial invasion, they represent historic U.S. military area use and
immediate post-battle occupation.
131
�Figure 99. KOCOA terrain features on the Peleliu Landing Beaches. Map by Roth/Ships of Discovery Science Team.
132
�Figure 100. Detail from 1946 map of Peleliu titled “Ngarmoked NW-D, Palau Islands.” Note
southern harbor and tent areas on the White and Orange beaches. U.S. Army Map Service, 1946.
The heaviest area of landscape modification occurred at the southern end of Orange 3. Following
establishment of the Peleliu Naval Base, the U.S. Navy Seabees filled the reef to create an
artificial harbor for small craft (Figure 100). Nevertheless, WWII cultural materials are still
visible in the construction of the marina; part of the fill for land reclamation includes the pontoon
barges from the 1944 Orange beach LST ramp. Moreover, post-battle cleanup is exhibited
nearby; the extensive remains of an U.S. aircraft graveyard are present on the southern side of
the marina. The aircraft, likely deposited at the harbor after the war for shipment, never managed
to leave the island. Post-war, aluminum and iron scrap drives were common throughout the
Pacific. Similar scrap middens from salvaged WWII sites have been encountered throughout the
Marianas, Marshall, and Caroline Islands (Spennemann 1998).
133
�Battlefield, Core, and PotNR Boundaries
In 1944, the entirety of Peleliu was a battlefield and the entire island was nominated to the
National Register of Historic Places in 1984 (National Park Service 1984) and was considered
for national landmark status in 1991 and again in 2003 (National Park Service 2003).
Should the National Register boundary ever be considered for modification, the entirety of the
Orange and White landing beaches, including the lagoon and reef crest, should be included as
part of the larger battlefield boundary due to the significance of the reef to pre-battle planning
and the initials assault. The project study area, if it were to stand on its own, can be
characterized as representing the core battlefield boundary (i.e. areas of heaviest fighting), which
are the landing beaches (including 20 ft. into the lagoon) and the immediate areas 300 yards
inshore. A potential national register boundary includes the core area except for Orange 3,
because it was extensively modified post-battle. (Figure 101).
Figure 101. Suggested Battlefield, Core, and Potential National Register Boundary following
2018 fieldwork. Map by Roth/Ships of Discovery Science Team.
134
�Chapter 7: Conclusion
The science team revisited or located 100 sites that represent both WWII specific remains and
modern debris (Appendix 1). The terrestrial survey inshore of the invasion beaches identified 60
artifact scatters, miscellaneous debris, pieces of equipment, or defensive positions (
Table 9). The team revisited 14 archaeological sites previously recorded by Denfeld (1980)
and/or by Knecht, Price, and Lindsay (2012) and identified 11 previously unrecorded sites.
Twenty previously unrecorded sites were located offshore in the reef (Table 7) and an additional
20 were located in the inshore lagoon (Table 8). The UCH offshore include historic anchors,
pontoon barges, aircraft propeller, LVTs, a Caterpillar tractor, and anchor chain. UCH sites in
the lagoon include aircraft remains with radial engine, DUKW remains, LCM remains, and
Sherman tank treads.
Biological characterization of the reefs included high-resolution (mm-scale) 3D reconstructions
at survey sites by collecting overlapping images from planar and oblique angles of reef plots.
Images were collected from six 2x2-m plots at three isobaths (~40fsw, ~20fsw, ~10fsw) at each
survey site (18 plots per site), resulting in 425 reef plots. The plots were located from the base of
the blast zones to the top of the reef flat. Survey plots were also conducted along the same
isobaths at locations that were not affected by blasting during pre-invasion preparation. Three
blast zones were modeled in entirety to create 3D maps and to quantify the geomorphology
produced by these activities.
Orange Beach exhibits the highest levels of coral cover and 3D habitat complexity. Orange
beach is mostly coral dominated, whereas White Barbed Beach was dominated by turf algae. The
differences in benthic habitat slope and water current likely drive these observed differences in
benthic cover. White Beach has a steep slope and receives more wave energy, which likely
impedes the ability of corals to colonize and grow as large and robust as seen at Orange Beach.
Coral cover increases with depth at both Orange Barbed and White Barbed Beaches. Coral
diversity is a strong driver of 3D habitat complexity. This trend was found at both the Orange
and White beaches. These findings indicate that the substantial growth and diversity of corals at
Orange Beach cause a structurally complex habitat with high levels of coral cover. Although the
reefs at Peleliu experienced dramatic changes during the battle of WWII, this study found
significant recovery of corals at Orange Beach, which is most likely because the time frame of
recovery was substantial (74 years).
Five UCH sites were documented by 3D photogrammetry. All sites were found within Orange
Beach in depths of 5 to 110 ft. The benthic communities on the cultural heritage artifacts
consisted primarily of turf algae, coral and crustose coralline algae. After a substantial amount of
recovery time, coral genera Porites, Favia, Isopora, Montipora, Acropora, and Pocillopora have
been able to settle and thrive on these wreck substrates.
The results of the 3D surveys is available for public view at the Multi-scale Environmental
Graphical Analyses (MEGA) Lab University of Hawaiʻi at Hilo on Sketchfab at:
https://sketchfab.com/BurnsLab/collections/peleliu-project.
135
�The side-scan sonar imaged 18 acoustic contacts that were diver investigated; none resulted in
the identification of UCH. The magnetometer results produced 20 anomalies. Of these, 12 were
associated with UCH, 1 is modern, and all were located during the field investigation and
represent clearly distinguishable remains. The seven unidentified isolated anomalies are off the
Orange Beaches, which saw some of the heaviest defensive fire during the invasion. The
defensive fire was so intense that the units tasked with landing on Orange 3 were forced to divert
north and land closer to Orange 2. The nature of these low gamma anomalies suggests small
single-point ferrous metal objects. These types of anomalies are consistent with the historic use
of the area as multiple landing beaches associated with the Battle of Peleliu.
The application of KOCOA analysis to the offshore reef and nearshore invasion beaches
provides additional details of the influence of Japanese defensive positions and preparation on
the invasion. While the larger battlefield has been studied in this manner (Knecht et al 2012),
detailed study of the invasion beaches was not undertaken at that time. This study is the first
application of KOCOA to the invasion beaches in Palau.
The results of this project, when combined with the previous research of Denfeld (1988), Price,
Knecht, Lindsay (2012), and others, provides a more complete picture of the battle for Peleliu.
The information on surviving UCH and information on newly identified sites will contribute to
the Peleliu site inventory and provide baseline information for management of their important
WWII resources. Most importantly, understanding and preserving these sites will serve to
recognize and honor all who lost their lives.
136
�References Cited
Babits, Lawrence, Christopher T. Espenshade, and Sarah Lowry
2011 Battlefield Analysis: Six Maritime Battles in Maryland Revolutionary War and War of
1812. Final Report. New South Associates, Stone Mountain, GA.
Baker, H.D.
1944 Operation Report of Assault and Occupation of Peleliu, 15 September to 20 September
1944. U.S. Navy, Palau, Caroline Islands, October 2. NARA.
Biswas, S.R., and Mallik, A.U.
2010 Disturbance effects on species diversity and functional diversity in riparian and upland
plant communities. Eco, 91: 28-35.
Bronemann, Leroy B.
1982 Once Upon a Tide: Tales from a Foxhole in the South Pacific. Dorrance & Company,
Bryn Mawr, PA.
Burns J, Delparte D, Gates R, Takabayashi M.
2015a Integrating structure-from-motion photogrammetry with geospatial software as a novel
technique for quantifying 3D ecological characteristics of coral reefs. PeerJ 3:e1077
Burns JHR, Delparte D, Gates RD, Takabayashi M
2015b Utilizing underwater three-dimensional modeling to enhance ecological and biological
studies of coral reefs. ISPRS/CIPA Archives, Underwater 3D Recording and Modeling,
Commission V, XL-5/W5
Burke, Richard F.
1944 Report of Action of Underwater Demolition Team SEVEN during Palau Operation. 00644. U.S. Navy, Palau, Caroline Islands, September 22. NARA
Carrell, Toni L., Madeline J. Roth, Jennifer F. McKinnon
2020 Fields of Fire: Researching and Modeling Peleliu’s WWII Invasion Beaches. Prepared
under grant GA-2287-17-015 for the American Battlefield Protection Program. Ships of
Exploration and Discovery Research, Inc., Santa Fe.
Clapuyt, F., Vanacker, V., & Van Oost, K.
2016 Reproducibility of UAV-based earth topography reconstructions based on Structurefrom-Motion algorithms. Geomorphology, 260, 4-15
Davis, Russell
1988 Marine at War. Bantam Books, Toronto, CA.
137
�Denfeld, D. Colt.
1988 Peleliu Revisited An Historical and Archaeological Survey of World War II Sites on
Peleliu Island. Micronesian Archaeological Survey, Report Number 24. Division of
Historic Preservation, Department of Community and Cultural Affairs, Saipan.
Department of the Army
1994 Intelligence Preparation of the Battlefield. Field Manual. US Army, Washington, DC.
Department of the Navy
1945 Skill in the Surf: A Landing Boat Manual. Landing Craft School, Amphibious Training
base, Coronado, California.
Department of the Navy, Bureau of Yards and Docks
1942 N.L. Equipment: Assembly Manual for Pontoon Gear. Navy Department, Washington,
D.C.
1947a Building the Navy’s Bases in World War II: History of the Bureau of Yards and Docks
and the Civil Engineer Corps 1940-1946, Volume I. United States Government Printing
Office, Washington D.C.
1947b Building the Navy's Bases in World War II: Volume II (Part III). United States
Government Printing Office, Washington D.C.
Doane, K. P.
1945 Harbor Construction at Peleliu. The Military Engineer 37(240):414-418.
Fadlallah, Y.H.
1983 Sexual reproduction, development and larval biology in scleractinian corals—a review.
Coral Reefs. 2:129–150. doi: 10.1007/BF00336720.
Fort, G.H.
1944 Report of Amphibious Operation to Capture Peleliu and Anguar. U.S. Navy, Palau,
Caroline Islands, October 16. NARA.
Friedman, Norman
2002 U.S. Amphibious Ships and Craft. Naval Institute Press, Annapolis, MD.
Frye, Lori, and Benjamin Resnick
2013 National Register of Historic Places Registration Form: Ewa Plain Battlefield. National
Register of Historic Places Registration Form. GAI Consultants, Inc., Homestead,
Pennsylvania, December 31.
Gayle, Gordon D.
1996 Bloody Beaches: The Marines at Peleliu. Marines in World War II Commemorative
Series. Diane Pub Co, Darby, PA.
138
�Graham, N.A.J., Jennings, S., MacNeil, M. A., Mouillot, D. & Wilson, S. K.
2015 Predicting climate-driven regime shifts versus rebound potential in coral reefs. Nature.
518, 94–97.
Greenfield, Kent R.
1952 United States Army in World War 2 Pictorial Record: The War Against Japan.
Department of Defense, Department of the Army, Center for Military History,
Washington, D.C.
Halsey, William Frederick, and J. (Joseph) Bryan
1947 Admiral Halsey’s Story. Whittlesey House, New York, NY.
Harrison, P.L.
2011 Sexual reproduction of Scleractinian Corals. In: Dubinsky Z, Stambler N, editors. Coral
Reefs: An Ecosystem in Transition. Springer, Netherlands.
Hough, Frank O.
1950 The Assault on Peleliu. Historical Division Headquarters, U.S. Marine Corps.
Humann, P.
1993 Reef Coral Identification: Florida, Caribbean, Bahamas, 86-116. New World
Publications, Inc., FL.
Hunt, George P.
1946 Coral Comes High. Harper & Brothers, New York, NY.
Hutson, Albert L.
1944 Action Report of Task Unit 32.15.16 in Peleliu Operation. 01-44. U.S. Navy, Tulagi,
Solomon Islands, September 27. NARA.
James, M. R., Robson, S., d'Oleire-Oltmanns, S., & Niethammer, U.
2017 Optimizing UAV topographic surveys processed with structure-from-motion: Ground
control quality, quantity and bundle adjustment. Geomorphology, 280, 51-66
Johnston, James W.
1998 The Long Road of War: A Marine’s Story of Pacific Combat. University of Nebraska
Press, Lincoln.
Knecht, Rick, Neil Price and Gavin Lindsay
2012 WWII Battlefield Survey of Peleliu Island, Peleliu State, Republic of Palau. American
Battlefield Protection Program Grant GA-2255-08-014. National Park Service,
Washington, DC.
Lea, Tom
1988 Battle Stations. Still Point Press, Dallas, TX.
139
�Leon JX, Roelfsema C, Saunders MI, Phinn S
2015 Measuring coral reef terrain roughness using 'Structure-from-Motion' close-range
photogrammetry. Geomorphology. 242: 21–28
Magel, J. M., Burns, J. H., Gates, R. D., & Baum, J. K.
2019 Effects of bleaching-associated mass coral mortality on reef structural complexity across
a gradient of local disturbance. Scientific reports, 9(1), 2512.
McManus, J.W., Reyes Jr, R.B., Nañola Jr C.L.
1997 Effects of some destructive fishing methods on coral cover and potential rates of
recovery. Environmental Management, 21: 69-78.
McEnery, Jim and Bill Sloan
2012 Hell in the Pacific: A Marine Rifleman’s Journey from Guadalcanal to Peleliu. Simon &
Schuster, New York, NY.
McKinnon, Jennifer F., and Toni L. Carrell
2015 Underwater Archaeology of a Pacific Battlefield: The WWII Battle of Saipan. Springer,
New York, NY.
Mescher, K., and Sturgess, A.
2018 Coral Reef Recovery from Hurricane Damage and Implications of Coral Reefs for Future
Medical Discoveries. ScienceDirect.
Montgomery, Alfred E.
1944 Operations Against the Palau Islands: 30-31 March 1944 and Woleai Atoll 1 April 1944.
U.S. Navy, Palau, April 8. NARA.
Moran, Jim and Gordon L. Rottman
2002 Peleliu 1944: The forgotten corner of hell. Osprey Publishing, Oxford, UK.
Mueller, Paul J.
1945 Operation Report 81st Infantry Division: Operation on Peleliu Island 23 September-27
November 1944. Operation Report. U.S. Army.
National Park Service
2016 Battlefield Survey Manual American Battlefield Protection Program. Revised. National
Park Service, Washington, DC.
Naval History and Heritage Command
2019 Naval Pontoon Assembly Detachment. U.S. Seabee Museum, Port Hueneme, CA.
https://www.history.navy.mil/content/history/museums/seabee/explore/seabee-unithistories/pad-wwii.html. Accessed 28 April 2019.
140
�Neushul, Peter
1998 “Andrew Jackson Higgins and the Mass Production of World War II Landing Craft.”
Louisiana History: The Journal of the Louisiana Historical Association 39(2):133-166.
Olive-Drab
n.d.
D-4 Caterpillar Bulldozer. https://olive-drab.com/idphoto/id_photos_d4cat.php. Accessed
17 November 2019.
Phelan, W.C.
1945 Japanese Military Caves on Peleliu “Know Your Enemy.” U.S. Navy, Peleliu, Palau,
Caroline Islands, July 23.
Division of Naval Intelligence, Publication and Distribution Branch
1944 ONI 226 – Allied Landing Craft and Ships. U.S. Government Printing Office.
Rottman, Gordon L.
2004 US WWII Amphibious Tactics Army & Marine Corps, Pacific Theater. Osprey Publishing
Ltd., Oxford.
Rupertus, William H.
1944 Special Action Report: Palau Operation, First Marine Division (REIN). Action Report.
U.S. Marine Corps, Palau, Caroline Islands, October 20.
Sabick, Christopher R., and Joanne M. Dennis
2011 Submerged Battlefield Manual. Lake Champlain Maritime Museum.
Sledge, E. B.
1981 With the Old Breed: At Peleliu and Okinawa. Random House Publishing Group, New
York, NY.
Spennemann, Dirk H.R.
1998 Essays on the Marshallese Past. 2d edition. Albury.
http://marshall.csu.edu.au/Marshalls/html/essays/es-ww2-1.html .
United States Naval Institute
1940 The Bluejackets’ Manual: United States Navy. United States Naval Institute, Annapolis,
Maryland.
United States War Department
1943 TM 9-2800 – Standard Military Motor Vehicles. Technical Manual. 1 September 1943.
Vagts, Alfred
1946 Landing Operations: Strategy, Psychology, Tactics, Politics, From Antiquity to 1945.
Military Service Publishing Company, Washington D.C.
141
�Veron, J., Stafford-Smith, M.G.
2000 Corals of the world. Townsville: Australian Institute of Marine Science
Wright, Jerauld
1944 Operation Report of Assault and Occupation of Peleliu, 15 September to 20 September
1944.
142
�Appendix 1: Summary Table of Sites Revisited or Documented
Site
Number
Denfeld Site
ID
Price/Knecht
Site ID
Description (MOD = Modern)
Ships001
N/A
N/A
Pipe MOD
Ships002
N/A
N/A
Pipe MOD
Ships003
N/A
N/A
End of Pipe MOD
Ships004
N/A
N/A
End of Pipe MOD
Ships005
N/A
N/A
End of Pipe MOD
Ships006
N/A
N/A
Pipe MOD
Ships007
N/A
N/A
Steel Casing MOD
Ships008
N/A
N/A
Pipe MOD
Ships009
N/A
N/A
Metal Plate MOD
Ships010
N/A
N/A
LVT Roller
Ships011
N/A
N/A
Ships012
N/A
N/A
Aircraft Landing Gear Strut
Aircraft Wing, Landing Gear,
Fuselage, and fragments
Ships013
N/A
N/A
Aircraft Radial Engine
Ships014
Ships015
Ships016
N/A
N/A
N/A
N/A
N/A
N/A
Wheel, DUKW
Wheel, DUKW
LVT Tread
Ships017
N/A
N/A
Heavy Duty Cable MOD
Ships018
Ships019
N/A
N/A
N/A
N/A
Tank Tread, Sherman
Bulldozer Bucket
Ships020
N/A
N/A
UXO
Ships021
N/A
N/A
Navy Stockless Anchor
Ships022
N/A
N/A
Anchor MOD
Ships023
N/A
N/A
Pontoon Barge Fragments
Ships024
N/A
N/A
American Aircraft Propeller Blade
143
General Location
Orange Drying
Reef
Orange Drying
Reef
Orange Drying
Reef
Orange Drying
Reef
Orange Drying
Reef
Orange Drying
Reef
Orange Drying
Reef
Orange Drying
Reef
Orange Drying
Reef
Orange Drying
Reef
Orange Drying
Reef
Orange Drying
Reef
Orange Drying
Reef
Orange Drying
Reef
Orange Beaches
Orange Beaches
White Drying
Reef
White Drying
Reef
White Beaches
Offshore Orange
Beaches
Offshore Orange
Beaches
Offshore Orange
Beaches
Offshore Orange
Beaches
Offshore Orange
Beaches
�Site
Number
Denfeld Site
ID
Price/Knecht
Site ID
Description (MOD = Modern)
Ships025
N/A
N/A
Stud Link Anchor Chain
Ships026
N/A
N/A
Metal Scatter w/cable MOD
Ships027
N/A
N/A
Tractor w/blade
Ships028
N/A
N/A
Navy Stockless Anchor
Ships029
N/A
N/A
Ships030
N/A
N/A
Danforth Anchor MOD
Debris Scatter (poss. Pontoon) and
Navy Stockless Anchor
Ships031
N/A
N/A
Concrete Mooring Block MOD
Ships032
N/A
N/A
LVT, Disarticulated
Ships033
N/A
N/A
Iron Rod/Beam MOD
Ships034
N/A
N/A
Steel Cable MOD
Ships035
N/A
N/A
Stud Link Anchor Chain
Ships036
N/A
N/A
LCM
Ships037
N/A
N/A
Anchor MOD
Ships038
N/A
N/A
LVT (Dumpsite)
Ships039
N/A
N/A
LVT (Dumpsite)
Ships040
Ships041
N/A
N/A
N/A
N/A
Ships042
Ships043
Ships044
N/A
N/A
N/A
N/A
Ships045
N/A
Ships046
N/A
N/A
N/A
N/A
N/A
N/A
Site 3
Feature 6
N/A
N/A
N/A
N/A
Site 7
Site 7
LVT (Dumpsite)
Tug Boat MOD
Two Axles w/vehicle debris,
DUKW
Tractor Engine
Debris Scatter (Dumping Area)
Ships047
N/A
N/A
AB219
N/A
AB230
N/A
AB218
AB221
AB220
Aircraft Dump, 100m long
Pontoon from Seabee Dock
C-46 Aircraft Engine Cowling
Pontoon from Seabee Dock
LARC Amphibious Vehicle
Japanese Defensive cave
Japanese Defensive cave
Japanese Defensive Position,
Fuel Barrel Embankment
144
General Location
Offshore Orange
Beaches
Offshore Orange
Beaches
Offshore Orange
Beaches
Offshore White
Beaches
Offshore Orange
Beaches
Offshore Orange
Beaches
Offshore Orange
Beaches
Offshore Orange
Beaches
Offshore Orange
Beaches
Offshore Orange
Beaches
Offshore Orange
Beaches
Orange Beach
Drying Reef
Offshore Orange
Beaches
Offshore Orange
Beaches
Offshore Orange
Beaches
Offshore Orange
Beaches
Orange Beaches
Orange Beaches
Orange Beaches
Orange Beaches
Orange Beaches
Orange Beaches
Orange Beaches
Orange Beaches
Orange Beaches
Orange Beaches
Orange Beaches
North of White
Beaches
�Site
Number
Price/Knecht
Site ID
Description (MOD = Modern)
General Location
Ships048
Denfeld Site
ID
Site 1
Feature 10
N/A
White Beaches
N/A
N/A
AB58
Ships049
N/A
Site 1
Feature 7
Site 1
Feature 6
Site 1
Feature 5
N/A
Site 1
Feature 11
N/A
AB279
Japanese Defensive Structure
American Navy Officer Area,
Tower Foundation
Tracked Vehicle Treads, prob.
Sherman tank
Japanese Defensive Position, Fuel
Drum Embankment
AB280
LVT, partially buried
White Beaches
N/A
N/A
White Beaches
White Beaches
AB60
Ships056
N/A
Site 1
Feature 20
N/A
N/A
AB148
3 Axles with Tires, DUKW
Tractor with blade, beached
Japanese Defensive Structure on
"the Point"
Japanese Defensive Structure on
the road to White Beaches
Japanese Defensive Position, Coral
Ridges and Rifle Pits
Aircraft Dump w/Merlin Engines
and Japanese Tanks
N/A
N/A
Site 1
Feature 12
Site 1
Feature 12
Site 1
Feature 12
N/A
AB268
N/A
Site 1
Feature 1
Site 1
Feature 1
N/A
Site 1
Feature 2
N/A
AB53
Ships066
N/A
Site 1
Feature 3
Ships067
N/A
N/A
Ships068
N/A
N/A
Ships050
Ships051
Ships052
Ships053
Ships054
Ships055
Ships057
Ships058
Ships059
Ships060
Ships061
Ships062
Ships062
Ships063
Ships064
Ships065
AB50
AB55
N/A
N/A
N/A
N/A
AB52.1
AB52
AB54
N/A
N/A
A6M "Zero" Aircraft
Japanese Gun and Defensive
Structure
Japanese Reinforced Defensive
Cave
Japanese Defensive position, Gun
Housing
Amphibious Vehicle Sprocket
Japanese Defensive Position, Fuel
Drum Embankment
Japanese Defensive Cave,
Structure, and Gun
Japanese Defensive Structure and
Gun
Japanese Defensive Cave
Japanese Defensive Position,
Observation Platform
Japanese Defensive Cave,
Collapsed
Concrete Slab and Boulders
Engine Block from amphibious
vehicle
Japanese Gun, assoc. with
Ships069
145
White Beaches
White Beaches
White Beaches
White Beaches
White Beaches
White Beaches
Orange Beaches
Inshore Orange
Beaches
White Beaches
White Beaches
White Beaches
White Beaches
White Beaches
White Beaches
White Beaches
White Beaches
White Beaches
White Beaches
Orange Beaches
Orange Beaches
Orange Beaches
�Site
Number
Denfeld Site
ID
Price/Knecht
Site ID
Description (MOD = Modern)
Pipe Fixture on Concrete Mount
N/A
assoc. w/Ships068
Ships069
Ships070
N/A
Site 3
Feature 1
Ships071
Ships072
N/A
N/A
N/A
N/A
Ships073
Ships074
Ships075
Ships076
Ships077
Ships078
Ships079
Ships080
Ships081
Ships082
N/A
N/A
N/A
N/A
N/A
N/A
N/A
N/A
N/A
N/A
N/A
N/A
N/A
N/A
N/A
N/A
N/A
N/A
N/A
N/A
Ships083
Ships084
N/A
N/A
N/A
N/A
Ships085
N/A
N/A
Ships086
Ships087
Ships088
N/A
N/A
N/A
N/A
N/A
N/A
Ships089
Ships090
Ships091
Ships092
N/A
N/A
N/A
N/A
N/A
N/A
N/A
N/A
Ships093
Ships094
Ships095
N/A
N/A
N/A
N/A
N/A
N/A
Ships096
Ships097
Ships098
Ships099
Ships100
N/A
N/A
N/A
N/A
N/A
N/A
N/A
N/A
N/A
N/A
N/A
Japanese Defensive Structure
Octagonal Platform, w/trapezoidal
monument
Memorial Pedestal MOD
Concrete Box-like structure,
collapsed
Iron debris MOD, approx. 4 sq. m
Tractor, disarticulated, degraded
Tug, poss. Japanese MOD
Iron Buoy MOD
Vehicle Debris
Vehicle Debris
Disarticulated Concrete Structure
Iron Debris, poss. dock or pontoon
Engine Block
Japanese Low Defensive Position,
Poured Concrete
Tower Foundations, set of 4
Japanese Defensive Trenches and
American Dump
Japanese Defensive Position with
Gun Mount
Tank Base, iron
Single Aluminum Frag prob. MOD
Cement Marker, poss. memorial
MOD
Concrete Foundation
Iron frame, highly degraded MOD
Concrete Foundation
Metal Scrap and Debris scatter,
approx. 15m long
Engine Block w/debris scatter
Japanese defensive structure
Concrete Foundation w/trapezoidal
monument, set of 5
Concrete Foundation
Concrete Slab with Boilers
Concrete Foundation
Concrete Foundation
146
General Location
Orange Beaches
Orange Beaches
Orange Beaches
Orange Beaches
Orange Beaches
Orange Beaches
Orange Beaches
Orange Beaches
Orange Beaches
Orange Beaches
Orange Beaches
Orange Beaches
Orange Beaches
Orange Beaches
Orange Beaches
Orange Beaches
Orange Beaches
Orange Beaches
Orange Beaches
Orange Beaches
Orange Beaches
Orange Beaches
Orange Beaches
Orange Beaches
Orange Beaches
Orange Beaches
Orange Beaches
Orange Beaches
Orange Beaches
Orange Beaches
Orange Beaches
Orange Beaches
�
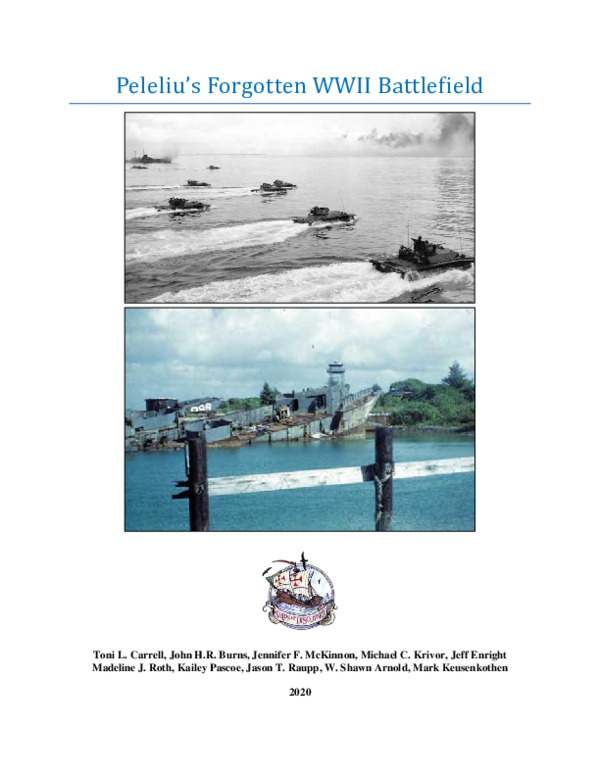
 W. Shawn Arnold
 Jennifer McKinnon
 Toni Carrell