Jurnal Ekonomi Malaysia 53(3) 2019 59 - 74
http://dx.doi.org/10.17576/JEM-2019-5303-5
Determinants of Bank Efficiency: Evidence from Regional Development Banks
(Penentu Kecekapan Bank: Bukti daripada Bank Pembangunan Wilayah)
Lutfi
STIE Perbanas Surabaya
Suyatno
STIE Perbanas Surabaya
ABSTRACT
This study examines the technical efficiency level of regional development banks (RDBs) in Indonesia and then
analyzes the influence of bank-specific factors on this efficiency. This study uses data from all 25 conventional RDBs
in Indonesia for the period 2012–2017 and a two-stage procedure to examine bank efficiency. Data Envelopment
Analysis (DEA) is used to estimate bank technical efficiency and panel data techniques, both fixed effects (FE) and
random effects (RE), are used to assess the determinants of bank efficiency. The results of this study indicate that most
Indonesian RDBs have yet to become efficient. The most important source of their inefficiency is non-interest income.
Furthermore, bank efficiency is positively influenced by capital and the loan-to-deposit ratio, while it is negatively
affected by non-performing loans and the proportion of time deposits. There is also evidence that bank size has
a U-shaped influence on efficiency. This study recommends that RDBs should increase the capital in improving its
fee-based income through the development of innovative technology-based products and services. RDBs also need
to optimize their use of depositors’ funds for lending coupled with prudential principles to avoid problematic loans.
Keywords: Technical efficiency; Data Envelopment Analysis (DEA); regional development bank
ABSTRAK
Kajian ini memeriksa tahap kecekapan teknikal bank pembangunan wilayah (RDBs) di Indonesia dan menganalisis
pengaruh faktor khusus bank terhadap kecekapan tersebut. Data kajian ini terdiri daripada semua 25 buah bank
pembangunan wilayah konvensional di Indonesia untuk tempoh 2012-2017 dan prosedur dua peringkat telah
digunakan untuk memeriksa tahap kecekapan bank tersebut. Kaedah Analisis Pengumpulan Data (DEA) telah
digunakan untuk menganggar kecekapan teknikal bank, manakala kaedah data panel iaitu kesan tetap (FE) dan kesan
rawak (RE) digunakan untuk menganggar penentu kecekapan bank tersebut. Hasil kajian menunjukkan kebanyakan
RDBs di Indonesia belum mencapai kecekapan. Sumber utama kepada ketidakcekapan RDBs adalah pendapatan
bukan faedah. Tambahan lagi, kecekapan bank secara positif dipengaruhi oleh modal dan nisbah pinjaman kepada
deposit, manakala pinjaman tidak berbayar dan kadar deposit bermasa mempunyai pengaruh negatif kepada
kecekapan bank. Selain itu, dapatan kajian juga mendapati saiz bank mempunyai pengaruh yang berbentuk U
terhadap kecekapan bank. Kajian ini mengesyorkan bahawa RDBs perlu meningkatkan modal untuk mengukuhkan
pendapatan berasaskan yuran melalui pembangunan produk dan perkhidmatan yang berasaskan teknologi inovatif.
RDBs juga perlu mengoptimumkan penggunaan dana pendeposit dengan memberikan pinjaman secara berhemat
untuk mengelakkan pinjaman bermasalah.
Kata kunci: Kecekapan teknikal; Analisis Pengumpulan Data (DEA); bank pembangunan wilayah
INTRODUCTION
In terms of ownership, Indonesian commercial banks
are grouped into state-owned banks, private banks,
foreign banks, joint venture banks and regional
development banks (RDBs). The contribution of RDBs
to the Indonesian economy is relatively small, as
reflected in the proportion of their assets and third-party
deposits compared to the total value of the Indonesian
banking industry, namely 8.19 percent and 8.49 percent,
respectively. The contribution made by this group of
banks to micro, small and medium business loans, which
is the main function of RDBs, is even smaller, at only
7.97 percent (Keuangan 2018b).
Another problem faced by RDBs relates to their
ownership structure. In general, almost 100 percent of
the shares in RDBs are owned by local governments, at
both the provincial and district levels (Keuangan 2018a).
Ownership by local government is often considered
to lead to bank inefficiency due to intervention
from governors and deputy governors, regents, and
deputy regents and members of the local parliament.
60
These political interventions can result in RDB s
being less efficient, thus making it more difficult
for them to compete with other commercial banks
(Hadad et al. 2012).
Many RDBs face problems arising from high nonperforming loans (NPLs). The average NPL rate of an
RDB in 2017 stood at 3.23 percent. This rate exceeds
those of both the state-owned and private banks, which
stand at 2.50 percent and 2.80 percent respectively
(Keuangan 2018b). This is in contrast to RBD credit
growth, although this is also below that of the other
sectors of the banking industry. RDB credit growth is
only 9.09 percent while the rates of state-owned banks
and private banks are 11.55 percent and 13.58 percent
respectively (Keuangan 2018b). This could indicate
that RDBs are experiencing difficulties in channeling
productive and profitable loans.
In the 2015 Otoritas Jasa Keuangan ( OJK), the
Indonesian Financial Authority, Annual Report, it was
mentioned that one of OJK’s focuses for 2015 was the
implementation of the Regional Development Bank
Transformation program with the aim of transforming
RDB s into competitive banks with strong rates of
growth and a role to play in the regional economy.
However, no single RDB has been successful in
meeting all of the transformation program targets due
to a range of fundamental problems, including weak
competitiveness and governance (Keuangan 2016). One
way of improving competitiveness and governance is to
improve efficiency by optimizing internal bank factors.
For this reason, RDB efficiency is a very interesting
area to study and seek to identify the internal factors
that affect the level of RDB efficiency. Increasing the
efficiency of these banks will help both the central
and local governments to achieve the transformation
program targets.
Studies on bank efficiency in Indonesia have so
far been dominated by commercial banks in general
and have tended to focus more on the level of bank
efficiency without further examining the determinants
of that level of efficiency (Hadad et al. 2012; Hadad
et al. 2003a; Kurnia 2004; Muharam 2007; Ferari &
Sudarsono 2011; Omar et al. 2007; Kalis et al. 2012;
Pramuka 2011; Sadalia & Kautsar 2018). Using Data
Envelopment Analysis ( DEA ), Omar et al. (2007)
stated that in 2004, the level of technical efficiency of
commercial banks in Indonesia, for both conventional
and Sharia banks, was still low, at 86 percent. Using
the same approach, Kalis et al. (2012) showed that
the level of efficiency of RDBs was lower than that
of state-owned banks. Pramuka (2011) used the DEA
approach to assess the efficiency of Islamic banks and
found that bank efficiency levels tended to increase
from 2003 to 2009, from 88 percent to 99 percent. On
the other hand, Sadalia and Kautsar (2018) used the
Stochastic Frontier Analysis (SFA) approach to assess
the level of technical efficiency of banks in Indonesia
Jurnal Ekonomi Malaysia 53(3)
and found that conventional and Islamic commercial
banks in Indonesia were inefficient, with an efficiency
rate of 84 percent for conventional banks and 85
percent for Islamic banks. Wardhani and Mongid (2019)
focused on assessing the efficiency of Islamic banks in
Indonesia using the SFA approach and found the level
of efficiency of Islamic banks to be in the low and
medium range.
Two published studies have examined the level of
efficiency of RDBs in Indonesia. Sutanto (2015) used
DEA and found the RDBs to have a technical efficiency
level of 93 percent in 2013. Abidin and Endri (2010)
added that the efficiency level of larger-scale RDBs
was better than that of smaller banks. Lastly, Defung
et al. (2016) stated that RDBs had lower technical
efficiency than both state-owned and private banks
in Indonesia.
As stated earlier, there is a lack of research
examining the level of bank efficiency in Indonesia and
then analyzing the determinants of that bank efficiency.
No articles have been published that comprehensively
review the efficiency level of RDBs at the same time
as examining the determinants. Widiarti et al. (2015)
was the only study to have examined the level of
efficiency of commercial banks in Indonesia using the
DEA approach and then analyze its determinants. They
studied bank efficiency during the period 2012–2014
and revealed that it was positively affected by bank size
and capital, and negatively affected by NPL and the cost/
efficiency ratio.
Based on the explanation above, this study aims to
examine the level of efficiency of RDBs in Indonesia and
then analyze the determinants of that efficiency using the
DEA approach. Previous studies have revealed RDBs to
have the lowest technical efficiency compared to other
bank groups, namely state-owned banks and private
banks (Hadad et al. 2003b; Defung et al. 2016). By
reviewing the level of efficiency of regional banks and
further examining the determinants of that efficiency,
this research can provide input policies for regional
governments as the owners and management of regional
banks in order for them to take the actions needed to
improve the efficiency of regional banks, especially
in lending. This research also adds a reference to the
study of RDB, which has suffered from a relative lack
of research attention (Abidin and Endri 2010; Defung
et al. 2016; Sutanto 2015). This study uses DEA to
analyze bank technical efficiency as this approach does
not require any explicit specification of the functional
form and requires only a few structures to form its
efficiency frontier. This study then uses the estimated
technical efficiency generated by DEA as the dependent
variable in the panel data regression model. Both
fixed effects (FE) and random effects (RE) panel data
techniques are used to examine the factors influencing
technical efficiency.
Determinants of Bank Efficiency: Evidence from Regional Development Banks
LITERATURE REVIEW
BANK EFFICIENCY AND DATA ENVELOPMENT ANALYSIS
Efficiency is one of the performance parameters that
theoretically underpins the entire performance of an
organization. The ability to produce the maximum
amount of output from an existing input is a measure
of performance expected by any company. A company
is faced with the issue of either trying to obtain an
optimal level of output with existing input levels or
using a minimum level of input to generate a certain
level of output. By identifying the allocation of inputs
and outputs the firm can go further to see the causes
of inefficiency.
The methods of efficiency measures can be grouped
into two main categories, namely parametric and nonparametric (Jarzebowski 2013; Casu et al. 2004; Resti
1997; Dong et al. 2014). Each type of approach aims to
estimate the frontier that represents the best practice of the
system. The estimated frontier is used as a benchmark for
a company against all other companies. In the parametric
approach, measurements are made using stochastic
econometrics and seek to eliminate the interference
from inefficiency influences. There are three parametric
approaches, namely SFA, the Thick Frontier Approach
(TFA) and the Distribution-Free Approach (DFA). The
non-parametric approach is built on the findings and
observations of the population and evaluates the relative
efficiency of the observed units. The non-parametric
approach consists of DEA and Free Disposal Hull (FDH).
This type of approach requires accurate information on
the price of inputs and sufficient samples in addition
to the recognition of the proper functional form of the
frontier and the structure of a one-sided error. While the
non-parametric approach does not require as much in
the way of information, samples or other assumptions.
However, the two approaches generally do not produce
remarkably different results in terms of identifying the
factors that determine a bank’s technical efficiency (Casu
et al. 2004).
There are two basic model classifications in DEA
analysis, i.e. input-oriented and output-oriented models
(Farrell 1957). The purpose of the input-oriented
method is to evaluate how much the input quantity can
be reduced proportionally without changing the amount
of output. While the output-oriented method is used to
assess how much the amount of output can be increased
proportionally without changing the number of inputs
used. Charnes et al. (1978) proposed an input-oriented
model using constant returns to scale (CRS) and Banker
et al. (1984) proposed an input-oriented model using
variable returns to scale (VRS). Both input- and outputoriented models will give the same result for CRS and
different results for VRS (Färe & Lovell 1978).
The true value of technical efficiency is not directly
observed; rather, it is estimated. Previous studies have
61
examined the appropriate inputs for DEA applications
in the banking industry. Some of the outputs that are
currently widely used are total loans (Chen & Yeh 1998;
Diallo 2918; Howland & Rowse 2006; Sufian & Noor
2009; Wu et al. 2006; Golany & Storbeck 1999; Resti
1997; Felix et al. 1998), interest income and non-interest
income (Felix et al. 1998; Sakar 2006; Mukherjee et al.
2002; Sathye & Sathye 2017). Total loans and interest
income are very appropriate measures of output to use
in determining the technical efficiency of RDBs as their
income is dominated by loan disbursement, which carries
an income generation capacity. Non-interest income,
as one of the outputs in the DEA model, can be used to
show the extent to which RDBs are starting to shift their
business from traditional lending to more fee-based
income activities.
One of the most commonly used inputs in DEA in the
banking industry is number of employees or employee
costs (Mukherjee et al. 2002; Sufian & Noor 2009;
Wu et al. 2006; Golany & Storbeck 1999; Chen & Yeh
1998; Seiford & Zhu 1999; Felix et al. 1998; Favero
& Papi 1995; Resti 1997). Employee expenses may be
preferable for two reasons. First, data are available more
publicly. Second, since the outputs are measured in units
of currency, the inputs should be expressed in similar
terms. The second type of input is third-party deposits,
which cover current accounts, savings accounts and time
deposits (Bannour et al. 2918; Diallo 2018; Mokhtar
et al. 2008; Sakar 2006; Zenios et al. 1999; Felix et al.
1998; Fukuyama 1993). The final commonly used input
in DEA is fixed assets, including available space (Bannour
et al. 2018; Diallo 208; Golany & Storbeck 1999; Sufian
& Noor 2009; Zenios et al. 1999; Al-Faraj et al. 1993;
Vassiloglou & Giokas 1990; Hassan et al. 2009). The
use of fixed assets as a DEA input is considered very
appropriate in the context of measuring RDB efficiency,
for two main reasons. First, RDBs generally operate in one
province and should cover up to the sub-district level,
which means they require a large number of physical
branches and cash offices. Second, the customers of RDBs
generally comprise rural and suburban communities who
prefer to meet directly with bank employees as opposed
to using technological devices and channels such as
mobile banking.
Many studies have turned to the DEA approach to
examine the level of bank efficiency around the world and
most have settled on using the intermediation approach
(Bonin et al. 2005; Jemric & Vujcic 2002; Staub et al.
2010; Sathye 2003; Karray & Chichti 2013; Li et al.
2019; Gardener et al. 2011; Sathye 2001; Miller &
Noulas 1996). Gardener et al. (2011) showed that bank
efficiency in South East Asian countries (Indonesia,
Malaysia, the Philippines, Thailand, and Vietnam) fell
significantly over the period from 1998 to 2004. Miller
and Noulas (1996) also identified a reduction in bank
efficiency using data from large US banks in the period
1984–1990. Staub et al. (2010) found Brazilian banks to
62
Jurnal Ekonomi Malaysia 53(3)
have lower efficiency compared to banks in Europe and
the US. Havrylchyk (2006), on the other hand, found no
improvement in Polish bank efficiency during the period
1997–2001. In addition, Havrylchyk (2006) and Staub
et al. (2010) found that foreign-owned banks had better
efficiency than local private banks, while Gardener et al.
(2011) reported that state-owned banks had better
efficiency than private banks.
Empirical evidence from the Indonesian banking
industry has revealed a slight improvement in bank
efficiency over time (Novandra 2017; Sufian & Noor
2009). Indonesian banks had the lowest technical
efficiency compared to their counterpart country banks
in Malaysia, the Philippines, Thailand and Vietnam
(Gardener et al. 2011). Efficiency at RDBs was lower
in comparison to that at both state-owned and private
banks (Defung et al. 2016; Hadad et al. 2003a). In
addition, foreign-owned banks have been cited as the
most efficient bank group (Hadad et al. 2003a). Islamic
banks, meanwhile, were found to be more efficient than
conventional banks (Rosyadi 2017; Novandra 2017).
DETERMINANTS OF BANK TECHNICAL EFFICIENCY
Many bank-specific factors influence bank efficiency. The
first factor that greatly affects the level of bank efficiency
is the size of the bank. This is reflected by total assets
and is a very commonly used variable in research on
bank efficiency. The basic consideration with regard to
the use of bank size is to determine whether the sample
banks reflect economies of scale. The concept is that an
increase in a bank’s assets can generate an increase in
the efficiency level (Hughes et al. 2001; Pasiouras 2008;
Pavkovic’ et al. 2018; Perera et al. 2007; Altunbas et al.
2000). Economies of scale theory state that when a
company grows in size, its operating costs per unit will
decrease. This decline in operating costs is based on
achieving lower production costs per unit due to the fact
that the costs of production can be spread over a higher
volume of production (output). Other studies, however,
have found that the relationship between bank size and
technical efficiency is not always positive; instead, it
tends to be U-shaped (Karray & Chichti 2013; Hadad
et al. 2013; Sapci & Miles 2019). While an increase
in asset size improves bank efficiency initially, after
reaching a certain point, the increase may actually lead
to lower bank efficiency.
NPLs are another factor that influences a bank’s
level of technical efficiency. Given that approximately
90 percent of bank assets are embedded in credit, NPLs
reflect not only credit quality but also asset quality as a
whole. Banks with high NPLs must allocate substantial
extra managerial effort and expense to the handling
of these problem loans (Karim et al. 2010). The costs
related to handing problem loans include the legal costs
associated with the settling of NPLs both inside and
outside court; employee expenses incurred in handling
the administration, monitoring and collection of problem
loans, as well as costs associated with the taking over,
maintenance and disposal of the loan collateral; and the
management cost associated with the additional time and
effort expended by management to handle the problem
loans. These incremental costs due to problem loans
will reduce the bank’s operational efficiency (Kwan &
Eisenbeis 1996; Partovi & Matousek 2019; Rajaraman
& Vasishtha 2002; Tan & Floros 2013). High NPLs can
also lower bank efficiency as the banks are required to
allocate additional capital to cover such risks, thereby
limiting their degree of credit expansion and subsequent
interest income, which are the outputs in DEA efficiency.
Capital plays an important role in determining bank
efficiency. In addition to acting as a buffer against the
risk of financial and operational losses, capital is useful
for providing resources for the development of new
products, services, facilities, and expansion as well as for
increasing public confidence and convincing creditors,
especially depositors, of the soundness of banks (Rose
& Hudgins 2013). The availability of large amounts of
capital will enable banks to increase lending without
worrying too much about not being able to assume the
risk of losses incurred. This credit expansion can further
increase interest income. The high trust of depositors
can encourage them to entrust their funds in the bank
without requiring high returns, thus lowering the cost
of bank funds. Thus, the amount of capital can improve
the technical efficiency of banks (Altunbas et al. 2000;
Karim et al. 2010).
The loan-to-deposit ratio (LDR) can affect bank
efficiency from both sides, namely the outputs and inputs.
Loan disbursement is the main activity of Indonesian
banking, as reflected in the fact that around 92 percent
of third-party funds disbursed are in the form of credit
(Keuangan 2016). The higher the LDR, the greater the
proportion of funds disbursed as credit, thus potentially
generating greater levels of interest income and
enhancing bank profitability (Gul et al. 2011; Molyneux
& Thornton 1992; Dietrich & Wanzenried 2011; Anbar
& Alper 2011). On the lending side (outputs), LDR is a
source of potential growth (Caprio et al. 2007). Thus,
LDR has a positive impact on improving bank efficiency.
Another important factor affecting a bank’s
efficiency is the Net Interest Margin (NIM). NIM reflects
the spread between the interest earned on the loan and
the interest paid on the source of the funds. A high NIM
may indicate that the bank imposes high borrowing costs
on debtors, which can lead to the bank encountering
difficulties in lending. The debtors willing to borrow at
such rates tend to be those with poor creditworthiness,
thereby increasing the number of problem loans (Sinkey
& Greenawalt 1991; Salas & Saurina 2002). This
ultimately lowers bank efficiency (Kwan & Eisenbeis
1997; Berger & DeYoung 1997).
The composition of deposits (CoD) reflects the
proportion of each form of third-party funds, comprising
Determinants of Bank Efficiency: Evidence from Regional Development Banks
demand deposits, savings deposits, and time deposits. In
this study, CoD is the ratio of time deposits to total thirdparty funds, which is about 45% in Indonesia (Keuangan
2016). Time deposits are the most expensive source of
funds among other third-party funds. The greater the level
of time deposits, the greater the operational expenses
borne by banks. Therefore, CoD can have a negative
effect on bank technical efficiency.
Some researchers have examined the determinants
of bank technical efficiency in Indonesia. Muazaroh et al.
(2012) used the SFA approach and found that bank profit
efficiency was positively influenced by bank size, capital,
foreign ownership, and market share and negatively
influenced by listing on the stock exchange. Widiarti et
al. (2015) used the DEA technical efficiency approach and
the panel data common effects approach during the period
2012–2014 and found that bank technical efficiency
was positively affected by bank size and capital, and
negatively affected by NPL and the cost/efficiency ratio.
This research is different from Widiarti et al. (2015)
in many ways. First, this study covers a longer period,
namely 2012–2017, so it is expected to better describe
the condition of banks in Indonesia in various economic
conditions. Second, this study specifically examines RDBs
that have particularities in terms of ownership and the
involvement of local governments in their management.
Third, this study adds the variable CoD based on the
consideration that the greater the composition of bank
funds from time deposits, the higher the cost of funding
will be. This will further reduce the ability of banks to
extend credit and generate interest income. Finally, this
study uses panel data analysis techniques, including
both FE and RE approaches. These approaches consider
variations in the bank intercept and therefore are more
Stage I
Estimating DEA-Based Efficiency
63
appropriate when analyzing data consisting of many
banks and time series.
RESEARCH METHODOLOGY
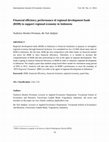
This study uses a two-stage DEA procedure. The first step
is to estimate regional bank technical efficiency using the
DEA approach. The second step is to use the estimated
efficiency results of DEA as the dependent variable to
determine the factors influencing estimated efficiency
using the panel data regression model. The research
framework is presented in Figure 1.
DATA ENVELOPMENT ANALYSIS
Basically, DEA attempts to minimize inputs and maximize
outputs. It permits the use of multiple inputs and outputs.
The DEA model is based on output-oriented VRS and
can be expressed in terms of a ratio as follows (Charnes
et al. 1978).
s
Σ UrYr,0
r=1
Max TE0 = –––––––
m
Σ ViXi,0
(1)
i=1
Subject to:
s
Σ UrYr,j
r=1
–––––––
≤ 1; j = 1, 2, ..., n
m
Σ ViXi,j
i=1
UrVi ≥ 0; r = 1, 2, ..., s; i = 1, 2, ..., m
Stage II:
Analyzing the Determinants of
DEA-Based Efficiency
Input Variables:
1. Fixed Assets
2. Employee Costs
3. Total Deposits
Independent Variables
Size
NPL
CAR
Intermediation
Approach
DEA Efficiency
LDR
NIM
Output Variables:
1. Total Loan
2. Interest Income
3. Non-Interest Operating
Income
FIGURE 1. Research Framework
CoD
(2)
64
Jurnal Ekonomi Malaysia 53(3)
Measurement of the total efficiency ( TE) of a
decision-making unit ( DMU) is obtained using the
weighted maximum ratio output to weighted input for
that unit, subject to conditions that are similar for all other
ratios. This results in an efficiency score for DMUs of less
than or equal to one. Yr,j and Xi,j are DEA outputs and inputs
that are all positive, and Ur and Vi are unknown variable
weights. The outputs of the DEA model are a total loan,
interest income, and non-interest operating income. While
the inputs of the DEA model are fixed assets, employee
costs, and total deposits. All output and input variables
are in rupiahs.
Under the DEA approach, a bank is considered
efficient if it cannot improve its output or reduce its
input without increasing other inputs or decreasing
other outputs, and therefore efficient banks have an
efficiency score of unity or 100 percent (Chen & Yeh
2000; Vincova 2005). In other words, if the DMU has
an efficiency score of 1 then it is considered efficient
in DEA, otherwise, it is inefficient (Bannour et al. 2018;
Sathye 2001).
The DEA approach has several advantages, namely
that it requires less data, fewer assumptions are required
and fewer samples are used (Hadad et al. 2003a; Dong
et al. 2014). It does not include random error, therefore
the result of inefficiency is only used as a factor of
inefficiency by the DMUs. DEA is able to identify the
source and magnitude of inefficiencies in each input and
output for each unit as well as identify which units can be
used as benchmarks by other inefficient units (Hawdon
2003; Cook et al. 2014). DEA is also more appropriate
for use in developing countries where regulation and
market imperfections can disrupt input and output prices
(Mostafa 2011). Thus, this non-parametric approach can
be used to measure inefficiencies more generally and is
therefore more widely used to measure banks’ technical
efficiency (Akhtar 2010; Miller & Noulas 1996; Sathye
2001; Haslem et al. 1999; Al-Khasawneh et al. 2012;
Mostafa 2011; Sufian & Noor 2009). This study uses
Banxia Software version 4.40 (FAPE1-1500 Academic)
to calculate bank technical efficiency.
PANEL DATA REGRESSION MODEL
After estimating bank technical efficiency using the
model, the next step is to use the estimated DEAbased total efficiency (TE) as the dependent variable.
The second step involves analyzing the determinants
of the estimated technical efficiency using panel data
techniques. Panel data techniques can improve statistical
analysis by controlling heterogeneity, reducing
collinearity between variables and explaining dynamic
changes better than time-series and cross-sectional
data analysis (Gujarati and Porter, 2009). This study
examines the panel data model that includes the pooled
regression (PR), FE and RE models. In the PR model, all
DEA
coefficients are constant over time and individually. In
general, the PR model is:
Yit = α + βXit + μit
(i = 1,…, N;t = 1, …, T) (3)
where i represents cross-sections (banks ) and t represents
time periods. α is a scalar, β is K × 1 matrix, and it is
the it-th observation on K explanatory variables. N is
the number of cross-section units and T is the number
of periods. The error term is µit and it is identically
distributed with zero mean and constant variance.
Therefore, the weakness of the PR model is that it ignores
the specific nature of each cross section. This weakness
can be overcome by using the FE model, in which the
specifications include unit-specific components:
Yit = (α + γi) + βXit + μit (i = 1, …, N; t = 1, …, T) (4)
where is an unobserved specific effect in which is a part
of constant, and X and are correlated. To consider the
intercepts vary among cross-sections, we can use the
dummy variable technique, known as the Least Square
Dummy Variable (LSDV) methodology. Equation (4) can
then be rewritten as follows:
Yit = α1 + α2D2i + α3D3i + … + αNDNi + βXit + μit
(5)
In the LSV approach, the unobserved time effect is
obtained by including a set of N – 1 dummy variables
that are homogeneous across cross-sections but vary
over time. Di is the dummy variable for unit i; D21 = 1
for unit 1, 0 otherwise; D31 = 1 for unit 2, 0 otherwise;
and so on.
FE assumes that any differences among the crosssections can be accommodated from differences in their
intercepts. However, the FE model may have weaknesses
because the time-invariant effect and its coefficients
cannot be identified. Both cross-section and time
variables can be included in the intercepts vary over the
individuals and time. The RE model incorporates time
invariants into the model as follows:
Yit = α + βXit + γi + μit (i = 1, …, N ; t = 1, …, T) (6)
In the random effect model, there are two residual
components. The first, µit, is the overall residual which
is a combination of cross-section and time series. The
second residual, γi, is an individual residual which is a
random characteristic of the i-th unit observation and is
homogeneous over time. In equation (6), α is represented
as the mean value of all cross-sectional intercepts
and the error component Zi indicates the deviation of
individual intercepts from the mean value. Components
of individual errors are assumed to be uncorrelated with
each other and not correlated across units. Therefore, the
random error Zi is homogeneous over time but differs
across sections.
This study uses EViews Software to test the
hypothesis. The Chow test was conducted to determine
the choice between PR and FE as the correct model to
use. If Prob. ≥ 0.05, the PR model is more appropriate,
Determinants of Bank Efficiency: Evidence from Regional Development Banks
otherwise, the FE model is more appropriate. The
Hausman test was used to determine whether the FE or
RE model is the appropriate option. If Prob. ≥ 0.05, the
RE model is more appropriate for use, otherwise, the FE
model is more appropriate.
The empirical model of this study can be expressed
as follows:
TEit = β0 + βilSizeit + β2NPLit + β3CARit + β4LDRit
+ β5NIMit + β6CoDit + εit
(7)
where the subscripts i and t indicate banks and time
in years, respectively, TE is the DEA estimated of total
efficiency, Size is the log-normal of total assets, NPL is
non-performing loans, CAR is the capital adequacy ratio,
LDR is the loan-to-deposit ratio, NIM is the net interest
margin and CoD is the composition of deposits, and
ɛ is the error terms. The effect of bank size on bank
efficiency is U-shaped. The increase in assets initially
leads to an increase in the level of bank efficiency due to
economies of scale (Pasiouras 2008, Perera et al. 2007).
However, after reaching a certain point, the increase in
assets then actually reduces the efficiency of the bank
due to various problems of coordination, monitoring,
and delays in decision making caused by the increasing
number of branches and employees (Hadad et al. 2013;
Karray & Chichti 2013). NPLs will incur additional costs
in the form of legal fees, administrative costs, monitoring
costs and the maintenance and disposal of collateral, as
well as the management time and effort needed to handle
the problem loans. This means that an increase in NPLs
will reduce the level of bank efficiency (Rajaraman &
Vasishtha 2002; Tan & Floros 2013; Kwan & Eisenbeis
1996). Capital is the main resource that banks use to
expand credit and provide banking services that can
increase interest income. The availability of capital will
also increase depositors’ confidence to place their funds
in banks without demanding a relatively high interest
rate, which will reduce the cost of sources of funds.
Thus, the greater the capital, the higher the level of bank
efficiency (Altunbas et al. 2000, Karim et al. 2010). LDR
reflects the proportion of third-party funds channeled
into loans. The greater the LDR, the greater the potential
interest income generated, thereby increasing bank
efficiency (Anbar & Alper 2011; Dietrich & Wanzenried
2011; Gul et al. 2011; Molyneux & Thornton 1992). A
high NIM indicates that banks charge high interest to
debtors, which can make it difficult for banks to channel
credit and subsequently reduce their interest income.
Thus, NIM has a negative effect on efficiency (Berger
& DeYoung 1997; Kwan & Eisenbeis 1997; Salas &
Saurina 2002; Sinkey & Greenawalt 1991). Finally,
CoD is the proportion of time deposits to total thirdparty deposits. Time deposits are the most expensive
source of funds from third parties, which means that
the greater the composition of time deposits, the lower
the level of bank efficiency.
65
SAMPLE AND DATA
The sample of this research comprises 25 conventional
RDBs, from 2012 to 2017. There are actually 26 RDBs
in Indonesia; however, one has been an Islamic bank
since 2016 and was therefore excluded from this study.
The bank-related data were obtained from the website
of the Financial Services Authority and the Association
of Regional Development Banks (ASBANDA). Table 1
lists the sample banks, along with their total assets, core
capital, and book category.
Based on Bank Indonesia Regulation No. 14/26/
PBI/2012, the banks are categorized into four groups based
on their core capital, namely Book 1, Book 2, Book 3 and
Book 4. Book 1 banks may only engage in the collection
and distribution of funds arising from basic products or
activities in rupiahs, trade financing activities, a limited
range of activities for agency and cooperation, and
payment system and electronic banking activities. Book
1 banks can only engage in restricted foreign exchange
activities as a foreign exchange trader. Book 2 banks
may engage in a wider range of products or activities
than Book 1 banks, in both rupiahs and foreign currency,
limited treasury activities covering spot and plain vanilla
derivatives, and they may have a participation of 15%
in domestic financial institutions. Book 3 banks may
conduct all business activities in rupiahs and foreign
currency and have up to a 25% participation level in
domestic and Asian financial institutions. Book 4 banks
may conduct all business activities in rupiahs and foreign
currency and have a 35% participation in both domestic
and international financial institutions. The table reveals
that most RDBs fall into the Book 1 and Book 2 categories.
The implication of this is that they have a limited scope
of operations.
RESULTS AND DISCUSSION
BANK EFFICIENCY
In this study, a bank’s technical efficiency is calculated
using the DEA method based on output-oriented VRS. A
bank is classed as efficient if it has an efficiency score of
100 percent (Vincova 2005; Chen & Yeh 2000; Sathye
2003). Thus, a bank with an efficiency score of less than
100 percent is categorized as inefficient. Table 2 presents
the development of Indonesian regional banks’ efficiency
from 2012 to 2017, with the rankings based on their total
technical efficiency.
Table 2 shows that no single RDB has consistently
operated efficiently. The numbers of banks operating
efficiently were one bank in 2012, two banks in 2013,
three banks in 2014, six banks in 2015, four banks in 2016
and three banks in 2017. The table reveals Bank Lampung
to be the most efficient bank with an average TE score of
97.50%, while Bank Kalbar, with an average DEA score
66
Jurnal Ekonomi Malaysia 53(3)
TABLE 1. Sample Banks, Assets and Capital as of December 2017
No
1
Bank
Total Assets
(million IDR)
Core Capital
(million IDR)
Book
Category
Bank Jabar Banten
108,408,673
8,458,884
3
2
Bank Jatim
51,518,681
6,928,205
3
3
Bank Jateng
61,466,427
5,838,985
3
4
Bank DKI
51,417,045
7,510,678
3
5
Bank Kaltim
22,631,038
4,271,348
2
6
Bank Sumut
28,931,824
2,863,990
2
7
Bank Papua
20,400,813
2,197,544
2
8
Bank Riau Kepri
25,492,550
2,691,816
2
9
Bank Sumbar
21,371,464
2,367,047
2
10
Bank Sumsel Babel
22,145,410
2,633,444
2
11
Bank Bali
22,150,905
2,484,771
2
12
Bank Kalbar
16,575,748
2,035,703
2
13
Bank Sulselbar
17,545,995
2,539,355
2
14
Bank Kalsel
11,907,552
1,564,136
2
15
Bank SulutGo
14,075,393
1,334,806
2
16
Bank NTT
10,379,174
1,562,145
2
17
Bank DIY
10,695,373
1,420,564
2
18
Bank NTB
8,864,391
1,272,085
2
19
Bank Kalteng
6,226,993
1,343,367
2
20
Bank Jambi
9,526,849
1,178,589
1
21
Bank Lampung
5,979,451
618,605
1
22
Bank Maluku Malut
6,369,510
792,941
1
23
Bank Bengkulu
5,865,006
592,207
1
24
Bank Sultra
6,161,553
812,111
1
25
Bank Sulteng
5,259,524
608,522
1
22,854,694
2,636,874
Mean
Sources: Bank Annual Reports
of 65.45 percent, is the least efficient bank. In general,
there was a slight increase in the technical efficiency level
of RDBs over the period, increasing from 81.22 percent
in 2012 to 81.88 percent in 2017.
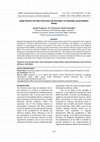
In Figure 2 the bank efficiency scores are arranged
into five groups. Banks with a score of 100 are
categorized as very efficient, banks with a score of
91–99.9 are categorized as efficient, banks with a
score of 81–90 are categorized as quite efficient, those
with a score of 71–80 are categorized as less efficient,
and banks with a score of 61–80 are categorized as
inefficient. A majority of the banks fall within the
technical efficiency range of 71–80 percent, meaning
they are mostly less efficient.
Considering these low levels of efficiency, there
is much potential for BPD West Kalimantan to increase
efficiency in terms of both inputs and outputs. Banxia
Software provides information on potential efficiency
improvements. Table 3 summarises the potential
improvements for the three least efficient banks, namely
100 (Efficient)
13%
61 - 70
16%
91 - 99.9
19%
71 - 80
28%
81 -90
24%
FIGURE 2. Distribution of Bank Technical Efficiencies,
2012–2017
Sources: Banxia Output
Bank Kalbar, Bank DIY and Bank Papua. The source of
these three banks’ inefficiency is mainly from the output
side. From the input side, Bank Kalbar and Bank Papua
have the potential to improve efficiency by increasing
Determinants of Bank Efficiency: Evidence from Regional Development Banks
67
TABLE 2. Regional Development Bank Efficiencies, 2012–2017
No
Bank
Year
Average
2012
2013
2014
2015
2016
2017
100.00%
95.00%
95.00%
97.50%
1
Bank Jambi
100.00%
97.40%
97.60%
2
Bank Lampung
90.50%
96.00%
100.00%
99.00%
100.00%
93.30%
96.47%
3
Bank SulutGo
94.20%
99.90%
81.70%
100.00%
100.00%
100.00%
95.97%
4
Bank Sulselbar
94.60%
94.70%
93.70%
100.00%
88.80%
100.00%
95.30%
5
Bank Bengkulu
82.60%
95.60%
87.60%
97.90%
94.30%
98.20%
92.70%
6
Bank Kaltim
81.00%
100.00%
100.00%
100.00%
91.90%
80.70%
92.27%
7
Bank Bali
76.80%
84.30%
94.20%
100.00%
100.00%
96.20%
91.92%
8
Bank Sultra
79.70%
80.30%
95.70%
100.00%
95.70%
100.00%
91.90%
9
Bank Jabar Banten
85.60%
99.80%
96.40%
88.00%
82.00%
85.00%
89.47%
10
Bank Jatim
96.70%
88.10%
82.70%
87.80%
81.90%
74.70%
85.32%
11
Bank Sulteng
86.50%
100.00%
97.20%
70.30%
78.20%
79.40%
85.27%
12
Bank NTB
90.40%
87.90%
82.50%
86.30%
84.10%
72.40%
83.93%
13
Bank NTT
79.70%
81.90%
75.40%
77.30%
89.20%
93.40%
82.82%
14
Bank Maluku Malut
90.60%
91.40%
81.40%
77.60%
77.80%
77.70%
82.75%
15
Bank Jateng
82.50%
75.20%
80.10%
86.10%
82.30%
84.30%
81.75%
16
Bank Kalsel
72.00%
79.10%
82.00%
90.70%
87.80%
77.70%
81.55%
17
Bank DKI
84.60%
97.70%
100.00%
73.20%
67.80%
62.00%
80.88%
18
Bank Riau Kepri
68.50%
74.30%
65.50%
94.70%
100.00%
79.70%
80.45%
19
Bank Sumbar
78.30%
77.50%
79.90%
79.20%
77.90%
79.30%
78.68%
20
Bank Sumut
80.20%
81.80%
80.70%
84.20%
72.10%
71.40%
78.40%
21
Bank Kalteng
65.30%
66.20%
69.40%
85.30%
79.80%
83.90%
74.98%
22
Bank Sumsel Babel
68.40%
78.70%
73.50%
80.90%
75.40%
66.50%
73.90%
23
Bank Papua
63.20%
69.40%
74.00%
71.00%
71.80%
66.50%
69.32%
24
Bank DIY
71.90%
64.00%
70.10%
67.80%
67.80%
68.80%
68.40%
25
Bank Kalbar
66.60%
65.90%
66.10%
63.60%
69.70%
60.80%
65.45%
81.22%
85.08%
84.30%
86.44%
84.45%
81.88%
83.89%
Mean
Minimum
63.20%
64.00%
65.50%
63.60%
67.80%
60.80%
65.45%
Maximum
100.00%
100.00%
100.00%
100.00%
100.00%
100.00%
97.50%
Standard Deviation
10.38%
11.86%
11.26%
11.69%
10.69%
12.42%
9.11%
Sources: Banxia Output
their utilization of fixed assets. Based on the financial
data of these three banks during the study period, the
proportions of fixed assets to total assets for Bank Kalbar
and Bank Papua are 2.28 percent and 2.39 percent
respectively, while the industry average is 1.47 percent.
This could indicate that Bank Kalbar and Bank Papua
have too many fixed assets in the form of office buildings.
Both banks could consider renting office buildings instead
of owning them.
Table 3 also reveals non-interest income to be the
main source of inefficiency for the three banks in terms
of output. The financial data of the three banks show
that the proportions of non-interest income to total assets
for Bank Kalbar, Bank DIY and Bank Papua are 0.57
percent, 0.56 percent and 0.62 percent, respectively.
These figures are half the industry average of 1.17
TABLE 3. Potential Optimisation of Input and Output Sides (%)
Inputs/Output
Bank
Kalbar
Bank
DIY
Bank
Papua
(23.21)
0.00
(23.21)
Employee Costs
6.92
(1.50)
0.00
Third-party Deposits
0.00
0.00
0.00
Loans
50.09
39.13
58.19
Interest Income
50.09
39.13
58.37
Non-Interest Income
79.43
84.77
68.49
Inputs
Fixed Assets
Outputs
Sources: Banxia Output
68
Jurnal Ekonomi Malaysia 53(3)
percent, thus indicating that these banks need to develop
and optimize a range of products that produce fees and
commissions, such as bank guarantees, transfer services,
syndicated loans, credit cards, ATMs, internet banking,
m-banking, account maintenance, safe deposit boxes
and wealth management.
Figure 3 identifies a common problem with regard
to RDB efficiency. It shows that 59 percent of the RDB
inefficiency arises due to the lack of non-interest income.
This is unsurprising as 20 of the 25 RDBs are categorized
as Book 1 and Book 2 banks (see Table 1). Banks in these
two categories have a limited scope of operations, namely
conducting payment system activities and e-banking,
foreign exchange trading, and treasury on a limited basis.
One way in which to improve non-interest income would
be to increase the banks’ capital with the aim of moving
them into Book 3, which would then enable them to carry
out almost all banking activities. The banks can then
use this additional capital to strengthen their e-banking
infrastructure and activities.
Fixed Asset
7%
Employee Cost
2%
Total Deposit
1%
Total Loan
15%
Non Interest
Income
59%
Interest Income
16%
FIGURE 3. Total Potential Improvement, 2012–2017
Sources: Banxia Output
DETERMINANTS OF BANK EFFICIENCY
A total of six factors determined the estimated bank
technical efficiency studied, namely bank size, NPL,
capital (CAR), LDR, NIM and composition of deposits
(CoD). Table 4 shows the descriptive statistics of these
independent variables.
Size is represented by bank assets (in million
rupiahs) and is used to assess for the existence of
economies of scale at the RDBs. Table 4 shows that the
size of the RDBs varies greatly, from a maximum of Rp.
108,697 million categorized as Book 2 to a minimum of
Rp. 1,358 million categorized as Book 1. The remarkable
difference in the banks’ respective asset sizes will affect
their scope of operations and the products offered. A
significant difference also occurs in the credit quality as
reflected in the magnitude of NPLs. Bank Papua has the
highest NPLs at 14.720 percent, which is far above the
regulatory provision of 5 percent. High NPLs will serve
to both undermine and reduce profits and further reduce
the bank’s ability to lend.
The capital adequacy ratios (CARs) of Indonesian
RDBs are far above the regulatory capital of 8 percent.
Thus, no bank has a capital adequacy problem. However,
these high CARs may indicate the presence of less
productive capital that is not channeled in credit. This
is a condition that can affect bank technical efficiency,
mainly in the form of credit and interest income. The
RDBs have an average LDR of 92.643 percent, which is
above that required by the regulator. This average ratio
is quite close to 94 percent as the upper-limit LDR set
up by Bank Indonesia, which means the RDBs are quite
expansive in terms of their lending. Many of the banks
were also very expansive in their lending during the
period 2012–2017, as shown by the maximum LDR in
excess of 100 percent.
The RDBs generated a relatively high profit, as
measured using NIM. This high NIM can be attributed
either to the low cost of sources of funds or the highinterest rates charged to debtors for credit. Considering
that the average figure for the CoD is 34.331 percent, then
the largest source of RDB funds is demand deposits and
savings at a very low rate of interest, ranging from 1 to 2
percent in Indonesia. RDBs benefit from substantial lowcost funds as they are used as local government payment
banks and have a large customer base of government
employees.
Table 5 shows the results of the panel data regression
model for the determinants of bank technical efficiency
using the PR, FE, and RE models. A Chow test was
performed in order to identify the best option between the
PR and FE models. If the probability of the cross-section is
TABLE 4. Descriptive Statistics of the Bank Efficiency Determinants
Mean
SD
Max
Min
Assets (million rupiah)
17,727
17,762
108,697
1,358
Non-Performing Loans
2.698
2.620
14.720
0.170
Capital Adequacy ratio
14.720
5.089
32.290
12.300
Loan-to-Deposit Ratio
92.643
12.544
128.430
55.770
Net Interest Margin
7.760
1.442
11.990
4.950
Composition of Deposits
34.331
13.974
68.560
6.240
Sources: Research Data
Determinants of Bank Efficiency: Evidence from Regional Development Banks
less than 5 percent, the best model is FE, otherwise, the PR
model is preferred. Table 5 reveals that the F-probability
is 0.000 < 5 percent. This means that the FE regression is
more appropriate for use in analyzing bank efficiency in
Indonesia. Next, the Hausman test is used to determine
which model is best between FE and RE. If the probability
of a random cross-section is less than 5 percent, then FE
is the best model, otherwise, the RE model is preferred.
Table 5 shows that the probability of a random crosssection is less than 5 percent, which means that the FE
model is more appropriate for analyzing bank efficiency
in Indonesia. Based on these two test results, the output
of the FE model is used in the next explanation regarding
the determinants of the level of bank efficiency.
Although Table 5 shows that FE is the most
appropriate model, FE still has econometric problems,
such as heteroscedasticity and autocorrelation (Gujarati
& Porter 2009). To overcome this problem, we reestimated FE using White’s robust standard errors, both
69
White cross-section and White period. The results of
this estimate are presented in Table 6. This table shows
the results of FE that are not significantly different from
those presented in Table 5. All the variables in the FE
model that are significant in Table 5 remain significant
in Table 6. Thus, the selection of FE as the best model
is statistically robust.
Table 5 and Table 6 contain the results of the FE
model and show that capital and LDR have a significant
positive effect on the level of DEA-based technical
efficiency of the Indonesian RDBs, while NPL and CoD
negatively influence bank technical efficiency. There is
no significant evidence of the influence of bank size and
NIM on efficiency.
The positive influence of capital on bank technical
efficiency suggests that the availability of excess capital
will enable banks to increase lending without being
overly concerned with being unable to cover the credit
risk that arises as it has sufficient capital to cover this
TABLE 5. Results of Panel Data Regression Analysis
Expected
Sign
Variable
Constant
Size
Non-Performing Loan
PR
FE
RE
Coef.
Prob.
Coef.
Prob.
Coef.
Prob.
12.166
0.692
23.295
0.641
24.452
0.526
+/-
1.213
0.186
1.342
0.417
1.238
0.318
-
-0.951
0.002*
-0.996
0.000*
-1.039
0.000*
Capital Adequacy Ratio
+
0.468
0.002*
0.581
0.000*
0.565
0.000*
Loan-to-Deposit Ratio
+
0.453
0.000*
0.272
0.000*
0.295
0.000*
Net Interest Margin
-
-1.410
0.007*
-0.372
0.378
-0.548
0.176
Composition of Deposits
-
-0.077
0.128
-0.320
0.000*
-0.273
0.000*
R-Square
0.505
0.884
0.655
Adjusted R-Square
0.484
0.854
0.641
F-Stat
0.000
0.000
0.000
Chow test
Cross section F (Prob.)
0.000
Hausman test
Cross section random (Prob.)
0.026
Sources: EViews Output
* Significance at 5%
TABLE 6. Fixed Effect Regression Model with Robust Standard Error
Variable
FE-White cross-section
FE-White period
Coef.
Prob.
Coef.
Prob.
Constant
23.295
0.598
23.295
0.692
Size
1.342
0.316
1.342
0.503
Non-Performing Loan
-0.996
0.000*
-0.996
0.067**
Capital Adequacy Ratio
0.581
0.000*
0.581
0.016*
Loan-to-Deposit Ratio
0.272
0.000*
0.272
0.000*
Net Interest Margin
-0.372
0.524
-0.372
0.527
Composition of Deposits
-0.320
0.000*
-0.320
0.000*
Sources: EViews Output
* Significance at 5%, ** Significance at 10%
70
Jurnal Ekonomi Malaysia 53(3)
risk. Adequate capital availability also means banks are
able to take advantage of various profitable investment
or credit opportunities that will eventually generate an
increase in their interest income (Osei-Assibey & Asenso
2015). A strong capital balance is also a sign of a healthy
bank and means depositors are willing to save their funds
at the bank without having to ask for a high rate of return
(Fatima 2014). The impact is that the cost of bank funding
is low, credit interest is low and the quality of its debtors
is good, which ultimately increases bank profits. Thus,
the amount of capital can improve the technical efficiency
of banks (Altunbas et al. 2000; Altunbas et al. 2007).
LDR is shown to positively affect bank technical
efficiency. A higher ratio indicates a greater level of
bank loans relative to third-party deposits. In the context
of an RDB where lending is the main asset placement
activity (Keuangan 2016), the ability to channel credit
is an important aspect in determining bank efficiency.
Lending is the main source of bank growth (Caprio
et al. 2007) and is especially crucial for RDBs with a
limited range of fee-based income activities. This credit
disbursement will further improve the bank’s ability
to generate interest income (Dietrich & Wanzenried
2011; Anbar & Alper 2011; Gul et al. 2011; Molyneux
& Thornton 1992).
Another significant determinant of bank technical
efficiency in the FE model is NPL . This variable
negatively influences bank efficiency. A high NPL means
that banks will spend a lot of time, effort and cost on
managing loan-related problems (Kwan & Eisenbeis
1996; Rajaraman & Vasishtha 2002; Tan & Floros
2013). All of this raises costs and means management
to have less time to spend on activities that create added
value for the bank. Banks also need to allocate capital
to cover the large credit losses and this reduction in
the capital will diminish the bank’s ability to lend. An
increase in cost and a decline in lending will ultimately
reduce bank profitability (Masood & Ashraf 2012;
Bolt et al. 2012).
The composition of deposits has a negative effect
on efficiency. The greater the composition of third-party
deposits originating from time deposits, the higher the
cost of funds borne by the bank. This high cost of funds
makes it difficult for banks to extend credit, and even if
this is possible, the quality of debtors tends to be poor,
which in turn leads to problem loans. The high cost of
funding also reduces bank net interest income (Deans &
Stewart 2012). For RDBs, interest is a vital component
of income as it accounts for around 91 percent of their
income.
Table 5 and Table 6 also reveal that bank size
does not significantly influence bank efficiency. This
can indicate that the effect of bank size on efficiency
is not linear but quadratic (U-shaped). To examine
this possibility, we include the square of size (size2)
in the FE regression model. The results of this test can
be seen in Table 7, where it is shown that there is no
significant difference in the effect of all variables on
bank efficiency compared to the results in Table 5 and
Table 6, except for size. Size does not have a significant
effect on efficiency in Table 5 and Table 6, but it does
have a positive effect on efficiency when size squared
has a negative effect on it. In other words, the effect of
size on efficiency is U-shaped (Hadad et al. 2013; Karray
& Chichti 2013; Muazaroh et al. 2012). An increase
in bank assets means that banks initially benefit from
economies of scale due to a reduced cost per unit of
transactions (Altunbas et al. 2000; Hughes et al. 2001;
Pasiouras 2008; Perera et al. 2007). Larger banks can
reduce their employee unit costs and improve their
efficiency by spreading this cost over many transactions.
However, these benefits of economies of scale are
negated if banks become too big. When banks become
too large, with many branches and employees, they may
suffer from coordination and monitoring problems, as
well as delays in decision-making. The impact is that
they lose many opportunities to grow and make profits,
thereby reducing their efficiency.
TABLE 7. Fixed Effect Regression Model by Including Square of Size
FE-White cross-section
FE-White period
Coef.
Coef.
Prob.
Prob.
Coef.
Prob.
Constant
-21.292
-2.190
0.000
0.004
-2.190
0.036
Size
15.034
15.034
0.000*
0.003*
15.034
0.032*
Size2
-2.505
-2.505
0.000*
0.004*
-2.505
0.033*
Non-Performing Loan
-0.987
-0.987
0.000*
0.002*
-0.987
0.041*
Capital Adequacy Ratio
0.589
0.589
0.000*
0.000*
0.589
0.014*
Variable
FE
Loan-to-Deposit Ratio
0.284
0.284
0.000*
0.000*
0.284
0.000*
Net Interest Margin
-0.574
-0.574
0.284
0.166
-0.574
0.287
Composition of Deposits
-0.304
-0.304
0.000*
0.000*
-0.304
0.000*
Sources: EViews Output
* Significance at 5%
Determinants of Bank Efficiency: Evidence from Regional Development Banks
CONCLUSION
This study has analyzed the technical efficiency of
Indonesia’s RDBs using a two-stage DEA procedure.
The first stage of the analysis revealed that, in general,
the RDBs had yet to become efficient during the period
2012–2017. The main causes of inefficiency were on the
output side, namely credit disbursement, interest income,
and non-interest income. The most important source
of inefficiency is non-interest income. One means of
optimizing this income would be to increase the banks’
capital with the aim of shifting them into the Book 3
category, which would enable them to perform almost
all banking activities. Banks can utilize their capital to
develop fee-based income products, such as internet and
mobile banking and bank guarantees.
The second stage of the analysis revealed that capital
and the LDR improved the level of DEA-based technical
efficiency of the Indonesian RDBs, while NPL and deposit
composition reduced bank technical efficiency. The
positive impact of bank size and the negative impact of
the square of size may suggest that as banks increase their
assets they enjoy economies of scale up to a certain point,
after which any further increase produces diseconomies
of scale. In addition, the RDBs need to further increase
their loan disbursements. Banks with a low LDR should
seek to increase their lending up to the point at which
their LDR reaches the maximum regulatory limit of 94
percent. RDBs also need to control the interest they charge
to borrowers in order to reduce the composition of time
deposits with high-interest rates as these may impede
credit expansion, increase problem loans and reduce
interest income.
There are some policy implications from this
study. The Indonesian Financial Services Authority
(OJK) needs to encourage RDBs and local governments
as owners to accelerate their capital increase, either
internally or through strategic alliances, so that these
banks can further expand activities beyond lending
so that RDBs can improve their non-interest income
which is the main source of inefficiency of RDBs. Bank
Indonesia also needs to further relax the upper limit of
the LDR, which is currently 94 percent to close to 100
percent, thereby reducing unproductive depositor’s
funds at the Central Bank and increasing the capacity
of RDBs in lending, which in turn could increase RDBs
interest income.
REFERENCES
Abidin, Z. & Endri, E. 2010. Kinerja efisiensi teknis bank
pembangunan daerah: Pendekatan Data Envelopment
Analysis (DEA). Jurnal Akuntansi dan Keuangan 11:
21-29.
Akhtar, M. H. 2010. Are Saudi banks productive and efficient?
International Journal of Islamic and Middle Eastern
Finance and Management 3: 95-112.
71
Al-Faraj, T. N., Alidi, A. S. & Bu-Bshait, K. A. 1993. Evaluation
of bank branches by means of data envelopment analysis.
International Journal of Operations & Production
Management 13: 45-52.
Al-Khasawneh, J. A., Bassedat, K., Aktan, B. & Darshini Pun
Thapa, P. 2012. Efficiency of Islamic banks: case of North
African Arab countries. Qualitative Research in Financial
Markets 4: 228-239.
Altunbas, Y., Carbo, S., Gardener, E. P. & Molyneux, P. 2007.
Examining the relationships between capital, risk and
efficiency in European banking. European Financial
Management 13: 49-70.
Altunbas, Y., Liu, M.-H., Molyneux, P. & Seth, R. 2000.
Efficiency and risk in Japanese banking. Journal of
Banking & Finance 24: 1605-1628.
Anbar, A. & Alper, D. 2011. Bank specific and macroeconomic
determinants of commercial bank profitability: Empirical
evidence from Turkey. Business and Economics Research
Journal 2: 139-152.
Bannour, B., Sghaier, A., & Nurannobi, M. 2018. How to choose
a nonparametric frontier model? Technical efficiency of
Turkish banks assessing global. Global Business Review
21: 1-19.
Banker, R. D., Charnes, A. & Cooper, W. W. 1984. Some
models for estimating technical and scale inefficiencies
in data envelopment analysis. Management Science 30:
1078-1092.
Berger, A. N. & Deyoung, R. 1997. Problem loans and cost
efficiency in commercial banks. Journal of Banking &
Finance 21: 849-870.
Bolt, W., De Haan, L., Hoeberichts, M., Van Oordt, M. R. &
Swank, J. 2012. Bank profitability during recessions.
Journal of Banking & Finance 36: 2552-2564.
Bonin, J. P., Hasan, I. & Wachtel, P. 2005. Bank performance,
efficiency and ownership in transition countries. Journal
of Banking & Finance 29: 31-53.
Caprio, G., Laeven, L. & Levine, R. 2007. Governance and
bank valuation. Journal of Financial Intermediation 16:
584-617.
Casu, B., Girardone, C. & Molyneux, P. 2004. Productivity
change in European banking: A comparison of parametric
and non-parametric approaches. Journal of Banking &
Finance 28: 2521-2540.
Charnes, A., Cooper, W. W. & Rhodes, E. 1978. Measuring the
efficiency of decision making units. European Journal of
Operational Research 2: 429-444.
Chen, T.-Y. & Yeh, T.-L. 1998. A study of efficiency evaluation
in Taiwan’s banks. International Journal of Service
Industry Management 9: 402-415.
Chen, T.-Y. & Yeh, T.-L. 2000. A measurement of bank
efficiency, ownership and productivity changes in Taiwan.
Service Industries Journal 20: 95-109.
Cook, W. D., Tone, K. & Zhu, J. 2014. Data envelopment
analysis: Prior to choosing a model. Omega 44: 1-4.
Deans, C. & Stewart, C. 2012. Banks’ funding costs and
lending rates. Reserve Bank of Australia Bulletin 2012:
37-43.
Defung, F., Salim, R. & Bloch, H. 2016. Has regulatory reform
had any impact on bank efficiency in Indonesia? A twostage analysis. Applied Economics 48: 5060-5074.
Diallo, B. 2018. Bank efficiency and industry growth, during
financial crises. Economic Modelling 68: 11-22.
72
Dietrich, A. & Wanzenried, G. 2011. Determinants of bank
profitability before and during the crisis: Evidence from
Switzerland. Journal of International Financial Markets,
Institutions and Money 21: 307-327.
Dong, Y., Hamilton, R. & Tippett, M. 2014. Cost efficiency of
the Chinese banking sector: a comparison of stochastic
frontier analysis and data envelopment analysis. Economic
Modelling 36: 298-308.
Färe, R. & Lovell, C. K. 1978. Measuring the technical
efficiency of production. Journal of Economic Theory
19: 150-162.
Farrell, M. J. 1957. The measurement of productive efficiency.
Journal of the Royal Statistical Society. Series A (General)
120: 253-290.
Fatima, N. 2014. Capital adequacy: A financial soundness
indicator for banks. Global Journal of Finance and
Management 6: 771-776.
Favero, C. A. & Papi, L. 1995. Technical efficiency and scale
efficiency in the Italian banking sector: a non-parametric
approach. Applied Economics 27: 385-395.
Felix, A. O., Adebayo, A. O. & Omolehinwa, E. 1998. Bank
performance measurement in a developing economy: an
application of data envelopment analysis. Managerial
Finance 24: 5-16.
Ferari, N. & Sudarsono, H. 2011. Tingkat Efisiensi Perbankan
Syariah Dan Konvensional Dengan Mengunakan Data
Envelopment Analysis ( DEA ). Jurnal Ekonomi dan
Keuangan Islam 1: 141-148.
Fukuyama, H. 1993. Technical and scale efficiency of Japanese
commerical banks: a non-parametric approach. Applied
Economics 25: 1101-1112.
Gardener, E., Molyneux, P. & Nguyen-Linh, H. 2011.
Determinants of efficiency in South East Asian banking.
The Service Industries Journal 31: 2693-2719.
Golany, B. & Storbeck, J. E. 1999. A data envelopment analysis
of the operational efficiency of bank branches. Interfaces
29: 14-26.
Gujarati, D. N. & Porter, D. 2009. Basic Econometrics Mc
Graw-Hill.
Gul, S., Irshad, F. & Zaman, K. 2011. Factors Affecting Bank
Profitability in Pakistan. Romanian Economic Journal, 14.
Hadad, M., Hall, M. J., Kenjegalieva, K. A., Santoso, W.
& Simper, R. 2012. A new approach to dealing with
negative numbers in efficiency analysis: An application
to the Indonesian banking sector. Expert Systems with
Applications, 39: 8212-8219.
Hadad, M., Hall, M. J., Santoso, W. & Simper, R. 2013.
Economies of scale and a process for identifying
hypothetical merger potential in Indonesian commercial
banks. Journal of Asian Economics 26: 42-51.
Hadad, M., Santoso, W., Ilyas, D. & Mardanugraha, E.
2003a. Analisis Efisiensi Industri Perbankan Indonesia:
Penggunaan Metode Nonparametrik Data Envelopment
Analysis (DEA). Research Paper, 7.
Hadad, M., Wibowo, S., Handoko, S., Yuniar, M. & Noviati,
N. Kajian Mengenai Efektivitas Kebijakan Obligasi
Rekap. Bank of Indonesia Working Paper, 2003b. Bank
of Indonesia.
Haslem, J. A., Scheraga, C. A. & Bedingfield, J. P. 1999. DEA
efficiency profiles of US banks operating internationally.
International Review of Economics & Finance
8: 165-182.
Jurnal Ekonomi Malaysia 53(3)
Hassan, T., Mohamad, S. & Khaled I. Bader, M. 2009.
Efficiency of conventional versus Islamic banks: evidence
from the Middle East. International Journal of Islamic
and Middle Eastern Finance and Management 2: 46-65.
Havrylchyk, O. 2006. Efficiency of the Polish banking industry:
Foreign versus domestic banks. Journal of Banking &
Finance 30: 1975-1996.
Hawdon, D. 2003. Efficiency, performance and regulation of
the international gas industry—a bootstrap DEA approach.
Energy Policy 31: 1167-1178.
Howland, M. & Rowse, J. 2006. Measuring bank branch
efficiency using data envelopment analysis: managerial
and implementation issues. INFOR: Information Systems
and Operational Research 44: 49-63.
Hughes, J. P., Mester, L. J. & Moon, C.-G. 2001. Are scale
economies in banking elusive or illusive?: Evidence
obtained by incorporating capital structure and risk-taking
into models of bank production. Journal of Banking &
Finance 25: 2169-2208.
Jarzebowski, S. 2013. Parametric and Non-Parametric
Efficiency Measurement–The Comparison of Results.
Metody Ilościowe w Badaniach Ekonomicznych 14:
170-179.
Jemric, I. & Vujcic, B. 2002. Efficiency of banks in Croatia:
A DEA approach. Comparative Economic Studies 44:
169-193.
Kalis, R., Amin, P. & Prasetyo, P. E. 2012. Tingkat Efisiensi
Bank Di Indonesia. Dinamika Akuntansi Keuangan dan
Perbankan, 1.
Karim, M. Z. A., Chan, S.-G. & Hassan, S. 2010. Bank efficiency
and non-performing loans: Evidence from Malaysia and
Singapore. Prague Economic Papers 2: 118-132.
Karray, S. C. & Chichti, J. E. 2013. Bank size and efficiency
in developing countries: intermediation approach versus
value added approach and impact of non-traditional
activities. Asian Economic and Financial Review 3: 593.
Keuangan, O. J. 2016. Annual Report OJK 2015. Available at
www. ojk. go. id.[download at 29 September 2016].
Keuangan, O. J. 2018a. Direktori Perbankan Indonesia. Jakarta:
Otoritas Jasa Keuangan.
Keuangan, O. J. 2018b. Laporan Profil Industri Perbankan
Triwulan IV 2017.
Kurnia, A. S. 2004. Mengukur efisiensi intermediasi sebelas
bank terbesar indonesia dengan pendekatan Data
Envelopment Analysis (DEA). Jurnal Bisnis Strategi
13: 126-140.
Kwan, S. & Eisenbeis, R. A. 1997. Bank risk, capitalization,
and operating efficiency. Journal of Financial Services
Research 12: 117-131.
Kwan, S. H. & Eisenbeis, R. A. 1996. An analysis of
inefficiencies in banking: A stochastic cost frontier
approach. Economic Review-Federal Reserve Bank of
San Francisco, 16.
Li, Y., Chu, Y.H., Chen, H., & Lin, T.Y. 2019. The operating
efficiency of financial holding and nonfinancial holding
banks-Epsilou-based measure metafronties data
envelopment analysis model. Managerial and Desision
Economics 40: 488-499.
Masood, O. & Ashraf, M. 2012. Bank-specific and
macroeconomic profitability determinants of Islamic
banks: The case of different countries. Qualitative
Research in Financial Markets 4: 255-268.
Determinants of Bank Efficiency: Evidence from Regional Development Banks
Miller, S. M. & Noulas, A. G. 1996. The technical efficiency
of large bank production. Journal of Banking & Finance
20: 495-509.
Mokhtar, H. S. A., Abdullah, N. & Alhabshi, S. M. 2008.
Efficiency and competition of Islamic banking in Malaysia.
Humanomics 24: 28-48.
Molyneux, P. & Thornton, J. 1992. Determinants of European
bank profitability: A note. Journal of Banking & Finance
16: 1173-1178.
Mostafa, M. M. 2011. Modeling Islamic banks’ efficiency: a
non-parametric frontier approach. International Journal
of Islamic and Middle Eastern Finance and Management
4: 7-29.
Muazaroh, M., Eduardus, T., Husnan, S. & Hanafi, M. 2012.
Determinants of bank profit efficiency: Evidence from
Indonesia. International Journal of Economics and
Finance Studies 4: 163-173.
Muharam, H. 2007. Analisis perbandingan efisiensi bank
syariah di Indonesia dengan metode data envelopment
analysis (Periode tahun 2005). Jurnal Ekonomi dan Bisnis
Islam 2: 80-166.
Mukherjee, A., Nath, P. & Nath Pal, M. 2002. Performance
benchmarking and strategic homogeneity of Indian banks.
International Journal of Bank Marketing 20: 122-139.
Novandra, R. 2017. Analisis Perbandingan Efisiensi Perbankan
Syariah dan Konvensional di Indonesia. Jurnal Ekonomi
dan Pembangunan 22: 183-193.
Omar, M. A., Majid, M. S. A. & Ronald, R. 2007. Efficiency
and productivity performance of the private national
banks in Indonesia. Gadjah Mada International Journal
of Business 9: 1-18.
Osei-Assibey, E. & Asenso, J. K. 2015. Regulatory capital and
its effect on credit growth, non-performing loans and bank
efficiency: Evidence from Ghana. Journal of Financial
Economic Policy 7: 401-420.
Partorī, E., & Matousek, R. 2019. Bank eficiency and nonperforming loans: Evidence from Turkey Research in
International Business and Finance 48: 287-307.
Pasiouras, F. 2008. Estimating the technical and scale efficiency
of Greek commercial banks: the impact of credit risk,
off-balance sheet activities, and international operations.
Research in International Business and Finance
22: 301-318.
Pavkovic’, A., Casarec, A., & Stojanovic’, A. 2018. Profilability
and efficiency of the Croatian banking sector: Impact of
bank size. International Journal of Trade and Global
Markets 11: 243-258.
Perera, S., Skully, M. & Wickramanayake, J. 2007. Cost
efficiency in South Asian banking: The impact of bank size,
state ownership and stock exchange listings. International
Review of Finance 7: 35-60.
Pramuka, B. A. 2011. Assessing profit efficiency of Islamic
banks in Indonesia: An intermediation approach. Journal
of Economics, Business & Accountancy Ventura (JEBAV)
14: 79-88.
Rajaraman, I. & Vasishtha, G. 2002. Non-performing loans of
PSU banks: Some panel results. Economic and Political
Weekly: 429-435.
Resti, A. 1997. Evaluating the cost-efficiency of the Italian
banking system: What can be learned from the joint
application of parametric and non-parametric techniques.
Journal of Banking & Finance 21: 221-250.
73
Rose, P. S. & Hudgins, S. C. 2013. Bank management &
financial services, McGraw-Hill.
Rosyadi, I. 2017. Komparasi Efisiensi Perbankan Syariah Dan
Perbankan Konvensional Di Indonesia. Riset Akuntansi
dan Keuangan Indonesia 2: 61-74.
Sadalia, I. & Kautsar, M. H. 2018. Analysis of the efficiency
performance of Sharia and conventional banks using
stochastic frontier analysis. Banks and Bank Systems
13: 27.
Sakar, B. 2006. A study on efficiency and productivity of Turkish
banks in Istanbul stock exchange using Malmquist DEA.
Journal of American Academy of Business 8: 145-155.
Salas, V. & Saurina, J. 2002. Credit risk in two institutional
regimes: Spanish commercial and savings banks. Journal
of Financial Services Research 22: 203-224.
Sapci, A., & Miles, B. 2019. Bank size, returns to scale and
cost efficiency. Journal of Economics and Business 105:
105842.
Sathye, M. 2001. X-efficiency in Australian banking: An
empirical investigation. Journal of Banking & Finance
25: 613-630.
Sathye, M. 2003. Efficiency of banks in a developing economy:
The case of India. European Journal of Operational
Research 148: 662-671.
Sathye, S., & Sathye, M. 2017. Do ATMs increase technical
efficiency of banks in a developing country? Evidence
from Indian banks. Australian Accounting Review 27:
101-111.
Seiford, L. M. & Zhu, J. 1999. Profitability and marketability
of the top 55 US commercial banks. Management Science
45: 1270-1288.
Sinkey, J. F. & Greenawalt, M. B. 1991. Loan-loss experience
and risk-taking behavior at large commercial banks.
Journal of Financial Services Research 5: 43-59.
Staub, R. B., E Souza, G. D. S. & Tabak, B. M. 2010. Evolution
of bank efficiency in Brazil: A DEA approach. European
Journal of Operational Research 202: 204-213.
Sufian, F. & Noor, M. A. N. M. 2009. The determinants of
Islamic banks’ efficiency changes: Empirical evidence
from the MENA and Asian banking sectors. International
Journal of Islamic and Middle Eastern Finance and
Management 2: 120-138.
Sutanto, H. A. 2015. Analisis Efisiensi Teknis Bank
Pembangunan Daerah. JEJAK: Jurnal Ekonomi Dan
Kebijakan 8.
Tan, Y. & Floros, C. 2013. Risk, capital and efficiency in
Chinese banking. Journal of International Financial
Markets, Institutions and Money 26: 378-393.
Vassiloglou, M. & Giokas, D. 1990. A study of the relative
efficiency of bank branches: an application of data
envelopment analysis. Journal of the Operational
Research Society 41: 591-597.
Vincova, K. 2005. Using DEA models to measure efficiency.
Biatec 13: 24-28.
Wardhani, P. I. & Mongid, A. 2019. Strategies to increase
production efficiency in Indonesian Sharia commercial
banks using Stochastic Frontier Approach (SFA). Journal
of Economics, Business & Accountancy Ventura 21:
379-389.
Widiarti, A. W., Siregar, H. & Andati, T. 2015. The Determinants
of Banks Efficiency in Indonesia. Bank Indonesia: Buletin
Ekonomi Moneter dan Perbankan 18: 129-156.
74
Wu, D. D., Yang, Z. & Liang, L. 2006. Using DEA-neural
network approach to evaluate branch efficiency of a
large Canadian bank. Expert Systems With Applications
31: 108-115.
Zenios, C. V., Zenios, S. A., Agathocleous, K. & Soteriou, A.
C. 1999. Benchmarks of the efficiency of bank branches.
Interfaces 29: 37-51.
Lutfi*
Undergraduate Program - Department of Management
STIE Perbanas Surabaya
Nginden Semolo 34-36, Surabaya
INDONESIA
E-mail: lutfi@perbanas.ac.id
Jurnal Ekonomi Malaysia 53(3)
Suyatno
Postgradute Program - Department of Management
STIE Perbanas Surabaya
Nginden Semolo 34-36, Surabaya
INDONESIA
E-mail: suyatno_bjtm@yahoo.com
*Corresponding author
Keep reading this paper — and 50 million others — with a free Academia account
Used by leading Academics

Tony Waters
Leuphana University

Kaan Ağartan
Framingham State University

Benjamin Zachariah
Einstein Forum, Potsdam

Carlos Manuel Faísca
University of Coimbra