Resource
Optical Dissection of Experience-Dependent Preand Postsynaptic Plasticity in the Drosophila Brain
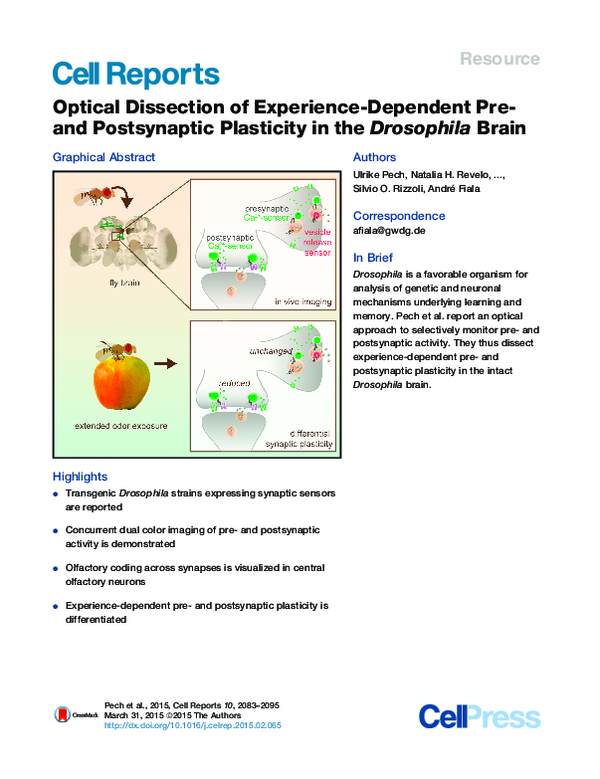
Graphical Abstract
Authors
Ulrike Pech, Natalia H. Revelo, ...,
Silvio O. Rizzoli, André Fiala
Correspondence
afiala@gwdg.de
In Brief
Drosophila is a favorable organism for
analysis of genetic and neuronal
mechanisms underlying learning and
memory. Pech et al. report an optical
approach to selectively monitor pre- and
postsynaptic activity. They thus dissect
experience-dependent pre- and
postsynaptic plasticity in the intact
Drosophila brain.
Highlights
d
Transgenic Drosophila strains expressing synaptic sensors
are reported
d
Concurrent dual color imaging of pre- and postsynaptic
activity is demonstrated
d
Olfactory coding across synapses is visualized in central
olfactory neurons
d
Experience-dependent pre- and postsynaptic plasticity is
differentiated
Pech et al., 2015, Cell Reports 10, 2083–2095
March 31, 2015 ª2015 The Authors
http://dx.doi.org/10.1016/j.celrep.2015.02.065
�Cell Reports
Resource
Optical Dissection of Experience-Dependent
Pre- and Postsynaptic Plasticity
in the Drosophila Brain
Ulrike Pech,1 Natalia H. Revelo,2 Katharina J. Seitz,2 Silvio O. Rizzoli,2 and André Fiala1,*
1Department of Molecular Neurobiology of Behavior, Johann-Friedrich-Blumenbach-Institute for Zoology and Anthropology,
Georg-August-University Göttingen, Julia-Lermontowa-Weg 3, 37077 Göttingen, Germany
2Department of Neuro- and Sensory Physiology, University of Göttingen Medical Center, Humboldtallee 23, 37073 Göttingen, Germany
*Correspondence: afiala@gwdg.de
http://dx.doi.org/10.1016/j.celrep.2015.02.065
This is an open access article under the CC BY-NC-ND license (http://creativecommons.org/licenses/by-nc-nd/3.0/).
SUMMARY
Drosophila represents a key model organism for dissecting neuronal circuits that underlie innate and
adaptive behavior. However, this task is limited by a
lack of tools to monitor physiological parameters of
spatially distributed, central synapses in identified
neurons. We generated transgenic fly strains that express functional fluorescent reporters targeted to
either pre- or postsynaptic compartments. Presynaptic Ca2+ dynamics are monitored using synaptophysin-coupled GCaMP3, synaptic transmission is
monitored using red fluorescent synaptophysinpHTomato, and postsynaptic Ca2+ dynamics are
visualized using GCaMP3 fused with the postsynaptic
matrix protein, dHomer. Using two-photon in vivo imaging of olfactory projection neurons, odor-evoked
activity across populations of synapses is visualized
in the antennal lobe and the mushroom body calyx.
Prolonged odor exposure causes odor-specific and
differential experience-dependent changes in preand postsynaptic activity at both levels of olfactory
processing. The approach advances the physiological analysis of synaptic connections across defined
groups of neurons in intact Drosophila.
INTRODUCTION
Monitoring of neuronal activity is crucial for the functional analysis of distinct neuronal circuits. Optical approaches provide
an advantage over electrophysiological techniques for recording
spatio-temporal activity across neuronal populations without
mechanical interference. With the invention of genetically
encoded fluorescent reporter proteins (reviewed by Tantama
et al., 2012), the corresponding sensors can be expressed reproducibly in specific neurons of interest. Therefore, transgenic
model organisms, e.g., mice, Caenorhabditis elegans, Danio
rerio, or Drosophila melanogaster, are of predominant significance in neuroscience.
Drosophila represents a favorable organism due to the versatility of genetic tools with which expression of transgenes,
including reporter proteins, can be restricted to defined populations of neurons (Venken et al., 2011). Imaging neuronal activity
in correlation with sensory stimuli or with behavioral actions using
genetically encoded Ca2+ indicators (GECIs) represents a widely
applied approach (Riemensperger et al., 2012). Typically, GECIs
are expressed in the entire neuronal cytosol. Therefore, they
report changes in the dynamics of cytosolic Ca2+ ions as integrated signals (Grienberger and Konnerth, 2012). Intracellular
Ca2+ ions have many different sources and different physiological
functions. Synaptic connections represent key elements underlying neuronal signal integration, processing, and plasticity. Therefore, techniques are required with which to restrict the analysis to
either pre- or postsynaptic activity. This is of particular importance
if neuronal activity is monitored in the dense neuropils of the central brain that often comprise various pre- and postsynaptic elements in close proximity. Whereas GECIs targeted specifically
to presynapses have been developed for and applied in the nervous systems of some vertebrates (Dreosti et al., 2009; Li et al.,
2011), no equivalent technique exists yet for the Drosophila brain.
Here, we report the generation and characterization of transgenic
Drosophila strains that express the Ca2+ sensor, GCaMP3 (Tian
et al., 2009), targeted either to the presynapse or the postsynapse.
In addition, we generated a fly strain that expresses the red fluorescent reporter of synaptic vesicle release, pHTomato (Li and
Tsien, 2012), inserted into an intravesicular domain of Synaptophysin. In combination with the green fluorescent, synaptically
targeted GECIs, vesicle release and either pre- or postsynaptic
Ca2+ dynamics can be monitored simultaneously. We use this
approach to dissect odor-evoked pre- and postsynaptic neuronal
activity in olfactory projection neurons of the central brain, and we
demonstrate odor-specific and differential experience-dependent changes in synaptic activity.
RESULTS
Targeting Fluorescent Sensors to Synapses in the
Drosophila Central Brain
For monitoring presynaptic Ca2+, we used a fusion construct that
is functional in vertebrates, i.e., the GCaMP3 linked to the
Cell Reports 10, 2083–2095, March 31, 2015 ª2015 The Authors 2083
�Figure 1. Synaptically Targeted Sensors
and Their Differential Expression in Olfactory Projection Neurons
(A) GCaMP3 is targeted to the cytoplasmic site of
synaptic vesicles by linking to the C terminus of rat
Synaptophysin.
(B) pHTomato is targeted to the lumen of synaptic
vesicles by insertion into the first intravesicular
domain of rat Synaptophysin.
(C) GCaMP3 is targeted to postsynaptic densities
by linking to the C terminus of dHomer.
(D) Schematic depiction of the Drosophila brain.
Neurons targeted by GH146-Gal4 are highlighted
in green (anterior paired lateral neuron innervating
the mushroom body on the left [APL] and olfactory
projection neurons on the right [OPNs]). Red
arrows indicate postsynaptic sites and blue arrows
presynaptic sites, and the weight of arrows indicates their proportions.
(E) Anti-GFP immunostaining of a Drosophila brain
expressing cytosolic GCaMP3 under control of
GH146-Gal4.
(F) Anti-GFP immunostaining of synaptophysinGCaMP3.
(G) Anti-RFP immunostaining of synaptophysinpHTomato.
(H) Anti-GFP immunostaining of dhomer-GCaMP3.
Immunohistochemical stainings (E–G) show projections of maximal fluorescence intensity across a
stack of confocal images. Al, antennal lobe; Ca,
mushroom body calyx; Lh, lateral horn; Mb,
mushroom body lobes; Ol, optical lobe; scale bars
100 mm. See also Figures S1 and S2.
cytoplasmic C terminus of the rat Synaptophysin protein (Dreosti
et al., 2009; Li et al., 2011) (Figure 1A). Fruit flies do not endogenously express a Synaptophysin homolog. Nevertheless, this
protein shows specific self-assembly in the membrane of synaptic vesicles when it is ectopically expressed (Leube, 1995). To
monitor synaptic transmission concurrently, we inserted the
red fluorescent pH-sensor pHTomato into the first intravesicular
domain of Synaptophysin (Li and Tsien, 2012) (Figure 1B). To
target the GECI to the postsynaptic densities of neurons, we
linked GCaMP3 with the C terminus of the Drosophila Homer
protein. dHomer is a homolog of the PDZ-domain-containing
Homer proteins of vertebrates, sharing equivalent subcellular
localization and conserved binding motifs, and it is expressed
in all neurons of the Drosophila nervous system (Xiao et al.,
1998; Diagana et al., 2002) (Figure 1C). Transgenic flies were
generated that express these DNA constructs under control of
upstream activator sequences (UASs) (Brand and Perrimon,
1993).
To probe the efficiency of the constructs in neurons of the fly
central brain, we used the well-characterized GH146-Gal4 driver
line (Stocker et al., 1997), which induces gene expression in two
populations of central neurons. GH146-Gal4 targets �83 olfactory projection neurons (OPNs) that project from the antennal
lobe (AL), the primary olfactory neuropil of the insect brain, to
the calyx (CA) of the mushroom body (MB) and the lateral horn
(LH) (Stocker et al., 1997; Wong et al., 2002) (Figure 1D). OPNs
receive their main postsynaptic input in the glomeruli of the AL
but also exhibit some presynaptic output in this neuropil (Ng
et al., 2002; Wilson et al., 2004). The majority of their axons
form the inner antennocerebral tract that terminates in the LH.
Short axonal collaterals furnished with large synaptic boutons
innervate the CA of the MB and provide mostly presynaptic
output to intrinsic MB neurons (Kenyon cells), but they also
receive some postsynaptic input (Yasuyama et al., 2002; Christiansen et al., 2011; Butcher et al., 2012). In addition, GH146Gal4 targets large interneurons (anterior paired lateral [APL]
neurons) that recurrently innervate the MB neuropil, although
expression in those neurons is weak when compared to OPNs
(see Figure 1E). The expression patterns of the targeted sensors
indicate correct targeting of the sensor proteins to synaptic terminals in accordance with the described polarity of the neurons,
as presynaptic sensors are enriched at the main output sites, CA
and LH (Figures 1F and 1G), and homer-GCaMP is enriched at
the main OPN input site, the AL (Figure 1H).
To detail the localization of the sensors, we analyzed the CA
and the AL and calculated the ratio of immunohistochemical
staining intensity in synaptic terminals to that in axons. Cytosolic
GCaMP is equally present both in synaptic structures and axonal
tracts. In contrast, all three synaptic sensors localize in a manner
comparable to the presynaptic marker, anti-synaptotagmin
(anti-syt), or the postsynaptic marker, anti-discs large (antiDLG) (Figures 2A and 2B). We also confirmed proper synaptic
targeting by focusing on the predominantly presynaptic boutons
in the CA (Figure 2C). In contrast to cytosolic GCaMP, synaptophysin-GCaMP (syp-GCaMP) and synaptophysin-pHTomato
(syp-pHTomato) are strongly confined to these boutons,
2084 Cell Reports 10, 2083–2095, March 31, 2015 ª2015 The Authors
�Figure 2. Synaptic Localization of the Fluorescent Sensors
(A) Quantification of immunostaining intensity of the fluorescent sensors in synaptic boutons of OPNs in the mushroom body calyx compared with the intensity in
adjacent axonal tracts. The ratio is compared to that of the presynaptic vesicle protein Synaptotagmin (anti-syt) and the postsynaptic protein discs-large (antiDLG). n R 10 calyces.
(B) Same as in (A) for the glomeruli of the antennal lobe (AL). n R 10 ALs. Box plots indicate medians, interquartile ranges, and 10%/90% range. n.s., p > 0.05; twosample t test; ***p < 0.001 Wilcoxon signed rank test.
(C) Immunostaining of cytosolic GCaMP, syp-GCaMP, syp-pHTomato, and homer-GCaMP in the calyx. Shown are anti-syt immunoreactivity and anti-GFP or
anti-RFP immunoreactivity.
(D) Immunostaining of cytosolic GCaMP, syp-GCaMP, syp-pHTomato, and homer-GCaMP in the AL. Shown are synaptic co-stainings and anti-GFP or anti-RFP
immunoreactivity.
(E–I) High-resolution STED microscopy images of a single bouton in the calyx. Shown are a merge and the individual channels of anti-GFP immunoreactivity of
syp-GCaMP and either anti-syt immunoreactivity (E) or immunoreactivity against the active zone protein Bruchpilot (nc82) (F). Immunoreactivity of syp-pHTomato
and either anti-syt immunoreactivity (G) or immunoreactivity against Bruchpilot (nc82) (H). Arrowheads point to regions of co-localization in clusters of vesicles.
(I) Shown are a merge, anti-DLG immunoreactivity, and anti-GFP immunoreactivity of homer-GCaMP.
(J) High-resolution detail within a glomerulus of the AL, shown as a merge, and individual anti-DLG immunoreactivity and anti-GFP immunoreactivity of homerGCaMP. Arrowheads point to co-localization.
The scale bars represent 20 mm in (C) and (D), 1 mm in (E)–(I), and 2 mm in (J).
Cell Reports 10, 2083–2095, March 31, 2015 ª2015 The Authors 2085
�whereas homer-GCaMP punctae are diffusely distributed across
the CA (Figure 2C) in accordance with the microanatomy of
calycal boutons (Yasuyama et al., 2002; Leiss et al., 2009;
Butcher et al., 2012). In addition, this staining pattern might partly
reflect postsynapses of the APL neuron in the CA. Furthermore,
we analyzed the localization of all constructs in the main OPN
input region, the AL. Cytosolic GCaMP is present throughout
neuronal ramifications within the AL, whereas the presynaptically
targeted sensors are confined to irregularly shaped and heterogeneously distributed punctae within the AL’s glomeruli (Figure 2D). By contrast, homer-GCaMP is localized to punctae
that are not only much more numerous but also smaller and
more densely distributed, in accordance with the fine mesh of
dendritic processes pervading the glomeruli (Figure 2D). To visualize the subcellular localization of the sensors, we used high resolution STED microscopy (Figures 2E–2J). Within individual boutons in the CA, an accumulation of syp-GCaMP or of syppHTomato punctae was evident in distinct regions (Figures 2G
and 2J). These punctae reflect the accumulation of synaptic vesicles at active zones as they co-localize with anti-syt immunoreactivity (Figures 2E and 2G). In addition, they are localized
around and partially co-localize with immunoreactivity against
the active zone protein Bruchpilot (Wagh et al., 2006) (Figures
2F and 2H). These data confirm that both synaptophysincoupled constructs are targeted to presynaptic vesicles. STED
microscopy analysis further revealed that homer-GCaMP punctae are directly adjacent to or co-localize with anti-DLG, both in
the CA (Figure 2I) and the AL (Figure 2J). In conclusion, homerGCaMP localizes to substructures of the complex postsynaptic
matrix. We also confirmed the correct localization of the
three sensors in motor neurons of the larval body wall. Again,
syp-GCaMP and syp-pHTomato are located presynaptically in
the boutons of neuromuscular junctions and co-localize with
anti-syt immunoreactivity (Figures S1A and S1B). In contrast,
homer-GCaMP is absent from presynaptic boutons but is detected in dendritic structures of motor neurons within the ventral
ganglion of the larval CNS (Figure S1C).
To test whether the expression of the sensors affects the
morphology of synaptic boutons, we expressed the constructs
in larval motor neurons and determined the number and size of
boutons at NMJ6/7 in segment A3 using anti-DLG or anti-syt immunostaining (Figure S1D). No differences in either the number
or size of both type Ib and type Is boutons were observed
when compared to w1118 larvae (Figure S1E). To further test
whether the sensors cause any functional impairment, we expressed the constructs ubiquitously in all cells and quantified
synaptic vesicle recycling via FM (styryl) dye uptake and release
(Kuromi and Kidokoro, 1999). FM dye is taken up during stimulation and therefore serves as a measure for the size of the vesicle
population that undergoes recycling. Further stimulation in
absence of the dye releases it from these vesicles (termed FM
destaining), thereby providing an estimate for the exocytosis kinetics. Neither synaptic targeting of GCaMP nor syp-pHTomato
expression altered FM dye uptake compared to the respective
controls (Figure S1F). FM dye destaining was also unaffected
(Figure S1G). We further tested the performance of such animals
in two behavioral assays. We found neither an overall morphological aberration of larvae (Figure S2A) nor a behavioral deficit
in a larval chemotaxis assay (Figure S2B). Moreover, the
morphology of adult animals and their brains were indistinguishable from those of control animals and the flies behaved normally
in a negative geotaxis assay (Figures S2C and S2D). In conclusion, we did not detect any interference of the three constructs
with neuronal function.
Functionality of the Synaptic Sensors
To compare the functionality of the synaptic sensors in reporting
pre- or postsynaptic Ca2+ influx, or vesicle exocytosis, we expressed the DNA constructs in OPNs and used in vivo wide-field
imaging to monitor the fluorescence within the entire AL and CA
neuropils. KCl-induced neuronal depolarization caused clear increases in fluorescence emission in either sensor (Figure S3).
The relative changes in fluorescence intensity of syp-GCaMP exceeded that of cytosolic GCaMP3, whereas homer-GCaMP
showed smaller signal amplitudes when compared to cytosolic
GCaMP (Figures S3A and S3B). Because all GECIs share the
same Ca2+ sensor and differ only in their subcellular localization,
the differential amplitudes reflect differential contributions from
sources of Ca2+ influx in pre- and postsynaptic compartments.
The red syp-pHTomato displayed relative changes in fluorescence and a signal-to-noise ratio within a similar range when
compared with synaptopHluorin (Ng et al., 2002) (Figure S3C).
Two-Photon Imaging of Odor-Induced Synaptic Activity
We next tested whether the synaptically targeted sensors can be
used to monitor synaptic activity induced by physiological, sensory stimuli in largely intact animals. Odor-induced activity of
presynaptic boutons of OPNs in the CA was monitored using
two-photon microscopy. The baseline fluorescence of both synaptophysin-coupled sensors clearly demarcated individual
presynaptic boutons (Figures S4A and S4F). The animals were
stimulated with methyl cyclohexanol (MCH) and 3-octanol
(3Oct) while monitoring either Ca2+ transients or synaptic vesicle
release. Syp-GCaMP reliably reported presynaptic Ca2+ influx,
and syp-pHTomato reliably reported increased vesicle exocytosis, both across many synapses and at the subcellular level
(Figures S4A–S4J; Movie S1). The odor-induced fluorescence
change of both sensors was characterized by a sharp peak
upon odor onset, followed by decay already as soon as during
odor stimulation (Figures S4D and S4I), and some boutons responded specifically to odor offset (Figures S4B, S4C, and
S4H). Odor on- and offset Ca2+ transients in mutually exclusive
OPNs might be attributed to a release of inhibition via recurrent
interneurons in the AL (Silbering et al., 2008) and/or direct feedback from the LH and the MB lobes to the calycal boutons. The
spatiotemporal, combinatorial nature of odor representations
across OPNs (Wilson, 2013) is, therefore, reflected also at
the level of presynaptic activity. As syp-pHTomato displayed
increased fluorescence at few and distinct regions at the borders
of individual boutons (Figure S4J), it provides a tool to visualize
transmission events that are spatially confined to individual
active zones in a given focal plane.
To record postsynaptic odor representations using homerGCaMP, we focused on the AL. Baseline fluorescence clearly
demarcated individual glomeruli (Figure S4K). Homer-GCaMP
reported odor-induced Ca2+ transients reliably in postsynapses
2086 Cell Reports 10, 2083–2095, March 31, 2015 ª2015 The Authors
�within overlapping subsets of glomeruli (Figures S4K–S4M).
In addition to Ca2+ transients induced by odor onset,
homer-GCaMP also reported spontaneous Ca2+ activity (Movie
S2) and Ca2+ transients induced by odor offset signaling
(e.g., glomerulus DL1 shown in Figures S4L and S4M). These
complex activation patterns of distinct glomeruli were stereotypic across individuals in terms of the amplitudes and kinetics
of odor-evoked responses (e.g., glomerulus DL4 shown in
Figure S4N).
Concurrent Imaging of Presynaptic Ca2+ Dynamics and
Synaptic Transmission
Next, we tested whether syp-GCaMP and syp-pHTomato can be
used to monitor two physiological parameters simultaneously.
We co-expressed both constructs in OPNs and focused again
on presynaptic boutons in the CA. Immunohistochemical staining confirmed that both constructs were targeted to the same
boutons (Figure 3A). The fluorescence emitted by the two sensors co-localized completely in vivo as well, although baseline
fluorescence intensities differed slightly across distinct boutons
(Figure 3B). We analyzed comparatively the fluorescence emission changes of both reporters in response to the odors, MCH
and 3Oct, in individual presynaptic boutons (Figures 3C and
3D). Syp-GCaMP and syp-pHTomato showed odor-induced increases in fluorescence emission in equivalent boutons. The
exact kinetics of fluorescence changes, however, differed between the two emission wavelengths, as expected for the
different properties of the sensors and the parameters measured
(Figures 3C and 3D).
We focused next on OPN presynapses in the AL, where the
stereotypic neuronal connectivity across individuals allowed
the comparison of identical neurons with respect to their odorresponse profiles, i.e., identifiable glomeruli. Both presynaptic
constructs co-localize in the AL, which was confirmed with
immunohistochemical labeling and was also visible in vivo (Figures 3E and 3F). Both reporters showed odor-induced increases
in fluorescence emission, as shown for glomerulus DL4 (Figure 3G). Again, the overall odor-induced glomerular activity patterns, the relative amplitudes, and the time courses were a close
match in presynaptic Ca2+ and synaptic transmission (Figure 3H).
Baseline fluctuations of syp-pHTomato emission differed between glomeruli, indicating that different OPNs exhibit different
spontaneous vesicle release rates. The VA1 glomerulus, for
example, showed comparably high spontaneous vesicle exocytosis that was reduced during odor presentations (Figure 3H). In
order to characterize the relation between presynaptic Ca2+ and
vesicle release, we analyzed MCH-induced signals in the DL4
glomerulus in detail. The relation between syp-pHTomato and
syp-GCaMP signals could most accurately be described by
the sigmoid function y = a1 + (a2 a1)/(1 + 10 (logx0 x) p) (Figure 3I). The obtained function also described the fluorescence
signals induced by the different odors in the same glomerulus
(Figure 3I) and reflected different phases of stimulus-induced
activity. The slope of the bottom asymptote indicates basal fluctuations of the pHTomato signal, e.g., spontaneous transmitter
release. The fact that there is a top asymptote reflects that transmitter release persists on top of elevated activity. This indicates
that we optically recorded synaptic activity within the dynamic
ranges of the sensors and that the odor responses recorded
were below a range in which vesicle pool size and recruitment
become limiting factors.
Concurrent Imaging of Postsynaptic Ca2+ and
Presynaptic Vesicle Release
Next, we combined the syp-pHTomato with homer-GCaMP and
co-expressed both sensors in OPNs, again focusing on the AL.
Homer-GCaMP and syp-pHTomato were spatially segregated
from each other. Only very rarely was co-localization detected
(Figure 4A), although both constructs were targeted to the
same set of glomeruli. The separated localization at only marginally overlapping structures was also observed with the in vivo
baseline fluorescence and became most obvious when focusing
on subglomerular structures in individual glomeruli, e.g., DL4
(Figures 4B and 4C). OPNs innervating DL4 respond to both
MCH and 3Oct, with both postsynaptic Ca2+ increase and
presynaptic vesicle exocytosis (Figure 4D). When all glomeruli
within this focal plane were analyzed, the odor-induced combinatorial activity pattern, the relative amplitudes, and duration of
glomerular activation of postsynaptic Ca2+ and presynaptic
transmission were a close match in most cases (Figures 4D
and 4E). Similarly as with presynaptic Ca2+ transients, the relation between postsynaptic Ca2+ and presynaptic vesicle release
within the same neurons is best described by a sigmoid function
(Figure 4F).
To further substantiate that syp-pHTomato reliably reports
vesicle exocytosis independently of co-expressed Ca2+ sensors,
we expressed syp-pHTomato and homer-GCaMP together with
temperature-dependent shibirets (Kitamoto, 2001) to disrupt
vesicle-recycling reversibly. Switching the temperature at the
fly’s brain to the restrictive temperature of shibirets diminished
odor-induced syp-pHTomato signals while leaving homerGCaMP signals unaffected (Figure S5). These experiments
demonstrate that homer-GCaMP and syp-pHTomato can be
used concurrently to differentiate, spatially and functionally, preand postsynaptic signaling within the same neurons, even in
such dense aggregations of synapses as a glomerulus of the AL.
Differential Experience-Dependent Synaptic Plasticity
in the AL
We asked whether the targeted sensors can be used to detect
experience-dependent, physiological plasticity at synapses of
the central brain. As a first step, we used artificial, chronic deprivation of synaptic transmission, which has been shown to
induce structural changes at OPN synapses (Kremer et al.,
2010). We restricted the artificially induced block of synaptic
transmission to the flies’ post-eclosion stage and used heatsensitive shibirets to transiently prevent vesicle recycling of
OPNs for 5 days after eclosion. Subsequently, flies recovered
at the permissive temperature and we then imaged the responses of the synaptically targeted sensors to two monomolecular odors and two complex blends of fruit in the AL and
the CA (Figures 5 and 6) at the permissive temperature. In the
AL, we compared odor responses in glomeruli DC1, DM3, and
DL5, which respond to MCH, 3Oct, and apple and banana,
respectively, using either a dual color combination of pre- or
postsynaptic Ca2+ sensors and syp-pHTomato (Figures 5A
Cell Reports 10, 2083–2095, March 31, 2015 ª2015 The Authors 2087
�Figure 3. Concurrent Imaging of Presynaptic Ca2+ and Vesicle Release
(A) Co-expression of syp-GCaMP and syp-pHTomato in calycal boutons of OPNs. Blue, anti-synaptotagmin; magenta, syp-pHTomato detected by anti-RFP; green,
syp-GCaMP detected by anti-GFP. The inset shows a magnification of one bouton; white color indicates co-localization.
(B) In vivo fluorescence of syp-pHTomato and syp-GCaMP in OPNs within the calyx.
(C) Odor-induced fluorescence change of syp-GCaMP (green) and syp-pHTomato (magenta) in one individual bouton (indicated by orange circle in B).
(D) Dynamics of fluorescence changes of syp-GCaMP (left) and syp-pHTomato (right) in 20 individual boutons. Each row of the heatmaps represents one bouton,
each column one 200-ms time frame.
(E) Co-expressed syp-GCaMP and syp-pHTomato in the AL. The inset shows a magnification within one glomerulus; white color indicates co-localization.
(F) In vivo fluorescence of syp-pHTomato and syp-GCaMP. Glomerulus DL4 is indicated by the orange circle.
(G) Odor-induced fluorescence change of syp-GCaMP (green) and syp-pHTomato (magenta) in DL4.
(H) Fluorescence changes over time of syp-GCaMP (left) and syp-pHTomato (right) in nine glomeruli. Each row represents one glomerulus, each column one 250ms time frame.
(I) The gray and black lines indicate the time course of fluorescence change in syp-GCaMP as a function of fluorescence change in syp-pHTomato during odor
stimulation in DL4. The red line shows the sigmoid fit with the adjusted R2 values for MCH and 3Oct. Heatmaps display the mean, traces the mean, and SEM of
three stimulations.
d, dorsal; l, lateral; p, posterior; scale bars: 20 mm; in insets: 2 mm.
2088 Cell Reports 10, 2083–2095, March 31, 2015 ª2015 The Authors
�Figure 4. Concurrent Imaging of Postsynaptic Ca2+ and Vesicle Release
(A) Co-expression of homer-GCaMP and syp-pHTomato in OPNs in the AL. Blue, anti-syt; magenta, syp-pHTomato detected by anti-RFP; green, homer-GCaMP
detected by anti-GFP. The inset shows a magnification of one glomerulus; white color indicates regions of co-localization.
(B) Individual and merged in vivo syp-pHTomato and homer-GCaMP fluorescence in OPNs in the AL.
(C) DL4 is indicated in orange and magnified.
(D) Odor-induced fluorescence change of homer-GCaMP (green) and syp-pHTomato (magenta) in DL4 (mean and SEM of three stimulations).
(E) Dynamics of fluorescence changes over time of homer-GCaMP (left) and syp-pHTomato (right) in ten glomeruli. Each row of the heatmaps represents one
glomerulus, each column one 250-ms time frame. Pixel values represent the mean of three stimulations.
(F) Relation of dynamic fluorescence changes of homer-GCaMP and syp-pHTomato evoked by MCH and 3Oct. The red line shows a sigmoid fit across data
points in DL4, with the adjusted R2 values displayed for MCH and 3Oct.
The scale bars represent 20 mm in (A) and (B) and 2 mm in the insets (A) and (C). See also Figure S5.
and 5B). Odor-induced synaptic signaling was compared to siblings that were raised in parallel at the restrictive temperature
but that did not express shibirets. As a further control, we raised
animals with or without shibirets expression at the permissive
temperature (Figure 5C). The 5-day deprivation of synaptic
output did not lead to any alteration in presynaptic Ca2+
signaling of OPNs in the AL (Figure 5D) but reduced drastically
the amplitudes of postsynaptic Ca2+ transients (Figure 5E).
Vesicle exocytosis was not altered under any experimental condition, although we found that animals that expressed shibirets
showed a slight, but not significant, reduced transmission
when raised at either the restrictive or the permissive temperature (Figure 5F). Although presynaptic Ca2+ signaling was not
altered in the AL, when focusing on individual boutons of the
main OPN output site in the CA, syp-GCaMP reported significantly reduced presynaptic Ca2+ signaling evoked by all four
odorants used (Figures 6A–6C). This indicates that presynaptic
Ca2+ dynamics within spatially separated domains in different
neuropils, but in the same neurons, can be modulated independently. In contrast, altered vesicle exocytosis monitored using
syp-pHTomato was not detectable in the CA under any experimental condition (Figure 6D). A more-detailed analysis of boutons in the CA revealed that the prolonged deprivation of synaptic transmission from OPNs led to increased bouton sizes,
which is in accordance with the findings of Kremer et al.
(2010) (Figure 6E). We did not find any difference in the relative
Cell Reports 10, 2083–2095, March 31, 2015 ª2015 The Authors 2089
�Figure 5. Activity-Dependent Plasticity of Postsynaptic Ca2+ in the AL
(A) In vivo fluorescence of syp-GCaMP (left) and syp-pHTomato (center) expressed together with shibirets in OPNs. Glomeruli DC1, DM3, and DL5 show changes
in fluorescence upon stimulation with MCH, 3Oct, apple, or banana odor, as shown in the bottom row for syp-GCaMP.
(B) In vivo fluorescence of homer-GCaMP (left) and syp-pHTomato (center) expressed together with shibirets in OPNs. DC1, DM3, and DL5 show changes in
fluorescence upon stimulation with MCH, 3Oct, apple, or banana odor, as shown in the bottom row for homer-GCaMP.
(C) Experimental protocol to study the effects of prolonged deprivation of transmission from OPNs. All flies express syp-pHTomato, along with either the pre- or
the postsynaptic Ca2+ sensor in OPNs, and were imaged at 23� C.
(D) Odor-evoked changes in syp-GCaMP fluorescence in the four experimental groups in the glomeruli DC1 for MCH, DM3 for 3Oct, and DL5 for apple and
banana odor (top row) and the respective comparison of the maximal fluorescence change during odor stimulation (bottom row). n = 6–8.
(E) Odor-evoked changes in homer-GCaMP fluorescence in the four experimental groups in DC1 for MCH, DM3 for 3Oct, and DL5 for apple and banana odor (top
row) and the respective comparison of the maximal fluorescence change during odor stimulation (bottom row). n = 6–7.
(F) Dynamics and maximal change of simultaneously monitored syp-pHTomato fluorescence. Flies co-expressing either syp-GCaMP or homer-GCaMP were
pooled; n = 12–15. All traces indicate mean values; box plots indicate medians, interquartile ranges, and 10%/90% range.
The scale bars represent 20 mm; n.s., p > 0.025; *p < 0.025; two-sample t test.
amount of syp-GCaMP fluorescence per bouton, which suggests that the total number of vesicles per bouton was not
altered (Figure 6E).
The differential changes in synaptic activity of OPNs induced
by artificial deprivation mimic those induced by a natural
experience. We exposed the animals for 5 days during early
2090 Cell Reports 10, 2083–2095, March 31, 2015 ª2015 The Authors
�Figure 6. Activity-Dependent Plasticity of
Presynaptic Ca2+ in the Calyx
(A and B) In vivo fluorescence in the calyx of a fly
(A) that expresses both syp-GCaMP (left) and syppHTomato (center) in OPNs. Indicated by black
lines are 20 bouton regions, some of which show
fluorescence changes upon stimulation with either
MCH, 3Oct, apple, or banana, as shown in (B) for
syp-GCaMP.
(C) Dynamics of odor-evoked syp-GCaMP fluorescence in animals with or without shibirets
expression and with or without prolonged maintenance at restrictive (32� C) or permissive (25� C)
temperature. Dynamics of fluorescence changes
in the most-responsive bouton for each odor (top
row) and the respective maximal fluorescence
change during odor stimulation (bottom row) are
shown.
(D) Dynamics and maximal change of simultaneously monitored syp-pHTomato fluorescence.
n = 6–8. Traces show mean values; box
plots indicate medians, interquartile ranges, and
10%/90% range.
(E) Quantification of the bouton areas and the
relative amount of GCaMP per bouton for the four
experimental groups. Shown are the mean and
SEM. Sample sizes of animals (bold) and of boutons (regular) are indicated within the bars.
The scale bars represent 20 mm; n.s., p > 0.025;
*p < 0.025; two-sample t test.
adulthood to a multimodal, including olfactory, cue by raising
them on a piece of apple. This treatment typically causes
behavioral adaptation and reduced responsiveness to the
exposed odor (Sachse et al., 2007; Das et al., 2011). Subsequently, we compared odor responses of the respective sensors in these animals with odor responses in animals that
were raised without apple (Figure 7A). We focused again on
glomeruli DC1, DM3, and DL5 of the AL, using a dual color
combination of either pre- or postsynaptic Ca2+ sensors and
syp-pHTomato. As was the case in the artificial deprivation
experiment, we did not observe any experience-dependent
change in presynaptic Ca2+ signaling in the AL (Figure 7B).
The amplitudes of postsynaptic Ca2+ transients, however,
were clearly reduced in the appleresponsive glomerulus DL5 only in those
animals that were raised on apple. In
contrast to the deprivation experiment,
this decrease in postsynaptic signaling
induced by exposure to the apple odor
was glomerulus specific. Syp-pHTomato
signals of OPNs in the AL were also in
this experiment unaltered (Figure 7D).
We further repeated the experiment
and compared flies that expressed either
cytosolic or postsynaptically targeted
GCaMP. We found that cytosolic-expressed GCaMP, in contrast to homerGCaMP, did not report the DL5-specific
reduction in postsynaptic Ca2+ (Figure S6). In conclusion, the localized sensor proteins are appropriate to optically dissect distinct parameters of synaptic
signaling in pre- or postsynaptic compartments and to confine
experience-dependent, synaptic plasticity to pre- and postsynaptic compartments.
DISCUSSION
Approaches to the detection of physiological parameters underlying synaptic functioning in real time, in vivo, and across many
synapses are important for understanding the principles governing the ways in which neural circuits accomplish signal integration, learning, and memory. Presynaptically targeted GECIs
Cell Reports 10, 2083–2095, March 31, 2015 ª2015 The Authors 2091
�Figure 7. Experience-Dependent Plasticity
of Postsynaptic Ca2+ in the AL
(A) Experimental protocol to study the effects of
prolonged exposure to apple odor. All flies tested
expressed syp-pHTomato along with either the
pre- or the postsynaptic Ca2+ sensor in OPNs.
Flies were transferred for 5 days to standard food
containing 5 g of apple. A second group of siblings
was raised on standard food only.
(B) Odor-evoked syp-GCaMP fluorescence
changes of the two experimental groups in
glomerulus DC1 for MCH, in DM3 for 3Oct, and in
DL5 for apple and banana (top row) and the
respective maximal fluorescence changes during
odor stimulation (bottom row). n = 8.
(C) Odor-evoked homer-GCaMP fluorescence
changes in DC1 for MCH, in DM3 for 3Oct, and in
DL5 for apple and banana (top row) and the
respective maximal fluorescence changes during
odor stimulation (bottom row). n = 6–7.
(D) Odor-evoked syp-pHTomato fluorescence
changes in DC1 for MCH, in DM3 for 3Oct, and
in DL5 for apple and banana (top row) and
the respective maximal fluorescence change
during odor stimulation (bottom row). Flies coexpressing either syp-GCaMP or homer-GCaMP
were pooled; n = 14–15. Traces show mean values
and SEM; box plots indicate medians, interquartile
ranges, and 10%/90% range.
n.s., p > 0.05; *p < 0.05; two-sample t test. See
also Figure S6.
have been successfully used to monitor presynaptic Ca2+
signaling in vertebrate systems, (e.g., Dreosti et al., 2009; Zhao
et al., 2011a; Li et al., 2011; Akerboom et al., 2012; Walker
et al., 2013). Furthermore, synaptic transmission can be visualized using pH-sensitive fluorophores targeted to the lumen of
synaptic vesicles (Miesenböck et al., 1998; Granseth et al.,
2006; Zhu et al., 2009; Li and Tsien, 2012). Whereas Ca2+ dynamics are frequently monitored in the dendrites and postsynaptic spines of mammalian cultured neurons or brain sections
(Denk et al., 1996; Oertner, 2002), specific sensors tagged to
the postsynaptic density have not been described. So far, postsynaptic Ca2+ dynamics have been measured solely in muscle
cells, at the neuromuscular junction of larval Drosophila. For
this purpose, GECIs were introduced between the transmembrane domain of CD8 and the DLG-interacting domain of the
K+ channel Shaker (Guerrero et al., 2005; Peled et al., 2014).
Whereas Drosophila represents a key model organism to dissect
the neuronal circuits that underlie stimulus processing and
behavior (Venken et al., 2011), there is still a lack of efficient techniques to visualize synaptic activity in the brain. We generated
transgenic fly lines to overcome these limitations.
First, presynaptic Ca2+ is detected using a synaptophysincoupled GCaMP3 construct. Ca2+ has multiple functions in presynaptic terminals and also multiple locations, comprising high
Ca2+ concentration nano- and microdomains around voltagegated channels and more-global, intraterminal Ca2+ (Neher
and Sakaba, 2008), and all contribute to the signals monitored
using targeted GECIs. In vertebrate neurons, the molar quantity
of Ca2+ and its spatial diffusion is highly variable among neurons
and even among boutons of the same axon. In neocortical
presynaptic boutons of different mammalian tissues, for
example, action-potential-induced and volume-averaged Ca2+
changes cover an estimated range of peak concentrations
from 300 nM to 1,000 nM (e.g., Koester and Sakmann, 2000;
Dreosti et al., 2009; Vaithianathan and Matthews, 2014). The dynamic range (�100 nM–�10,000 nM) and KD (�600 nM) of
GCaMP3 (Tian et al., 2009) is within this concentration range.
It should be noted, however, that the peak Ca2+ concentration
at the active zone of some specialized synapses may exceed
10 mM (e.g., Bollmann et al., 2000). A very local saturation of
GCaMP3 can, therefore, under respective experimental conditions, not be excluded. GCaMP3 shows a relatively strong
baseline fluorescence compared to other recently reported
GCaMP variants (Akerboom et al., 2012; Chen et al., 2013;
Zhao et al., 2011b), which is crucial for the detection of the small
and often dispersed structures in vivo (see also Mao et al.,
2008). Second, we apply the red pHTomato coupled to
Synaptophysin (Li and Tsien, 2012) to the central brain of
Drosophila. This sensor is equally effective regarding presynaptic localization, relative changes in fluorescence, and signal-tonoise ratio when compared to synaptopHluorin that has
been used in Drosophila (Ng et al., 2002). In response to physiological stimuli, amplitudes of fluorescence changes and signal
to noise are small, however, due to the stochastic nature of exoand endocytosis events and the small percentage of ready
releasable vesicles (Sankaranarayanan et al., 2000, Denker
et al., 2011). However, in combination with green fluorescent
Ca2+ sensors, this sensor is helpful in identifying and differentiating pre- and postsynaptic compartments and in analyzing the
physiological properties of synaptic function by correlating
2092 Cell Reports 10, 2083–2095, March 31, 2015 ª2015 The Authors
�synaptic vesicle release to synaptic Ca2+ influx. Third, we report
homer-GCaMP as a postsynaptic Ca2+ sensor encompassing
Ca2+ sources that can potentially derive from ligand-gated ionotropic receptors, voltage-gated Ca2+ channels of the postsynaptic membrane, or internal Ca2+ stores.
The olfactory pathway of the Drosophila central brain provides an advantageous test system due to the combinatorial
nature of odor representations across anatomically and functionally well-characterized populations of neurons (Wilson,
2013). We demonstrate that the monitoring of pre- and postsynaptic Ca2+ dynamics is readily feasible, as is that of synaptic
transmission across populations of synapses and within individual synaptic boutons. Experience-dependent plasticity of
synaptic signaling in the AL has been proposed as a contributor
to decreasing behavioral responsiveness following prolonged
odor exposure (Sachse et al., 2007; Das et al., 2011), but tools
to confirm this assumption have been lacking. Here, we show
that the targeted sensors are appropriate to bridge that gap.
The targeted sensors allow one not only to detect synaptic
plasticity but also to tease apart experimentally the underlying
signaling at the pre- and postsynapse within a complex circuit.
The decrease in postsynaptic activity in OPNs caused by
prolonged odor stimulation can be mimicked by artificially
silencing OPN output. This indicates that olfactory adaptation
is accompanied by a decrease in OPN activity, which might
be mediated by plasticity of inhibitory local interneurons,
as suggested by Das et al. (2011). This reduction of the postsynaptic Ca2+ in the AL is reflected by a reduction of presynaptic Ca2+ signaling in the CA, but not in the AL. Post- and
presynaptic Ca2+ influxes in OPNs are, therefore, modulated
independently. A large number of non-associative, associative,
and complex learning paradigms have been described in
Drosophila. The establishment of a method to monitor physiological parameters of synaptic activity in vivo in a largely intact
animal provides a possibility to uncover synaptic plasticity underlying neuronal circuit processing and experience-dependent, adaptive behavior.
EXPERIMENTAL PROCEDURES
Generation of DNA Constructs and Transgenic Flies
The DNA of synaptophysin-GCaMP3 was obtained from S. Voglmaier and inserted into the pUAST vector. The DNA of pHTomato was obtained from Y. Li,
cloned into the intravesicular domain of Synaptophysin, and inserted into
pUAST. cDNA of dHomer was amplified from w1118 flies and inserted with
a C-terminal-linked GCaMP3 into pUAST. A detailed description of procedures
is provided in the Supplemental Experimental Procedures, along with a list of
transgenic fly stocks used.
Immunohistochemistry
Brains of 3- to 6-day-old female flies or larval filets of third instar larvae were
prepared and immunostained as described in detail in the Supplemental
Experimental Procedures.
Confocal Imaging
Stacks of confocal images were generated using a confocal microscope
(Leica) with a 203/NA = 0.7 objective for whole brain scans and a 633/NA =
1.4 objective for neuropils or larval motor neurons. A detailed description of
image acquisition and analysis is provided in the Supplemental Experimental
Procedures.
Two-Color STED Microscopy
Immunohistochemically stained brains were embedded in a polymer resin, cut
into 50–60 nm sections, and imaged using a STED microscope (Leica) equipped with a 1003/NA = 1.4 oil immersion objective. Sample preparation was
performed as described in Revelo et al. (2014), with modifications described
in the Supplemental Experimental Procedures.
Wide-Field Imaging
Brains of female transgenic flies (5 days old) were imaged at 5 Hz through a
window in the head capsule using a fluorescence microscope (Zeiss) equipped
with a 203/NA = 1 water-immersion objective. KCl was injected into the
Ringer’s solution covering the brain (final concentration �0.05 M). Imaging
and quantification of fluorescence changes are described in detail in the Supplemental Experimental Procedures.
Two-Photon Imaging
Stimulus-induced fluorescence changes in brain regions of female transgenic
flies (3–6 days old) were imaged through a window in the head capsule at a
frame rate of 4 or 5 Hz using a LSM 7MP two-photon microscope (Zeiss) equipped with a mode-locked Ti-sapphire laser (Coherent) and a 203/NA = 1 waterimmersion objective. All sensors were excited at 950 nm, and a dichroic mirror
was combined with a 500- to 550-nm and a 575- to 610-nm BP filter to record
GCaMP and pHTomato simultaneously. Imaging procedures, preparation,
stimulus delivery, temperature control under the microscope, and image analysis is provided in the Supplemental Experimental Procedures.
Deprivation Experiments and Apple-Exposure Experiment
Detailed experimental protocols are provided in the Supplemental Experimental Procedures.
Behavioral Assays
Groups of �20 third instar larvae were scored according to their chemotaxis
toward an odor. Geotaxis was quantified in mixed populations of 20 flies,
4–6 days old, as described by Benzer (1967) with modifications described
by Inagaki et al. (2010). Details for both assays are provided in the Supplemental Experimental Procedures.
FM Dye Experiments
Filets of third instar larvae were loaded with dye in high-potassium medium
(see Supplemental Experimental Procedures for details) for 30 s, washed,
and subsequently stimulated several times with 20-Hz trains of 100 mA for
10 s. Images of boutons at the neuromuscular junction were recorded and
analyzed as described in the Supplemental Experimental Procedures.
Statistical Analysis
Data were tested for normal distribution using the Kolmogorov-Smirnov test.
For comparing multiple groups, a one-way ANOVA was used. In the case of
significance, the data were subjected to post hoc pairwise comparison using
the two-sample Student’s t test and p values were Bonferroni corrected. To
test for difference to a fixed value, the Wilcoxon signed rank test was used.
For determining the relation of DF/F0 values obtained from two wavelength
channels, different models of the least square fit were compared by means
of R2 values, the Akaike information criterion (Akaike, 1974), and the Bayesian
information criterion (Schwarz, 1978).
SUPPLEMENTAL INFORMATION
Supplemental Information includes Supplemental Experimental Procedures,
six figures, and two movies and can be found with this article online at
http://dx.doi.org/10.1016/j.celrep.2015.02.065.
AUTHOR CONTRIBUTIONS
A.F. and U.P. designed the study, interpreted the results, and wrote the manuscript. U.P. performed all experiments and analyzed the data, except for STED
microscopy and FM dye experiments. N.H.R. and U.P. performed and
Cell Reports 10, 2083–2095, March 31, 2015 ª2015 The Authors 2093
�analyzed STED experiments, supervised by S.O.R. K.J.S. and S.O.R. performed and analyzed FM dye experiments. A.F. supervised the entire study.
Dreosti, E., Odermatt, B., Dorostkar, M.M., and Lagnado, L. (2009). A genetically encoded reporter of synaptic activity in vivo. Nat. Methods 6, 883–889.
ACKNOWLEDGMENTS
Granseth, B., Odermatt, B., Royle, S.J., and Lagnado, L. (2006). Clathrin-mediated endocytosis is the dominant mechanism of vesicle retrieval at hippocampal synapses. Neuron 51, 773–786.
We thank Erich Buchner, Susan M. Voglmaier, Yulong Li, Stephen F. Heinemann, Hiromu Tanimoto, and Gero Miesenböck for providing fly strains,
DNA constructs, or antibodies. We thank Tobias Mühmer, Jan Hoffmann,
and Mandy Jauch for technical help and J. Böker and S. Castellón for
assistance in fly care. This work was supported by the Deutsche Forschungsgemeinschaft (SFB 889/B04) and the German Ministry of Research and Education via the Bernstein Center for Computational Neuroscience Göttingen
(01GQ1005A) to A.F. and by the European Research Council (ERC-2013CoG NeuroMolAnatomy), the Deutsche Forschungsgemeinschaft (Cluster of
Excellence Nanoscale Microscopy and Molecular Physiology of the Brain
CNMPB and SFB889), and the Niedersachsen-Israeli Research Cooperation
Program to S.O.R.
Received: October 15, 2014
Revised: January 24, 2015
Accepted: February 26, 2015
Published: March 26, 2015
REFERENCES
Akaike, H. (1974). A new look at the statistical model identification. IEEE Trans.
Automat. Contr. 19, 716–723.
Akerboom, J., Chen, T.W., Wardill, T.J., Tian, L., Marvin, J.S., Mutlu, S., Calderón, N.C., Esposti, F., Borghuis, B.G., Sun, X.R., et al. (2012). Optimization
of a GCaMP calcium indicator for neural activity imaging. J. Neurosci. 32,
13819–13840.
Benzer, S. (1967). BEHAVIORAL MUTANTS OF Drosophila ISOLATED BY
COUNTERCURRENT DISTRIBUTION. Proc. Natl. Acad. Sci. USA 58, 1112–
1119.
Bollmann, J.H., Sakmann, B., and Borst, J.G. (2000). Calcium sensitivity of
glutamate release in a calyx-type terminal. Science 289, 953–957.
Brand, A.H., and Perrimon, N. (1993). Targeted gene expression as a means of
altering cell fates and generating dominant phenotypes. Development 118,
401–415.
Butcher, N.J., Friedrich, A.B., Lu, Z., Tanimoto, H., and Meinertzhagen, I.A.
(2012). Different classes of input and output neurons reveal new features in
microglomeruli of the adult Drosophila mushroom body calyx. J. Comp.
Neurol. 520, 2185–2201.
Chen, T.W., Wardill, T.J., Sun, Y., Pulver, S.R., Renninger, S.L., Baohan, A.,
Schreiter, E.R., Kerr, R.A., Orger, M.B., Jayaraman, V., et al. (2013). Ultrasensitive fluorescent proteins for imaging neuronal activity. Nature 499, 295–300.
Christiansen, F., Zube, C., Andlauer, T.F., Wichmann, C., Fouquet, W., Owald,
D., Mertel, S., Leiss, F., Tavosanis, G., Luna, A.J., et al. (2011). Presynapses in
Kenyon cell dendrites in the mushroom body calyx of Drosophila. J. Neurosci.
31, 9696–9707.
Das, S., Sadanandappa, M.K., Dervan, A., Larkin, A., Lee, J.A., Sudhakaran,
I.P., Priya, R., Heidari, R., Holohan, E.E., Pimentel, A., et al. (2011). Plasticity
of local GABAergic interneurons drives olfactory habituation. Proc. Natl.
Acad. Sci. USA 108, E646–E654.
Denk, W., Yuste, R., Svoboda, K., and Tank, D.W. (1996). Imaging calcium dynamics in dendritic spines. Curr. Opin. Neurobiol. 6, 372–378.
Denker, A., Bethani, I., Kröhnert, K., Körber, C., Horstmann, H., Wilhelm, B.G.,
Barysch, S.V., Kuner, T., Neher, E., and Rizzoli, S.O. (2011). A small pool of
vesicles maintains synaptic activity in vivo. Proc. Natl. Acad. Sci. USA 108,
17177–17182.
Diagana, T.T., Thomas, U., Prokopenko, S.N., Xiao, B., Worley, P.F., and
Thomas, J.B. (2002). Mutation of Drosophila homer disrupts control of locomotor activity and behavioral plasticity. J. Neurosci. 22, 428–436.
Grienberger, C., and Konnerth, A. (2012). Imaging calcium in neurons. Neuron
73, 862–885.
Guerrero, G., Reiff, D.F., Agarwal, G., Ball, R.W., Borst, A., Goodman, C.S.,
and Isacoff, E.Y. (2005). Heterogeneity in synaptic transmission along a
Drosophila larval motor axon. Nat. Neurosci. 8, 1188–1196.
Inagaki, H.K., Kamikouchi, A., and Ito, K. (2010). Methods for quantifying simple gravity sensing in Drosophila melanogaster. Nat. Protoc. 5, 20–25.
Kitamoto, T. (2001). Conditional modification of behavior in Drosophila by targeted expression of a temperature-sensitive shibire allele in defined neurons.
J. Neurobiol. 47, 81–92.
Koester, H.J., and Sakmann, B. (2000). Calcium dynamics associated with action potentials in single nerve terminals of pyramidal cells in layer 2/3 of the
young rat neocortex. J. Physiol. 529, 625–646.
Kremer, M.C., Christiansen, F., Leiss, F., Paehler, M., Knapek, S., Andlauer,
T.F., Förstner, F., Kloppenburg, P., Sigrist, S.J., and Tavosanis, G. (2010).
Structural long-term changes at mushroom body input synapses. Curr. Biol.
20, 1938–1944.
Kuromi, H., and Kidokoro, Y. (1999). The optically determined size of exo/endo
cycling vesicle pool correlates with the quantal content at the neuromuscular
junction of Drosophila larvae. J. Neurosci. 19, 1557–1565.
Leiss, F., Groh, C., Butcher, N.J., Meinertzhagen, I.A., and Tavosanis, G.
(2009). Synaptic organization in the adult Drosophila mushroom body calyx.
J. Comp. Neurol. 517, 808–824.
Leube, R.E. (1995). The topogenic fate of the polytopic transmembrane proteins, synaptophysin and connexin, is determined by their membrane-spanning domains. J. Cell Sci. 108, 883–894.
Li, Y., and Tsien, R.W. (2012). pHTomato, a red, genetically encoded indicator
that enables multiplex interrogation of synaptic activity. Nat. Neurosci. 15,
1047–1053.
Li, H., Foss, S.M., Dobryy, Y.L., Park, C.K., Hires, S.A., Shaner, N.C., Tsien,
R.Y., Osborne, L.C., and Voglmaier, S.M. (2011). Concurrent imaging of synaptic vesicle recycling and calcium dynamics. Front. Mol. Neurosci. 4, 34.
Mao, T., O’Connor, D.H., Scheuss, V., Nakai, J., and Svoboda, K. (2008). Characterization and subcellular targeting of GCaMP-type genetically-encoded
calcium indicators. PLoS One 3, e1796.
Miesenböck, G., De Angelis, D.A., and Rothman, J.E. (1998). Visualizing secretion and synaptic transmission with pH-sensitive green fluorescent proteins.
Nature 394, 192–195.
Neher, E., and Sakaba, T. (2008). Multiple roles of calcium ions in the regulation
of neurotransmitter release. Neuron 59, 861–872.
Ng, M., Roorda, R.D., Lima, S.Q., Zemelman, B.V., Morcillo, P., and Miesenböck, G. (2002). Transmission of olfactory information between three populations of neurons in the antennal lobe of the fly. Neuron 36, 463–474.
Oertner, T.G. (2002). Functional imaging of single synapses in brain slices. Exp.
Physiol. 87, 733–736.
Peled, E.S., Newman, Z.L., and Isacoff, E.Y. (2014). Evoked and spontaneous
transmission favored by distinct sets of synapses. Curr. Biol. 24, 484–493.
Revelo, N.H., Kamin, D., Truckenbrodt, S., Wong, A.B., Reuter-Jessen, K.,
Reisinger, E., Moser, T., and Rizzoli, S.O. (2014). A new probe for super-resolution imaging of membranes elucidates trafficking pathways. J. Cell Biol. 205,
591–606.
Riemensperger, T., Pech, U., Dipt, S., and Fiala, A. (2012). Optical calcium imaging in the nervous system of Drosophila melanogaster. Biochim. Biophys.
Acta 1820, 1169–1178.
Sachse, S., Rueckert, E., Keller, A., Okada, R., Tanaka, N.K., Ito, K., and Vosshall, L.B. (2007). Activity-dependent plasticity in an olfactory circuit. Neuron
56, 838–850.
2094 Cell Reports 10, 2083–2095, March 31, 2015 ª2015 The Authors
�Sankaranarayanan, S., De Angelis, D., Rothman, J.E., and Ryan, T.A. (2000).
The use of pHluorins for optical measurements of presynaptic activity.
Biophys. J. 79, 2199–2208.
Schwarz, G. (1978). Estimating the dimension of a model. Ann. Stat. 6,
461–464.
Silbering, A.F., Okada, R., Ito, K., and Galizia, C.G. (2008). Olfactory information processing in the Drosophila antennal lobe: anything goes? J. Neurosci.
28, 13075–13087.
Stocker, R.F., Heimbeck, G., Gendre, N., and de Belle, J.S. (1997). Neuroblast
ablation in Drosophila P[GAL4] lines reveals origins of olfactory interneurons.
J. Neurobiol. 32, 443–456.
Tantama, M., Hung, Y.P., and Yellen, G. (2012). Optogenetic reporters: Fluorescent protein-based genetically encoded indicators of signaling and metabolism in the brain. Prog. Brain Res. 196, 235–263.
Tian, L., Hires, S.A., Mao, T., Huber, D., Chiappe, M.E., Chalasani, S.H., Petreanu, L., Akerboom, J., McKinney, S.A., Schreiter, E.R., et al. (2009). Imaging
neural activity in worms, flies and mice with improved GCaMP calcium indicators. Nat. Methods 6, 875–881.
Vaithianathan, T., and Matthews, G. (2014). Visualizing synaptic vesicle turnover and pool refilling driven by calcium nanodomains at presynaptic active
zones of ribbon synapses. Proc. Natl. Acad. Sci. USA 111, 8655–8660.
protein with homology to ELKS/CAST, is required for structural integrity and
function of synaptic active zones in Drosophila. Neuron 49, 833–844.
Walker, A.S., Burrone, J., and Meyer, M.P. (2013). Functional imaging in the
zebrafish retinotectal system using RGECO. Front. Neural Circuits 7, 34.
Wilson, R.I. (2013). Early olfactory processing in Drosophila: mechanisms and
principles. Annu. Rev. Neurosci. 36, 217–241.
Wilson, R.I., Turner, G.C., and Laurent, G. (2004). Transformation of olfactory
representations in the Drosophila antennal lobe. Science 303, 366–370.
Wong, A.M., Wang, J.W., and Axel, R. (2002). Spatial representation of the
glomerular map in the Drosophila protocerebrum. Cell 109, 229–241.
Xiao, B., Tu, J.C., Petralia, R.S., Yuan, J.P., Doan, A., Breder, C.D., Ruggiero,
A., Lanahan, A.A., Wenthold, R.J., and Worley, P.F. (1998). Homer regulates
the association of group 1 metabotropic glutamate receptors with multivalent
complexes of homer-related, synaptic proteins. Neuron 21, 707–716.
Yasuyama, K., Meinertzhagen, I.A., and Schürmann, F.W. (2002). Synaptic
organization of the mushroom body calyx in Drosophila melanogaster.
J. Comp. Neurol. 445, 211–226.
Zhao, C., Dreosti, E., and Lagnado, L. (2011a). Homeostatic synaptic plasticity
through changes in presynaptic calcium influx. J. Neurosci. 31, 7492–7496.
Venken, K.J., Simpson, J.H., and Bellen, H.J. (2011). Genetic manipulation of
genes and cells in the nervous system of the fruit fly. Neuron 72, 202–230.
Zhao, Y., Araki, S., Wu, J., Teramoto, T., Chang, Y.F., Nakano, M., Abdelfattah,
A.S., Fujiwara, M., Ishihara, T., Nagai, T., and Campbell, R.E. (2011b). An
expanded palette of genetically encoded Ca2+ indicators. Science 333,
1888–1891.
Wagh, D.A., Rasse, T.M., Asan, E., Hofbauer, A., Schwenkert, I., Dürrbeck, H.,
Buchner, S., Dabauvalle, M.C., Schmidt, M., Qin, G., et al. (2006). Bruchpilot, a
Zhu, Y., Xu, J., and Heinemann, S.F. (2009). Two pathways of synaptic vesicle
retrieval revealed by single-vesicle imaging. Neuron 61, 397–411.
Cell Reports 10, 2083–2095, March 31, 2015 ª2015 The Authors 2095
View publication stats
�
 Natalia Revelo