Pergamon
www.elsevier.nl/locate/asr
Adv. SpaceRes. Vol. 26, No. 1, pp. 197-207,200O
0 2000 COSPAR. Published bv Elsevier Science Ltd. All rightsreserved
Printedin &eat Britain
0273-1177/00 $20.00 + 0.00 zyxwvutsrq
Pll: SO273-1177(99)01050-9
THE NONLINEAR DYNAMICS OF SPACE WEATHER
D. Vassiliadisl,
A. J. Klimas2, J. A. Valdivia3, D. N. Baker4 zyxwvutsrqponmlkjihgfedcbaZYXWVUTSRQPONMLKJIHGFED
’ Universities Space Research Association, at: NASA/GSFC, Code 692, Greenbelt, MD 20771, USA
2Luboratory for Extraterrestrial Physics, NASA/GSFC, Greenbelt, MD 20771, USA
3National Research Council, at: NASA/GSFC, Greenbelt, MD 20771, USA
‘Laboratory for Atmospheric and Space Physics, University of Colorado, Boulder, CO 80309-0590, USA
ABSTRACT
Studies of the nonlinear magnetospheric dynamics have led to several directions useful in understanding
space
physics processes, in particular those related to magnetospheric
currents, and making space weather forecasts
possible. Four such directions are identified: (a) empirical time series prediction with nonlinear autoregressive
moving-average (ARMA) models, for which an example is given in terms of a geosynchronous electron flux index
model. (b) Measurement of physical properties of the currents from the coefficients of the ARMA models, such as
characteristic time scales and coupling strengths. Using a Dst index model we measure the ring current decay time
as a function of storm phase and activity, and identify new oscillation time scales correlating with the substorm
injection activity. (c) Spatiotemporal nonlinear modeling predicts the amplitude and location of the disturbance
as a function of space, as well as its time evolution. An example is given in terms of predicting the longitudinal
and temporal profile of midlatitude geomagnetic disturbances.
(d) Nonlinear dynamical models can be coupled
to other physical or empirical approaches to build comprehensive space weather models. SWIFT, an ionospheric
space weather model, is discussed as an example. Other applications of nonlinear dynamics are briefly discussed.
0 2000 COSPAR. Published by Elsevier Science Ltd.
1. INTRODUCTION
Nonlinear dynamics in space physics has grown steadily in scope and depth. We discuss this growth in terms of four
directions whose results have useful implications for theoretical and applied physics, in particular space weather.
While earlier research focuses on classification, empirical prediction, and first-principles modeling of geomagnetic
time series (review: Klimas et al., 1996), recently three more directions have been developed: closed-form timeseries models which are data-derived, but in addition have a physical interpretation; spatial, in addition to temporal,
prediction of space-related disturbances, and modeling from multiple measurement probes in the same region, or
in several regions; and combinations of the nonlinear
comprehensive
space weather forecasting.
dynamics
to other, physical or empirical,
models for more
We discuss these directions in the above order. The starting point is a brief review of basic nonlinear dynamics
concepts and some of the early results in Section 2. The following section discusses empirical time series modeling
and illustrates it with the prediction of a newly proposed geosynchronous
electron flux index. The next two
sections (4 and 5) are devoted to physical time series modeling and spatiotemporal modeling. Following that, Sec.
6 discusses the synergy between nonlinear dynamical and other models for space weather applications, and finally
ways of making predictions and other results available on-line.
197
D. Vassiliadis et al.
198
2. WHENCE
NONLINEAR
DYNAMICS?
A basic goal of nonlinear dynamics as applied to space physics is to model current systems in the magnetosphere
and ionosphere and the geomagnetic disturbances they cause. The configuration and intensity of the basic current
systems determine the global magnetospheric structure and activity in the predominantly low-p plasma (Potemra,
1984). The justification for applying nonlinear dynamics methods is the conspicuous coherence of these currents,
and other aspects of magnetospheric activity. However, a theoretical understanding of how self-organization arises
in plasmas for realistic ranges of plasma parameters is missing.
Regarding the currents, their coherent nature is characterized by their (a) being permanent and stable features, and
(b) by their having large interaction lengths and fast interaction timescales. The ring, electrojet, magnetopause, and
tail currents are permanent features of the magnetosphere. Following a small-scale disturbance they rapidly return
to their equilibrium values, except if a stability threshold is‘exceeded (e.g. in the case of the tail current). Because
of their long-range magnetic effect, and the rapid signal speed (VA 2 L/T where L is a scale of the magnetospheric
subsystem and T is a time scale for current growth), the magnetosphere is more organized spatially and responds
faster than, e.g., the neutral atmosphere, a fluid of much smaller volume. An example of coherent activity in
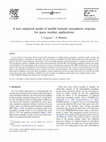
various magnetospheric locations is shown in Figure 1. Solar wind driving (from a high-speed stream at the end of
solar cycle 22) excites simultaneous geomagnetic disturbances in polar, auroral, and midlatitude locations (whose
activity is normally characterized by quite different time scales) while substorm injections often’ produce high
geosynchronous
particle fluxes. (c) Additional observational evidence about magnetospheric coherence has been
discussed by Siscoe (1993). (d) Finally the predictability of magnetospheric-current
processes, as will be reviewed
below, is another body of evidence for the coherence.
Hence the observed magnetospheric
collective response is a direct argument for using nonlinear dynamics methods. The underlying assumption for most
methods is that the spatial characteristics of the system
(here: the geomagnetic activity) are due to a small
number of spatial modes (corresponding to the geomagnetic effect of distinct current systems), and the
complex activity can be described by the interaction,
probably nonlinear, of these modes.
The need for nonlinear data analysis became obvious
after the linear moving-average
(MA) filters were applied (Clauer, 1986). In examining the effect of solar
wind driving, represented by the VB, electric field, on
the energization of the magnetosphere, represented by
the AL index, linear prediction filters were used, and
they showed the first predictive capability
T
G(t)
=
J
H(r)
* [VB,](t
- T)dT zyxwvutsrqponml
0
Z(t
Fig. 1. Coherent magnetospheric response during the month of
1995 to a solar wind high-speed stream (not shown). From
top to bottom: Solar wind input; Geosynchronous orbit: index for
the energetic electron flux (GEF); logro(GEF) showing electron
depletions due to growth phase dipolarizations; Polar latitudes:
index measuring the ground geomagnetic disturbance near the cap
center; Mid-latitudes: Dst geomagnetic index.
January
(1)
t At) = 2
H(jAt)[VB,](t
- jAt)
j=O
where the first equation is for continuous
ond for discrete-time data of resolution
denotes the filter output.
and the secAt, and A^L
Now the filter’s impulse response function, H(r),
where T is the time lag relative to the onset of solar
199
Nonlinear Dynamics of Space
wind input, is calculated from the VB, and AL data by inverting (1). Then the filter can be convolved with the same
solar wind data to reproduce AL (in-sample), or to different solar wind data to predict the corresponding AL (outof-sample). The method assumes linearity, namely that the impulse response is the same function independently of
the input. However, soon after the first applications of the method it was found that H(r) varies quite systematically
with the magnetospheric (and therefore the solar wind’s) activity level (Bargatze et al., 1985).
Based on the linear filter results, a nonlinear model was suggested (Baker et al., 1990) whose response was irregular
because it was dependent on the activity level. The global magnetosphere was likened to a dripping faucet (Baker
et al., 1990), a strongly nonlinear oscillator where sensitive dependence on the present state allows oscillations
with a large variety of amplitudes and phases to appear, so that this aperiodic “dripping” would represent global
reconfigurations
(substorms).
At the same time there was some evidence that the AE index was self-similar
in a way consistent with a chaotic system (Vassiliadis et al., 1990), although it was later shown that the selfsimilarity was biased by the autocorrelation of the high-time-resolution
data (Prichard and Price, 1992). rather
than, e.g., correlation between successive substorms. In these early efforts the magnetosphere was represented
as an autonomous system, where the solar wind input was neglected or set to a constant, but after Prichard and
Price (1992) pointed out this shortcoming, an input was included explicitly and used for prediction with nonlinear
time series models (see next section). The input can be either the upstream solar wind (Vassiliadis et al., 1995;
Valdivia et al., 1996) or a magnetospheric precursor like the PC index (Vassiliadis et al., 1996b). Similar studies
were carried out with neural networks (e.g. Wu and Lundstedt, 1996).
At the same time the nonlinear “dripping faucet” model (Baker et al., 1990) was developed into a plasmaphysics/electrodynamics’model
consisting of a small number of first-principles equations which are reviewed by
Klimas et al. (1996).
3. TIME
SERIES
PREDICTION:
A GEOSYNCHRONOUS
ELECTRON
FLUX
INDEX
MODEL
Time series models of geomagnetic activity mentioned above have been the nonlinear dynamics methods with the
most predictive power to date (e.g. Vassiliadis et al., 1995; 1996; Valdivia et al., 1996), and they continue to be
useful in space physics and space weather studies. We illustrate them by introducing
electron flux model.
an empirical
geosynchronous
Geosynchronous
electron injections constitute a characteristic type of substorm signature. The available energy
for them is the lobe (open-field-line)
magnetic energy. Open lines, driven by the solar wind, participate in the
large-scale convection of the polar cap; the amount of open flux is directly related to polar cap size and less directly
to convection speed. Polar Hall currents and the convection-related
electrojets and associated closure currents, can
be used for approximates measure of the available energy and dissipation rate in the magnetosphere.
Such currents
are measured by the polar cap (PC) geomagnetic index.
The PC index is constructed from the horizontal magnetic variations close to the center of the northern polar cap.
Its aim is to measure Hall currents over the polar cap from which one can infer the convection speed and electric
field (Troshichev et al., 1988), but the index is also affected by other polar and aurora1 current systems. In winter,
in particular, Hall currents wane and the dominant geomagnetic effect is due to closure-providing
field-aligned
currents. Also, under Northward BZ conditions, when the polar cap contracts, a fainter effect due to the aurora1
electrojets is measured.
The end result is a good correlation between PC and AL or AU which is useful in
prediction of the latter indices.
The geosynchronous electron flux (GEF) index is compiled from >50 keV particle measurements by five LANL
geosynchronous
spacecraft at a time resolution of 1 min. The index value is the highest flux measured among
those spacecraft within 2 hours in Ml_T of the midnight meridian. If no spacecraft is in that region, the index value
is filled in by linear interpolation in time. The construction of GEF resembles that of the AL/AU envelopes of
aurora1 geomagnetic activity. In dispersionless injections GEF provides estimates of the minimum duration of the
preceding current sheet thinning (by measuring the particle depletion) and estimates for injection’s onset time and
intensity. These signatures are significantly reduced if the index is derived from dispersed-injection
observations.
The correspondence between PC and GEF is clear in intervals like those of Figure 1. For many events the relation
is more quantitative: weak polar currents during the growth phase coincide with particle depletion and subsequent
200
D. Vassiliadis et al.
rapid intensification coincides with injections during expansion (Figure 2a; Pi2 pulsations provide an additional
time check for substorm onset). Therefore we use the PC index as the input to a nonlinear dynamical model for
geosynchronous
injections. Each time series is run through a moving-average
filter of 30 min. The correlation
coefficient between PC and GEF over the l-month interval is 48.9% peaking at a lag time of 1 min. This time is
the average time difference between the PC expansion peak and the injection peak, since these are the dominant
parts of the respective time series.
The correlation coefficient measures
dynamical equation it is necessary to
times. That can be accomplished by
More accurate than MA is an ARMA
the relation between GEF(t) and PC(t) at the same time step. To obtain a
express GEF(t) as a function of PC(t-jAt) at the present as well as previous
a “linear prediction filter” or moving-average
(MA) model similar to Eq. 1.
model which includes both previous GEF and previous PC measurements: zyxwvutsrq
m-l
GZ(t
l-l
oi * GEF(t
+ At) = C
- iAt) + Cbj
i=O
* PC(t
- jAt)
(2)
j=O
The number of delays (terms in the summations) is m = 2 = 1, while the coefficients ai, bj can either be constants
(linear ARMA model) or allowed to change with activity level (nonlinear ARMA). The ARMA filter can be
mapped to an ordinary differential equation (Klimas et al., 1998), such as that for a (nonlinear) oscillator.
Such an oscillator,
swinging
in discrete-time
according
representing the dissipative character of injections and
of ionospheric current decay. In fact the linear ARMA
model for GEF turns out to be overdamped, i.e. the
oscillation period is longer than the damping time, because an impulsive PC input results in a single observed injection rather than a sequence of injections;
(b) its output has a phase difference relative to the
input, because of a response lag in the tail region to
energy made available in the magnetosphere,
plus a
delay for the duration of the injection; and (c) it is
in general nonlinear, i.e. the frequency, phase, and
output amplitude depend on the input amplitude. The
ai coefficients give the characteristic frequencies and
damping rates of the system and the bj give the coupling coefficients and phase lags relative to the input
(the mapping between the discrete-time ARMA and
the continuous-time
oscillator is described in: Klimas
et al., 1997, 1998). The numerical calculation of ai, bj
involves a deconvolution, similar in principle to the linear prediction filters (Clauer, 1986), but using the singular value decomposition method (Press et al., 1993).
Single-step prediction uses the observation at step t+l
to correct the prediction before predicting t+2; that type
of prediction with a linear ARMA model reproduces
the training GEF data with a correlation of 99%. Iterative prediction, however, (which would be the one
to use in a realistic setting ivhere observations would
not be available) gives a modest 51% correlation with
observations. Nonlinear ARMA filters are expected to
be more accurate.
to (2), has the following
0
a.
features:
(a) it is damped,
zyxwvutsrqponmlkjihgfedcbaZYXWVUTSR
IO
5
15
20
T im e
[hours]
Fig. 2. a. Variation of GEF (in logarithmic scale) and PC indices
during substorm activity in a day of the interval shown in Fig. 1.
The growth (G) and expansion (E) phases are indicated as well as
the Pi2 pulsation index. b. Observed and predicted GEF index
(upper panel) from PC index (lower) for the first 7 days of January
1995. Note the relation of the peak values in the PC index to
peaks in the injection.
NonlinearDynamicsof Space
201
The nonlinear zyxwvutsrqponmlkjihgfedcbaZYXWVUTSRQPONMLKJIHGFEDCBA
ARMA model represents the dependence of injection dynamics with activity level, and therefore it
should be calculated for each level separately, rather than averaging over all of them as it happens for a linear
model. The dependence of ai, bj on activity level provides effectively a nonlinear filter. One way is to subdivide
the dataset in intervals of increasing activity (as done by Bargatze et al., 1985). A frequently-used
geometric
method is to construct a state-input space (Vassiliadis et al., 1995) and calculate the coefficients at every point,
by selecting a group of geomagnetic/solar
wind conditions similar to the instantaneous level of activity with no
explicit dependence on the time it occurred (the so-called zyxwvutsrqponmlkjihgfedcbaZYXWVUTSRQPONMLKJIHGFEDCBA
“nearest neighbors”). A similar alternative is to embed
the time-series data in a phase space (similar to the state-input space), divide it into regions using a grid, and
calculate the coefficients in each region separately (see next section). Using the geometric representation of a state
space or a phase space is advantageous, because (a) “activity level” is defined for an instant, rather than a long time
interval, and the filter changes continuously (although not necessarily smoothly) with activity; (b) visualization of
the data is in terms of a phase-space-like
“portrait”, rather than a time series; (c) under certain conditions there is
a well-defined mapping between the dynamics of the physical system and those reconstructed in the phase space
(Sauer et al., 1991, and references therein). (d) The filters obtained from the state space, or state-input space for
input-output systems such as PC-GEF data, can be mapped to nonlinear ODES (Klimas et al., 1997, 1998).
The state-input
space technique
has been applied
to a variety
of data pairs in the solar wind-magnetosphere
coupling: VBs to AL or AU (Vassiliadis et al., 1995;1996a); VBs to PC (Vassiliadis et al., 1996b); VBs to D,r
(Valdivia et al., 1996). Nonlinear relations have been found between VB, and AL or D,t, and weakly nonlinear
between VBs and AU.
4. FROM EMPIRICAL
MODELING
.TO A PHYSICAL
INTERPRETATION:
RING CURRENT
TIME CONSTANTS
FROM A HIGH-RESOLUTION
DST INDEX
While empirical prediction is a primary application of nonlinear dynamics methods, their prediction accuracy
suggests that their coefficients can be related to the physical parameters.
We will illustrate this by means of
the mid-latitude geomagnetic index, D,t, which is a usual proxy for the strength of the ring current (McPherron,
1997; but see also criticism of the index construction by Campbell, 1996). The l-hour index is a standard
diagnostic of the long-term average level of activity in the magnetosphere; however as will be shown below the
higher-time-resolution
(below: 5-min) data gives significantly more information about the storm phases and the
current’s interaction with substorms. Most of the space weather damages on the ground occur during great storms,
but the large dB/dt variations that cause them are localized under the substorm current system.
Nonlinear dynamical methods applied to D,t have shown the capability for prediction (Valdivia et al., 1996). They
can be considered extensions of a linear model (Burton et al., 1975; hereafter “B75”). That model is a linear
first-order differential equation and here we extend it to a second-order ARMA model, which is the discrete-time
equivalent of a second-order differential equation, a nonlinear oscillator, under certain conditions (Klimas et al.,
1997).
1-I
773-l
. VB,(t - jAt)
Est(t + At) = C ci * D,t(t - iAt) + C bj zyxwvutsrqponmlkjihgfedcbaZYXWVUTSRQPO
(3)
i=o
j=o
where m = 2 = 1.
The ring current dynamics changes for each storm phase, so in order to construct a nonlinear (activity-dependent)
model, we divide the data in regions and calculate the coefficients for each region separately. The data are also
smoothed with a 25-min running average. We construct the 3-dimensional
space (Dst, dD,t(t)/dt, VB,(t)) which
is the phase space for a D,t oscillator driven by an input VBs (in principle there is also a fourth dimension for
dVB,/dt, but the running-average
smoothing renders this derivative negligible). A spatial grid divides the phase
space in rectangular regions (2D projections of the grid are shown in Figures 3a and 4a). The grid is nonuniform
and along each direction (Dsr, dD,t/dt, and VBS) the spacing of the grid is such that it contains the same number
of data. The coefficients ai, bj are calculated in each cell separately.
202
D. Vassiliadis et al.
The Laplace transform
of Eq. (3) gives the transfer function
E,&Ll)
= I?(w)vFls(“)
l-l
Jgo
rl(w)
=
Q-j
m-l
p -
in the zyxwvutsrqponmlkjihgfedcbaZYXWVUTSRQP
frequency domain:
I-1
C
bjpm-tj+l)
(4)
II zyxwvutsrqponmlkjihgfedcbaZYXWVUTSRQPONM
j=o
m-l
C a;pmi
i=o
go
(P-
PiI
where p E ezp(wAt), and p; E ezp(w;At) is one of the m roots of the polynomial in the denominator, or poles
of the transfer function, while wi is one of the m characteristic frequencies of the system (Klimas et al., 1997,
1998; Vassiliadis et al., “The D,t Geomagnetic Response”. submitted to JGR. December 1998).
c
.5
tom
C
E zyxwvutsrqponmlkjihgfedcbaZYXWVUTSRQPONMLKJIHGFEDCBA
5
A
s
0
5
-5
5
-1 0
r
Y
% -1 5
L
-2 0 0 -1 5 0 -1 0 0
-5 0
0
50
M a in pha se
‘J ,t [nT l
Fig. 3. a. Projection of the (D,,, dD,/dt, VB,) phase space in its
first two dimensions.
The subspace is divided in 2x2 = 4 cells,
indicating early SYSC phase (Compression, C), late SYSC (return,
r), main phase (M), and recovery (R).
While H(w) gives the characteristic modes of oscillation/decay for D,t, its inverse Laplace transform gives
the impulse response function H(kAt), k = 0, 1, 2, _..
in the time domain (cf. Eq. (1)):
.
As before H(kAt) determines the coupling
wind input, and the length of the storm.
O)
to the solar
To each phase space region, or “cell”, there corresponds a set of poles and characteristic frequencies of
the equation, as well as a response function, i.e. a
model for that region. One can time-integrate such a
model from an initial condition that starts in the cell.
When the trajectory crosses over to another cell, the
corresponding model is selected, etc. The combination
of these local-linear models is, of course, a nonlinear
model.
For
3a)
the
the
a “coarse” nonlinear model (2x2~2 grid, Figure
the impulse response functions (5) are similar to
average response function, corresponding to that of
B75 model (Figure 3b). The average-model decay
Fig. 3. b. Impulse response functions H(t) for the four regions of
Figure 3a. The thick curve is added for comparison and gives the
linear (average) response, qualitatively similar to the B75 model.
Deviations from the linear model are shown for VB, < 1 mV/m
(dotted lines) and VB, > 1 mV/m (solid lines). Note the presence
of a slowly growing response function in the early SVSC phase
and two weakly oscillatory functions in the late ST/SC phase.
time is 4.87 hours, which can be interpreted as the
decay time of the ring current (for pressure-corrected
Dst the time becomes 7.26 hours, comparable to B75’s
7.7 hours); the rise time is much shorter, 0.86 hours,
justifying the B75 model where the rise time is taken
to be 0. Most of the individual response functions
are overdamped, but during the early SYSC there a
growing solution and in the late SI/SC the responses
become weakly oscillatory.
The growing and oscillatory responses are new D,r
modes that do not appear in the linear ARMA model.
203
Nonlinear Dynamics of Space
A higher phase space resolution (4x4~4 grid, Figure
10
?
4a) shows that the oscillations are present in the main zyxwvutsrqponmlkjihgfedcbaZYXWVUTSRQPONMLKJIHGFED
E
5
phase. Figure 4b shows the phase space cells where
p
0
2 -5
oscillations appear; these are in the compression and
g zyxwvutsrqponmlkjihgfedcbaZYXWVUTSRQPON
-10
main phase, but virtually absent from the recovery
$ -15
phase.
The average frequency increases with solar
wind activity, from l/2.78 to l/l .43 hours-‘. Figure 4c
-200-150-100
-50
0
50
gives an example of the amplitude and time profile of
o,i [nTI
the response for the cases marked with an ‘x’ in Figure
Fig. 4. a. Same as Figure 3a, but with the (D,,, dD,,/dt) subspace
4b. The oscillation is also found in the time series of
divtded in 4x4 = 16 cells. The two rightmost cells indicate early
the _IH perturbation at all D,t magnetometers.
The
St/SC commencement
(EC) and late SYSC (LC). The other fourteen
are divided between main phase (M) and recovery (R).
oscillations are identifiable in longitudinal profiles of
AH (such as constructed by the method of Valdivia
et al., 1999; see also Section 5). Spectrograms show that the oscillations are generally before the Dst minimum,
i.e. in the WSC and main phases.
0 .6 1 < w ss c 1 .2 1 d/m
0c WIc0.6,“V/m zyxwvutsrqponmlkjihgfedcbaZYXWVUTSRQPONMLKJIHGFEDCBA
..-,
* ..
[nTlmV/m]
Fig. 4. b. D,, oscillations appear in certain regions (“cells”) of
the phase space in Figure 4a. The oscillation frequency, Im(w),
is the z axis. The four panels correspond to four increasing solar
wind VB, levels. The average Im(w) increases with solar wind
activity. From each graph we arbitrarily select a cell marked with
‘Ix” whose impulse response function we plot in Fig. 4c.
Time [ho”,.]
Time [hours]
Fig. 4. c. Absolute value of the impulse response functions for the
cell denoted by *x’ in Figures 4a, b. The oscillations are evident
for the linear (left) and logarithmic (right) scale.
There are two explanations put forward for the oscillatory response. Because it was initially found in D,t data
that were not corrected for the positive geomagnetic effect of solar wind pressure increases, one of the candidates
is a magnetospheric “ringing” response to solar wind pressure pulses. However, this explains only a small part
of oscillations, those with periods of 5-10 min. However, most of the oscillations remain even after the data
are pressure-corrected.
Also the division in cells shows that the oscillations do not usually appear in the early
compression (SVSC) phase, but rather at its end, as well as in the early main phase.
The second explanation is that these ring current enhancements are due to substorm injections. Indeed examination
of the AL index shows that its intensifications
coincide with the times where the oscillations occur in dD,t/dt
(Vassiliadis et al., “The D,t Geomagnetic Response”, submitted to JGR, December 1998.).
D. Vassiliadis et al.
204
The above modeling method has been based on selecting similar-activity data (nearest neighbors) using a phase
space. Alternatively cne can construct a model from temporally close data (time-nearest neighbors) (Klimas et al.,
1997, 1998). By selecting an interval which contains a storm or other period of interest, one can obtain model
coefficients from Eq. (3) for all these times, i.e. a time-local model for a sequence of observations around the
current point. In fact the coefficients not only evolve smoothly in time, but consist of nontrivial functions of the
input and output. The constitutive expressions, of the form ai = f(Dst(t), dD,t(t)/dt, VB,(t)), or zyxwvutsrqponmlkjihg
closure relations
(Klimas et al., 1997), can be combined with Eq. (3) to produce a truly nonlinear model. Input from other intervals
can be run through the model, and the predicted and observed output can be compared.
5. zyxwvutsrqponmlkjihgfedcbaZYXWVUTSRQPONMLKJIHGFEDCBA
SPATIOTEMPORAL MODELING:
PREDICTING THE LOCATION 0~ GEOMAGNETIC DISTURBANCES
The magnetospheric currents that we model depend on several solar wind parameters, and simultaneously affect
many locations on the ground. It is therefore natural to integrate multiple inputs and multiple outputs related to
the same current system in a single nonlinear model. If the outputs are simultaneous measurements of the same
physical variable at different locations, the resulting dynamical model is called a spafiotemporulmodel.
A spatiotemporal model leas been developed for the mid-latitude disturbances (Valdivia et al., 1999) which are in the
largest part due to ring current variations. The energy density distribution of current carriers (ions) is nonuniform
in the azimuthal direction because of injections and
drifting particles. Through the Dessler-Parker-Sckopke
relation (McPhetron, 1997; also extension by Valdivia
lza rm
et al., 1999), where the geomagnetic disturbance is proportional to the totaltietgy of the particles, the energy
nonuniformity produces a longitudinally-varying profile of the North-South fleld component.
We characterize the mid-latitude field via its geomagnetic N-S component as measured at six magnetometers (Boulder and Tashkent added to the four standard
Dpt-index magnetometers). Together with the solar
wind input they are iterated in a spatiotemporal model
for the r-th magnetometer measurement:
Tj$)(t + &]
..........
.....
j_iid
.............
I;$-@................
..
fz
y!i;
.“.....
2
....
..
..-
....
.
.
.
.....
.......
“..-“..”
_.
.....
.
.
...
..
= zyxwvutsrqponmlkjihgfedcbaZYXWVUTSRQPONMLKJIHGFEDCBA
a(‘” zyxwvutsrqponmlkjihgfedcbaZYXWVUTSRQPONMLKJIHGFEDCBA
-B
I
s=l zyxwvutsrqponmlkjihgfedcbaZYXWVUTSRQPONMLKJIHGFEDCBA
(6)
l-l
+
~~j%,(t
-jAt)
j=O
where m = 6 is the ntilhber of magnetometers, and 1 is
the number of lags in the input VBs. The a@) coefficients are due to the correlation between magnetometer stations (increasing with the intensity and speed of
propagation of a current density disturbance) and the
Fii. 5. Spatiotemporalprediction of midlatitude stations for the
bO)i represents the couphng to the injection function,
April 4, 1979 storm (DOY 114). First two panels: solar wind
represented here simply & the solar wind electric field
VB, aud pressure measured by BEE-3 and propagatedto subsolar
magnetopause. Subsequent four panels: observed and predicted
(see Eq. 3). Again the coefficients can be obtained
AH at the four standardmagnetometer stations (linear model (6):
by deconvolving G,. zyxwvutsrqponmlkjihgfedcbaZYXWVUTSRQPONMLKJIHGFEDCBA
(6j. Using all of the data set
blue; nonlinear: red). Last panel: observed Dd index compared to
results in a linear model, and dividing the data accordthe value obtained from the individual magnetometer predictions
ing to geomagnetic&~
wind activity level results in
(linear: green; nonlinear: red).
a nonlinear model.
205
Nonlinear Dynamics of Space
Given a sequence of solar wind input values, Eq. (6) can be iterated from an initial condition and
can be compared to the observed AH(r) . Such comparisons show that the nonlinear model is
reproducing AH(‘) than the linear spatiotemporal model (Figure 5). The predicted perturbations
to form a predicted E’st which is closer to observations than that predicted from a nonlinear
(Valdivia et al., 1999).
-(r)
its output AH
more accurate in
can be compiled
temporal model
Spatiotemporal prediction is currently being extended to 2D high-latitude geomagnetic predictions.
Based on
the predictive accuracy of nonlinear models for the AL/AU indices, similar in structure to Eqs. (2, 3), one
can extend them to spatiotemporal models similar to Eq. (6) for local perturbations measured by one or more
A first approach analyzed Canopus’s east
magnetometer arrays as a function of MLT and invariant latitude.
meridional magnetometer array in conjunction with solar wind input from WIND at the L1 point (Valdivia et al.,
1998). Here, too, the nonlinear spatial model is more accurate than the linear one. Spatiotemporal modeling will
be extended to more than one magnetometer arrays. zyxwvutsrqponmlkjihgfedcbaZYXWVUTSRQPONMLKJIHGFED
Yellow Knife, November
Novamkr 1-3.1078
E
Fig. 6. Coupling of nonlinear dynamical models and a ballistic
propagation scheme as part of the ionospheric SWIFT model.
First three panels: propagation of BEE-3 data to the subsolar
magnetopause and comparison to IMP-8 near-Earth measurements.
The last two panels are AL predictions (grey lines) from the BEE-3
input (IMP-8 gives similar results) and from the PC index.
6. COMBINATION
TOWARDS
OF NONLINEAR
GEOMAGNETIC
DYNAMICS
AND IONOSPHERIC
5.1979
from both AL and Ati
Fig. 7. Effect of AU parameter on the SWIFT model output.
At around 3 am on November 5, 1978, Yellowknife is west of
the Harang discontinuity so the effect of the eastward_electrojet
AL in the
is significant. Using only the nonlinear-predicted zyxwvutsrqponmlkjihg
geomagnetic part of SWIFT gives the wrong sign for the ground
disturbance (dash-dotted line). When the predicted E is included,
the prediction is improved significantly (dotted line).
WITH OTHER
FORECASTING
MODELS
Nonlinear dynamical models are usually combined with other physical or empirical models. For example, the solar
wind input for geomagnetic time series models is the measurement at L1 processed by a propagation program
which simulates the transport to the subsolar magnetopause.
Similarly when a nonlinear model is sufficiently
accurate, its output can be used by other models as a proxy for the modeled magnetospheric disturbance. In this
way more comprehensive models can be built.
An example for such a combination of models for solar wind-magnetosphere
-ionosphere coupling is the Space
Weather Ionospheric Forecasting Technologies (SWIFT) model. The solar wind drives nonlinear dynamics and
neural networks models, and in addition the solar wind input and predicted indices drive empirical ionospheric
206
D. Vassiliadis et nl.
models which give the electric-field patterns, currents, and Joule dissipation, and geomagnetic disturbance as a
function of invariant latitude and MLT. An early test of SWIFT shows the propagation and index-prediction parts
(Figure 6). The solar wind input is measured at L1 by ISEE- and propagated to the subsolar magnetopause where
it is compared with IMP-g. There is fair agreement between the model and observed solar wind. Subsequently
both the propagated solar wind and the PC index are used in turn as inputs to predict AL. Other tests have been
carried out to measure the individual models’ sensitivity to perturbations to or uncertainties in the initial state.
After the indices have been calculated, they are used in conjunction
with the solar wind input to obtain the
ionospheric electrodynamic variables. Since different current systems are parametrized through indices and other
model variables, it is possible to optimize the model further by weighting the relative contribution of each current
system to increase agreement with training data. Figure 7 shows the effect of adding the parameter of the eastward
electrojet, the AU index, to the model optimization. A sequence of intensifications, starting at O4:OOUT, November
4 (when the measuring station of Yellowknife is in the dusk section), is predicted with the wrong sign. Inclusion
of the AU parameter reduces the error by at least 50 and in some cases more than 150 nT.
Index predictions are produced daily based on the solar wind input (originally from WIND and since May
1998 from ACE) and the PC index. A homepage has been set up for AL and AU, http:/Aepgst.gsfc.nasa.gov/
people/vassi/htmls/alprediction.html.
For data-derived models it is important to maintain a database of intervals
representative of as many activity levels and profiles as possible. Recently we have created an on-line database for
AL/AU predictions during magnetic cloud passages in 1997 at h~~p://epgs~.gsfc..nasa.gov/people/vassilhhnls/97/even~s97.html.
Remarkably the predictions are less accurate compared to the standard, non-cloud predictions. The explanation is
that during the cloud events, the amplitude is larger and the variability is smaller than in the training intervals.
Since the training dataset does not contain cloud conditions, it is difficult to predict AL/AU correctly.
test this hypothesis by adding the cloud intervals to the database and repeating the runs.
We plan to
7. SUMMARY
Nonlinear dynamics techniques &e an essential set of data analysis methods which cover the middle ground between
single-event and statistical analysis. We discussed a sequence of methods to quantitatively predict and physically
The complexity of the model building can increase in a commensurate
model a space physical environment.
way with the variability of the data sets: From single-time-series
prediction for scalar indices, we have gone to
methods of physical interpretation of the models (e.g. Klimas et al., 1997), where we measure characteristic time
scales (growth/decay/oscillation)
and coupling strengths. The instantaneous state of the current system can be more
accurately defined if measurements at several locations are available, from which one can construct spatiotemporal
models and predictions.
Finally if the accuracy of the prediction is sufficiently high, the model can be used in
conjunction with other empirical or physical models.
The evaluation of nonlinear dynamics models in terms of error statistics provides a good guide in two areas
not covered in this paper: model verification and metric development.
In developing space weather models, it
is essential to verify the predictive capability by using out-of-sample (cross-validation)
testing, and comparison
between the candidate model and reference models or competing models to extract the prediction skill, i.e. the
prediction capability relative to other models (issues discussed by Doggett, 1996). These are standard topics
for nonlinear model development (e.g. the reference model is the linear model). Similarly the error analysis
in nonlinear dynamics models (Vassiliadis and Klimas, 1996) can also be used as a guide to develop metrics
necessary for progress evaluation
Program, January 1999).
in space weather forecasting
(Wolf et al., Metrics for the National Space Weather
8. ACKNOWLEDGMENTS
The following individuals and/or organizations were essential in providing the data we used in this study: Hightime-resolution D,t index: Y. Kamide, R. Nakamura, S. Sharma. GEF index: G. D. Reeves. Pi2 pulsation index:
T. Iyemori, M. Nose’. ACE and WIND magnetic field and plasma data: Spacecraft PIs and NOAA/SEC. PC
index: E. Friis-Christensen
and S. Vennerstroem. Support from NASA/SR&T and NSF/GEM grants is gratefully
acknowledged.
Nonlinear Dynamics of Space
207
REFERENCES
Baker, D. N., A. J. Klimas, R. L. McPherron, and J. Buchner, The Evolution from Weak to Strong Geomagnetic
Activity: an Interpretation in Terms of Deterministic Chaos, Geophys. zyxwvutsrqponmlkjihgfedcbaZYXWVUTSRQPO
Res. Len., 17,41 (1990).
Bargatze, L. F.. D. N. Baker, R. L. McPherron, and E. W. Hones, Jr., Magnetospheric Impulse Response for Many
Levels of Geomagnetic Activity, J. Geophys. Res., 90,6387 (1985).
Burton, R. K., R. L. McPherron, and C. T. Russell, An Empirical Relationship Between Interplanetary Conditions
and Dst, J. Geophys. Res., 80,4204 (1975).
Campbell, W. H., Geomagnetic Storms, the Dst Ring-Current Myth, and Lognormal Distributions, f. Arm. Terr.
Phys., 58, 1171 (1996).
Clauer, C. R., The Technique of Linear Prediction Filters Applied to Studies of Solar Wind-Magnetosphere
Coupling, in Solar W ind- M agnetosphere Coupling, edited by Y. Kamide and J. Slavin, pp. 39-57, Terra
Scientific Publ. Co., Tokyo (1986).
Doggett, K. A., (ed.), The Evaluation of Space W eather Forecasts. Proceedings of a W orkshop in Boulder,
Colorado, June 19- 21, 1996, NOAA/SEC, Boulder, CO (1996).
Horton W., and I. Doxas, A Low-Dimensional Dynamical Model for the Solar Wind-Driven Geotail-Ionosphere
System J. Geophys. Res., 103,456l (1998).
Klimas, A. J., D. Vassiliadis, D. N. Baker, and D. A. Roberts, The Organized Nonlinear Dynamics of the
Magnetosphere, J. Geophys. Res., 101, 13089 (1996).
Klimas, A. J., D. Vassiliadis, and D. N. Baker, Data-Derived Analogues of the Magnetospheric Dynamics, J.
Geophys. Res., 102,26993 (1997).
Klimas, A. J., D. Vassiliadis, and D. N. Baker, Dst Index Prediction Using Data-Derived Analogues of the
Magnetospheric Dynamics, J. Geophys. Res., 103,20435 (1998).
McPherron, R. L., The Role of Substorms in the Generation of Magnetic Storms, in M agnetic Storms, edited by B.
T. Tsurutani, W. D. Gonzalez, Y. Kamide, and J. K. Arballo. pp. 131-147, American Geophysical Union,
Washington, DC (1997).
Potemra, T. A. (ed.), M agnetospheric Currents, American Geophysical Union, Washington, DC (1984).
Press, W. H., B. P. Flannery, S. A. Teukolsky, and W. V. Vetterling, Numerical Recipes: the Art of Scientific
Computing (second ed.), Cambridge University Press, Cambridge, UK (1993).
Prichard, D., and C. P. Price, Spurious Dimension Estimates from Time Series of Geomagnetic Indices, Geophys.
Res. L&t., 19, 1623 (1992).
Sauer, T., J. A. Yorke, and M. Casdagli, Embedology, J. Star. Phys., 65,579 (1991).
Siscoe, G., Manifestations of global coherence, Eos Transactions AGU, Fall M eeting Suppl., 501 (1993).
Troshichev, 0. A., V. G. Andrezen, S. Vennerstrom, and E. Friis-Christensen,
Magnetic Activity in the Polar-Cap A New Index, Planet. Space Sci., 33, 1095 (1988).
Valdivia, J. A., A. S. Sharma, and K. Papadopoulos, Prediction of Magnetic Storms by Nonlinear Models, Geophys.
Res. L-e% .,23, 2899 (1996).
Valdivia, J. A., D. Vassiliadis, A. J. Klimas, and A. S. Sharma, The Electrojet Currents: Understanding Their SpatioTemporal Multivariate Properties, in Proceedings of the Fourth International Conference on Substorms, edited
by Y. Kamide and S. Kokubun, pp. 669-672, Terra Scientific Publ. Co., Tokyo (1998).
Vassiliadis, D., and A. J. Klimas, Evaluation of Nonlinear Systems for Geomagnetic Index Forecasting and
Modeling, in The Evaluation of Space W eather Forecasts. Proceedings of a W orkshop in Boulder, Colorado,
June 19- 21, 1996, edited by K. A. Doggett, pp. 29-33, NOAA/SEC, Boulder, CO (1996).
Vassiliadis, D., A. S. Sharma, T. E. Eastman, and K. Papadopoulos, Low-Dimensional
Chaos in Magnetospheric
Activity from AE Time Series, Geophys. Res. Zen., 17, 1841 (1990).
Vassiliadis, D., A. J. Klimas, D. N. Baker, and D. A. Roberts, A Description of the Solar Wind-Magnetosphere
Coupling Based on Nonlinear Filters, J. Geophys. Res., 100,3495 (1995).
Vassiliadis, D., A. J. Klimas, D. N. Baker, and D. A. Roberts, The Nonlinearity of Models of the vBsouth - AL
Coupling, J. Geophys. Res., 101, 19779 (1996a).
Vassiliadis, D., V. Angelopoulos, D. N. Baker, and A. J. Klimas, The Relation Between Northern Polar Cap and
Aurora1 Electrojet Geomagnetic Indices in the Wintertime, Geophys. Res. Lett., 23,278 1 (1996b).
Wu, J.-G., and H. Lundstedt, Prediction of Geomagnetic Storms from Solar Wind Data Using Elman Recurrent
Neural Networks, Geophys. Res. Zett., 23,3 19 (1996).
Academia.edu no longer supports Internet Explorer.
To browse Academia.edu and the wider internet faster and more securely, please take a few seconds to upgrade your browser.
The nonlinear dynamics of space weather
Advances in Space Research, 2000
...Read more
Related Papers
Geophysical Research Letters, 1996
Download

Journal of Geophysical Research, 2006
Download

Universe
Download

Advances in Space Research, 2006
Download

Journal of Atmospheric and Solar-Terrestrial Physics, 2002
Download

Journal of Geophysical Research, 1999
Download


Download


Journal of Kufa Studies Center
Download

Download


Download

Trends in Psychiatry and Psychotherapy, 2020
Download
