Journal of Non-Crystalline Solids 351 (2005) 3347–3355
www.elsevier.com/locate/jnoncrysol
Structure of bioactive mixed polymer/colloid aerogels
Luis Esquivias
a
a,*
, Vı́ctor Morales-Flórez a, Manuel Piñero b, Nicolás de la Rosa-Fox
a
Departamento de Fı́sica de la Materia Condensada, Facultad de Ciencias, Universidad de Cádiz, 11510 Puerto Real, Spain
b
Departamento de Fı́sica Aplicada, CASEM, Universidad de Cádiz. 11510 Puerto Real, Spain
Received 11 January 2005
Abstract
The structure of polymer/colloid mixed silica sono-aerogels has been studied by SAXS, N2 adsorption–desorption and Hg porosimetry. The system is described as a composite in which the polymeric phase (sonogel) is the matrix. The structure of this phase prepared
with ultrasounds is very fine consisting in aggregates of 5 nm radius formed by elementary particles of 1 nm radius. Including Ca(II)
into the silica atomic network causes enlarging the average size of the particle more than three times with respect to its size in its pure
silica counterpart. The stiffness increases as well by 50%. The size of the particles and pores is also affected by the ultrasound dose
applied; the higher for the larger the particles. On the other hand, a low dose produces a rough particle surface.
Ó 2005 Elsevier B.V. All rights reserved.
PACS: 81.05.Je; 81.05.Rm; 81.20.Fw; 82.20.Wt
1. Introduction
The combination of two particulate materials with a
processing that allows full intermingling of both structures
has driven our interest in polymer/colloid hybrid gels [1,2].
The material was described as a composite in which the
polymeric gel is the matrix and the colloid particles, the
reinforcing phase. We verified that adding colloid silica
particles to TEOS-based alcogels enables the network porous volume and pore radius to be tailored. This is a very
attractive feature when the inclusion of a second phase into
the pores is intended with the purpose of a complete sintering of the resulting composite. The porous structure also
features the performance and applications of these materials, especially attractive to prepare materials for implants
since it must permit the specimens to better get infiltrated
and vascularized. In a preliminary approach, we have used
this combination polymer/colloid to prepare aerogels given
that this characteristic is enhanced by drying the gel under
supercritical conditions.
*
Corresponding author. Tel.: +34 956 01 6321; fax: +34 956 01 6288.
E-mail address: luis.esquivias@uca.es (L. Esquivias).
0022-3093/$ - see front matter Ó 2005 Elsevier B.V. All rights reserved.
doi:10.1016/j.jnoncrysol.2005.08.007
In vitro bioactivity of this material has been promoted
by adding calcium to the initial sol to obtain SiO2–CaO/
SiO2 composite. The bioactive performance must be improved by a high surface/volume ratio, which is characteristic of the sono-aerogels [3]. On the other hand, one of the
effects of ultrasonic treatment for obtaining mixed oxide
gels is favoring the homogeneity at a molecular level. Bioactivity is manifested by growth of hydroxycarbonateapatite (HCA) nano-crystals that wraps the material when it
is immersed in blood plasma. HCA layer is also formed
when bioactive materials are soaked in solutions mimicking
the features of plasma. These are so-called in vitro assays
of bioactivity, a common tool in the development of new
biomaterials, where HCA formation is monitored.
Ca(II) is a well known modifier of the glasses atomic
network [4]. This modification induces as well changes in
the gel structure that are unknown. It is the aim of this
paper to simulate the structure of mixed polymer/colloid
SiO2–CaO/SiO2 aerogels. Structural simulation turns out
to be the culmination of a strategy to get the clues to
act on the processing to tailor specific structures. The
simulation of the aerogels structure has been approached
from several points of view. The structure formation
3348
L. Esquivias et al. / Journal of Non-Crystalline Solids 351 (2005) 3347–3355
process has been studied by molecular dynamics technique
[5], using the Feuston–Garofalini potential, concluding
that the structure formation starts with a slow growing
process of the clusters, followed by faster growth of the
structure due to the cluster–cluster aggregation. Other
authors mainly face their work to the making of characterization programs for the porous structures generated by
simulation use the Monte Carlo method [6]. Gelb and Gubbins apply the Lennard–Jones potential for each element,
and the Lorenz–Berthelot rules for mixing the inter-element potential. On the other hand, it has attracted interest
reproducing the formation and growing processes of the
aerogels by computer, with the reaction or diffusion limited
cluster aggregation (RLCA or DLCA) algorithms, or some
modification of them [7], or the ballistic cluster–cluster
aggregation [8].
Ma et al. [9] have used structures generated with DLCAmodified algorithms characterizing them by their fractal
dimension, to achieve the scale law exponent and present
some models to explain the structure–properties relationship [10]. As for Woignier et al., they have worked with
DLCA-generated structures, introducing a new technique
for characterizing these porous systems [11]. They conclude
that the pore size distribution and the hydroxyl content are
relevant for describing and understanding the mechanical
properties of these materials [12].
We have simulated the structure of dense gels by random close packing (RCP) models [13] from which some
information about the microstructure of the gel can be obtained by using theses models [14]. Applying RCP structural models the existence of several typical sizes is
manifested, whereas the USAXS (ultra small X-ray scattering) tests [15] shows a hierarchy-ordered structure. In this
paper this structural approach, thoroughly described in
former papers [2,16,17], has been applied.
2. Experimental procedure
poured in glass hermetic containers at 50 °C until gelation.
Supercritical drying [20] was performed in autoclave
(T = 260 °C, P = 90 bar) following the procedure already
described [21]. There were also prepared two counterparts
of the sample containing 30% weight of colloid particle
adding the amount necessary of Ca(NO3)2 to have a final
product containing 3% weight of Ca, the difference between
them is the ultrasound dose applied. These samples were
named respectively 30A (dose applied 310 J cm3) and
30B (dose applied 520 J cm3).
2.2. X-ray scattering
X-ray scattering measurements were performed in a Siemens D500 diffractometer equipped with conventional
Bragg–Brentano geometry and a Cu anticathode. The
Cu Ka line (k = 0.1542 nm) was selected by a bent graphite
monochromator in the diffracted beam.
To cover a wide range of the scattering vector modulus
q = 4p sin h/k, where h is the half scattering angle and k the
selected wavelength, two series of data were collected: one
series at small angle (SAXS) for 0.3° < h < 10.0°
(0.3 nm1 < q < 7 nm1) with steps of 0.02° to obtain information about dispersion entities of correlation lengths included between 20 and 0.9 nm. Other series were
obtained for 10.0° < h < 90.0° with steps of 0.04 °C to
determine the presence of traces of crystallization.
PorodÕs limiting law for SAXS
IðqÞq4
S
1
lim
;
ð1Þ
¼
V p/ð1 /Þ
Q0
enables the quantity S/V to be calculated irrespective of the
geometric distribution of the phases even in the absence of
well define particles [22], where Q0 is the integrated
intensity
Z 1
Q0 ¼
IðqÞq2 dq
ð2Þ
0
2.1. Synthesis of the gels
This structural study was done on monolithic polymer/
colloid mixed sono-aerogels containing silica particles. The
synthesis method is based on that proposed by Toki et al.
[18]. The colloidal silica selected was Aerosil-OX-50 (Degussa). According to manufacturerÕs specifications, the
product is constituted by particles 40 nm of primary average size and exhibits 50 m2/g of specific surface area. The
percentage by weight of SiO2 particles to total SiO2 was
30 and 54.
The sols were elaborated by hydrolysis and polycondensation of tetramethoxysilane (TMOS) under acidic conditions (pH [HNO3] = 1.5). A device delivering to the
system 0.6 W cm3 of ultrasound power was employed
[19]. The total dissipated was 150 J cm3. Then the colloid
phase was added under vigorous stirring until a homogeneous mix is obtained. Next, the pH was raised up to 4.5
by adding diluted NH4OH. The homogeneous liquids were
and S and V are, respectively, the surface and the volume
of one of the two phases of volume fraction /. These aerogels exhibit a positive deviation from the PorodÕs law due
to electronic density fluctuation at the pore–solid interface.
Positive deviation from PorodÕs law leads to no constant
but linear relationship Iq4 with the scattering angle
lim½IðqÞq4 ¼ A þ Bq4 ;
ð3Þ
where A is the Porod constant, and B the corresponding
intensity fluctuation. This parameter is a measure of the
deviation from the PorodÕs law, associated with electronic
density fluctuations due to the solid phase microporosity.
On the other hand, the parameter A is strongly related to
the surface roughness of the solid–pore interface network.
Another important parameter that can be tested is the
mean chord length given by
lc ¼
4Q0
.
pA
ð4Þ
3349
L. Esquivias et al. / Journal of Non-Crystalline Solids 351 (2005) 3347–3355
Table 1
Structural parameters of the models from our catalogue employed in this work
H0L7
H0L8
H0L9
HP20L10
Kmax
C
qRCP (g/cm3)
VRCP (cm3/g)
Vm (cm3 of mesopore/g)
NCM
0.31
0.22
0.28
0.38
0.58
0.59
0.61
0.47
1.28
1.29
1.34
1.03
0.33
0.32
0.29
0.52
0.31
0.27
0.27
0.35
7.66
8.53
8.87
7.05
Kmax is the distribution maximum position; C is the packing fraction; qRCP is model specific mass in the case of being formed by silica particles; VRCP is the
specific volume of the model (RCP); Vm the specific mesopore volume, i.e., after subtracting the volume of the pores larger that the particle size; NCM is the
particle average coordination number.
This parameter represents the harmonic average of the
pore and solid chord, which may be considered as the
weighted average size of both phases
For transmission electronic microscopy, samples were
stored over holy carbon films held in 3 mm diameter circular cooper grid. Film preparation was done following typical procedure [23]. For storing the sample on the holy
carbon film, grids were dove in an n-hexane suspension
of the sample. This way, some drops of this suspension
are allowed to be collected, and after the solvent evaporation, some particles of the sample stay stored over the grid.
Images were taken in a JEOL JEM-1200EX at 120 kV,
with a guaranteed resolving power of 0.2 nm lattice.
The actual Ca content of sample 30A and 30B was
determined by EDX resulting to be (3.2 ± 0.5)% weight.
spaceÕ feature and created a catalogue of pore size distributions according different condition of particle coordination
number and compaction. The models are represented as a
function of the variable K = r/R, where r is the radius of
the largest inscribed sphere in the interstice and R the radius of the particles. Finally, pore distributions can be
compared to the experimental measurement. A logarithmic
scale for K is used to make easier the fitting of the experimental data, simply sliding it along the K-axis until the position considered giving the best fit. Given the maximum,
the fit allows the particle size of a mono-disperse system
to be calculated from the maxima of the pore size distributions. From the distribution of each one of these contributions to the experimental distribution, successive sizes and
local densities of hierarchic distribution may be deduced
[25]. Data on the pore volumes associated with different
hierarchical levels, size of aggregates, the local density of
the ith aggregation level, and packing of the successive levels can be obtained. Table 1 accounts for the structural
parameters of every particular model of our catalogue used
in this paper.
2.4. Nitrogen physisorption
4. Results
The gels were texturally characterized by isothermal
nitrogen adsorption–desorption at 77 K in an automatic
device. Pore size distributions were calculated from the
desorption branch by the Barret–Joyner–Halenda (BJH)
method [24] and the specific surface by Brunauer–Emmet–Teller (BET) method.
4.1. SAXS
1
1 1
¼ þ .
lc lp ls
ð5Þ
2.3. Transmission electron microscopy
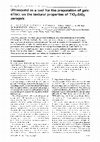
The Fig. 1 represents the intensities of the radiation scattered by the samples 54 and 30 in a log–log scale, as a function of the scattering vector q. Going towards the low-q
10 6
To asses the mechanical behavior under isostatic compression and resolve larger pore size, where N2 physisorption is not reliable, porosity was also characterized by
mercury intrusion on de-gassed monolithic composites,
according the procedure already described [1]. Hg pressure
varied from 0.1 to 390 MPa. After the run, the samples presented both compaction and intruded mercury.
10 5
3. Structural approach
I (arb. units.)
2.5. Mercury intrusion porosimetry
I 54
I 30
I 54-30
10 4
10 3
10 2
10 1
10 -1
10 0
10 1
-1
q (nm )
The gel structure is depicted as a collection of packed
spherical particles [13] and models are built on the Ôsolid
spaceÕ based on this premise. Then, we extract its Ôpore
Fig. 1. SAXS curves for 54 (full dots) and 30 (white squares) composites
aerogels. The difference between their scattered intensities is represented
below.
3350
L. Esquivias et al. / Journal of Non-Crystalline Solids 351 (2005) 3347–3355
10 5
I (arb.units.)
10 4
10 3
10 2
10 1
Ds = 2.5
I30A
I30B
I30A-30B
10 0
10 -1
10-1
100
101
q (nm-1)
Fig. 2. SAXS curves for 30A (full dots) and 30B (white diamonds)
composites aerogels with added Ca(II). The difference between their
scattered intensities is represented below (full triangles).
10 6
I(arb. units.)
10 5
10 4
which differs only in the dose of applied ultrasound energy
during their processing; so as to investigate the effect of the
ultrasound dose on the gel structure these intensities have
been subtracted. It presents a linear regime of slope
m = 3.5 along one decade permitting describe this effect
in terms of surface fractality of dimension Ds = 2.5
accounting for the effect of ultrasounds on the particle surface roughness. On the other hand, the X-ray diffraction
patterns at wide angle (7.1 < q < 57 nm1) are coincident,
presenting no structural differences at an atomic level.
This last effect can be seen by the difference between the
intensities scattered by the samples 30 and 30A besides the
difference between 30 and 30B represented in Fig. 3. These
curves inform about the modification on the sonogel structure produced by the incorporation of the Ca into the silica
atomic network. The difference between them basically lies
as before, on the shortest q region.
The value calculated for the parameters described in
Section 2 are included in Table 2.
4.2. TEM
10 3
10 2
10 1
10 0
10 -1
10 0
10 1
q (nm-1)
Fig. 3. SAXS curves of the difference between 30 and 30A data (dark
triangles) and 30B (light triangles) composites sono-aerogels. The difference between their scattered intensities is represented below.
region, the mixed polymer/colloid sono-aerogel patterns
present an increasing intensity, related with the heterogeneities at this level; as it maybe expected, they are quite alike.
To extract more information about their structural dissimilarities, we have subtracted their intensities. This curve accounts for unshared structural features. It takes only values
significantly different up to q 1 nm1. In this case, the
contributions of the finest part of the structure are removed, typically the elementary particles of the sonogel
phase and their nano-aggregates indicating a similar structure in both samples at this level. The difference indicates
the presence of larger scatterers in the 54 than in 30 sample,
whether pores or solid particles.
In the same way, in Fig. 2, it can be seen the intensities
scattered by the samples with added Ca 30A and 30B,
In Figs. 4–6 it can be seen the structural differences between the sample containing Ca and the pure silica composite. The addition of Ca influences deeply not only the
atomic structure, as it must be expected, but also the texture of the resulting aerogel. In sample 30, colloidal particles can be distinguished from the polymerized TEOS
matrix. This is formed by a uniform distribution of
sphere-like particles randomly packed of 4–5 nm mean
Fig. 4. Micrography of the 30 sample where it can be seen the fine
structure of the sonogel with some aerosil particles.
Table 2
Structural parameter calculated from SAXS, picnometry and N2 physisorption
Q0 (nm3)
54
30
30A
30B
6300
5100
6240
5590
da (g/cm3)
0.382
0.424
0.391
0.359
M (Mpa)
21.4
18.9
25.4
29.4
lim[I(q)q4]
4
15800 + 52.24q
8323 + 51.8q4
3441 + 38.21q4
2437 + 41.03q4
Us
V/S (nm)
S 0 (m2/g)
SBET (m2/g)
lc (nm)
ls (nm)
lp (nm)
0.17
0.19
0.19
0.18
0.9
1.3
3.6
5.0
840
520
630
583
126
95
39
65
0.5
0.8
2.3
2.9
0.6
1.0
2.9
3.6
3.0
4.1
12
16
3351
L. Esquivias et al. / Journal of Non-Crystalline Solids 351 (2005) 3347–3355
Fig. 5. TEM micrographies of the sample 30A. It can be described as a uniform distribution of spherical particles (a). There it can be observed a
distribution of spherical particles, larger than in the case of its pure silica counter part (Fig. 4). Rod-like parts forming pores of tenths of nm can also be
observed (b).
∆VHg /∆r (cm3g-1nm-1)
Fig. 6. TEM micrographies of the sample 30B. Similar as can be seen in sample A, uniform distribution of sphere-like and rod-like particles can be
observed here (a). However, sample B does not show golf ball-like surface (b).
0.4
0.4
0.3
0.3
0.2
0.2
H0L8
0.1
0.1
0.0
0.0
0
10
(a)
1
10
r (nm)
2
10
H0L8
0
10
(b)
1
10
2
10
r (nm)
Fig. 7. Pore volume distribution of the sample 54 (a) and 30 (b). Bold lines correspond to the applied model. Dashed line below r = 1 nm describes the tail
of the micropores distribution. The particle radius can be estimated from the tail. Lines between symbols are eye guides.
3352
L. Esquivias et al. / Journal of Non-Crystalline Solids 351 (2005) 3347–3355
∆VHg /∆r (cm3g-1nm-1)
0.015
0.015
H0L9
H0L9
0.010
0.010
0.005
0.005
H0L8
H0L8
0.000
100
10 1
10 2
0.000
100
(b)
10 3
r (nm)
(a)
101
102
103
r (nm)
Fig. 8. Pore volume distribution of the sample 30A (a) and 30B (b). Bold lines correspond to the applied model.
Table 3
Structural parameters of the sono-aerogels, calculated from the applied models
Sample
54
30
30A
30B
Level 1
Level 2
Model
r0
q1
V1
Model
r1
q2
V2
q2
C 2
V 2
–
–
H0L9
H0L9
1.1
1.1
6.2
6.1
–
–
1.96
1.92
–
–
0.055
0.025
H0L8
H0L8
H0L8
H0L8
4.8
4.8
17
15
1.79
1.58
1.85
1.86
0.14
0.21
0.010
0.016
1.31
1.31
–
–
0.60
0.60
–
–
0.31
0.31
–
–
ri (nm), qi (g cm3), Vi (cm3/g of composite), V i (cm3/g of sonogel).
4.3. N2 physisorption
The pore distributions (Figs. 7 and 8) are quite similar.
They present a well-defined feature in the range of pores radius smaller than 5 nm that overlaps with the micropores
distribution (the tails of which are sketched with dashed
lines). An interesting result is that the quotient between
the specific volumes calculated for distributions is found
to be in agreement with ratio 46/70, i.e., the relative contents on sonogel phase. This part of the distributions can
be satisfactorily described with the model H0L8, as it is
shown. They exhibit as well a peak at 10 nm caused by
the colloidal particles. These particles are decorated with
sonogel giving rise to narrow pore size distribution that
has not the condition under which our models were built up.
The density of the i-level can be calculated as
1
1
qi ¼ V i þ
;
ð6Þ
qs
where qs is the elementary particle density and Vi is the
pore specific volume at the i-level (analytically calculated).
Thus, we have referred the measured volume to the amount
of sonogel of the corresponding sample, V i , that permits to
calculate the particular density qi of the sonogel phase at
the level i. Then, the density of the composite is calculated
as the weighted average of both phases, considering that at
this level of resolution the density of the colloid phase is
that of the bulk silica, i.e., 2.2 g cm3.
Concerning the samples containing Ca, they present a
peak at 2 nm with a long queue that can be resolved with
the models H0L9 and H0L8. In both cases, an extent distribution is found between 20 and 120 nm, likely due to the
pore formed by large structural units of Ca containing par-
2.5
2.0
vHg (cm3g-1)
radius. There it can be observed isolated big colloidal particles embedded into the matrix. The Ca containing aerogel
(Figs. 5 and 6) presents a matrix structure less particulate
but rod-like, forming whether floppy or interconnected
branches of 6 nm size. In the sample 30A with lower ultrasound dose, the surface is not smooth but it has the aspect
of a golf ball. Scattered domains with the same texture than
the observed in pure silica sample are found throughout the
sample.
1.5
30A
30B
54
30
1.0
0.5
0.0
10-1
100
101
P (MPa)
102
Fig. 9. Hg intrusion curves.
103
3353
L. Esquivias et al. / Journal of Non-Crystalline Solids 351 (2005) 3347–3355
0.12
0.25
∆VHg /∆r (cm3g-1nm-1)
30
0.08
0.15
0.06
0.10
0.04
0.05
0.02
0.00
100
101
102
103
0.04
∆VHg /∆r (cm3g-1nm-1)
54
0.10
H20L10
0.20
0.00
100
101
102
103
0.04
30B
30A
0.02
0.02
H0L9
H0L7
0.00
100
101
102
103
0.00
100
101
102
103
r (nm)
r (nm)
Fig. 10. Pore size derivatives obtained from Hg intrusion porosimetry. Dots correspond to the experimental data; the dashed lines between them are guide
for the eyes only. Full lines are the pore distribution of the applied models.
ticles (Fig. 5). Between 15 and 40 nm it is found a distribution of pores, the fitting of which is difficult and not necessary to extract the major structural information. The
calculated structural information can be found in Table 3.
4.4. Mercury intrusion
Mercury intrusion curves are represented in Fig. 9 and the
pore size derivatives resulting from Hg intrusion are shown
in Fig. 10. The distributions are affected by a background
corresponding to the compaction of the sample caused by
the isostatic pressing. The effect of this compaction is
increasing the pore derivative for increasing applied pres-
sure. This is reproduced in the graph as a fake pore distribution in the rank above the threshold of intrusion of which is
complicate to extract the actual volume intruded. In all the
cases, volume reduction is above 30% for 10 MPa, but the
relative increase of the pore derivative tends asymptotically
to zero. For this reason the reproduction of peaks is only feasible at the high pressure (low pore size) extent and there it
can be observed well defined features.
The sample 30 presents a neat peak that can be fitted
satisfactorily by the model H20L10 from our catalog.
The long tail that follows corresponds to the compression
without intrusion. The calculated structural parameters appear in Table 4.
Table 4
Structural parameters calculated from the models applied to the pore size distribution from Hg intrusion
Sample
30
54
30A
30B
qa
1.42
1.52
1.50
1.08
Level 1
Level 2
Model
r1
q1
V1
Model
r2
q2
V2
H20L10
–
–
–
10.6
–
3–4
3–4
1.24
–
1.44
1.05
0.103
–
0.027
0.030
–
–
H0L7
H0L9
–
–
16
17
–
–
1.42
1.04
–
–
0.008
0.005
ri (nm), qi (g cm3), Vi (cm3/g of composite), qa (g cm3) is the density under an isostatic pressure of 390 MPa.
3354
L. Esquivias et al. / Journal of Non-Crystalline Solids 351 (2005) 3347–3355
The pore volume distribution of the sample 54 presents
two features that abides by particle of 20 nm radius, contrary to what it results for the sample 30 in which the size
rather corresponds to agglomerates of sonogel particles.
The pore of the sonogel structure collapse.
The pore volume distributions of the Ca containing
samples present their major feature at larger pore radius
than the pure silica samples. The more important feature
of these distributions is found between 20 and 80 nm, presenting two peaks that corresponds to a distribution of particles 70 nm. They show as well a shoulder for
3 nm < r < 8 nm that, in the case of the sample 30A, it
can be reproduced by the model H0L7. For the sample
30B, this feature is smaller than in the preceding case and
it can be replicated by the model H0L9. Both 30A and
30B pore distributions present peaks below 3 nm that are
not complete because are found at the limit of the experiment. The radius of the particles that give rise to these
peaks can be estimated from the position of their tails to
be 3–4 nm.
Bulk moduli (B) have been calculated from the slope of
the curve VHg vs P through the linear behavior interval (up
to 4 MPa) (Table 2).
5. Discussion
The volume/surface ratio calculated from SAXS data
according to the PorodÕs law (Table 2) is very high, one
order of magnitude longer than that calculated by BET
method. This indicates that the structure so fine that is
inaccessible to N2. This structure is formed by particles
of 1 nm in aggregates of 5 nm. This result agrees with
the harmonic averages of the pore and solid calculated
for the aerogels 54 and 30 indicate a fine structure, with
ls of the order of 1 nm. On the other hand, the addition
of Ca(II) causes enlarging the size of the particles and
pores, as it indicates the Fig. 3. The average size of the solid
chord considered as the particle, as it is defined by Eqs. (4)
and (5), is three times larger in the sample 30A than in its
pure silica counterpart. This ratio grows up to near four for
the sample 30B, which was prepared applying a higher
ultrasound dose. This parameter affects as well the pore–
solid interface. We attribute the surface fractal dimension
extracted from the difference I30A I30B to the golf balllike surface observed in the sample 30A that it is not seen
in the sample 30B.
The Ca(II) containing samples is described as a hierarchy structure of order 2 with particle radius of 17 and
15 nm for the samples 30A and 30B, respectively, and
r1 = 4.8 nm for the particles of the outer level of the pure
silica samples (Table 3). These estimates are in the ratio
3.1:1 for the sample 30A, and 3.5:1 in the sample 30B.
The calculated interstitial volumes of these structures are
3.8% and 5.9% of the Vm calculated for this model (Table
3) the meaning of which is the relative volume fraction of
the samples occupied by such structures. As it can be deduce from SAXS data, an effect of the ultrasounds is to reduce the interstitial volume at the lowest level (particles of
6 nm radius) from V1 = 0.22Vm to 0.10Vm because the
number of particle of the upper level increases. The meaning of these numbers is that 22% volume and 10% volume
of the samples 30A and 30B, respectively, abides by the
proposed model. This reduction occurs by collapse of the
pores between the smallest particles. No distribution tails
of small particles 1 nm radius are seen in Ca(II) containing samples.
The bulk modulus (M) increases when Ca(II) is added
and with the applied ultrasound dose (it increases 34.4%
and 55.5% for the sample 30A and 30B, respectively, respect to their pure silica counterpart); although it takes
similar value for the pure silica samples. Thus, when the
samples are isostatically compressed they behave differently
one from another from a structural point of view. Thus, the
sample 30 compacts and forms an RCP structure with
agglomerates 10 nm radius that occupies 30% of the sample volume. The rest up to 70% corresponding to the sonogel phase would be occupied by smaller aggregates, of size
below the experiment resolution (2 nm). No traces of colloidal particle structure appear because the concentration
of which has not attained the percolation level. On the contrary, the pore distribution of the sample 54 when it is
modified by isostatic compression shows only feature of
the colloidal particles superstructure.
The Ca(II) containing samples keeps their structure at
their lowest level similar to that described from N2 physisorption because of the presence of particles between 3–4
and 16–17 nm radius. However, the compression collapse
partially the interstitial volume at this level that is reduced
from 0.038Vm (sample 30A) and 0.059Vm (sample 30B) up
to V2 = 0.02Vm.
6. Conclusion
In mixed polymer/colloid silica aerogels, the structure of
the polymer phase prepared with ultrasounds is very fine
consisting in aggregates of 5 nm radius formed by elementary particles 1 nm radius. No traces of colloidal particle structure appear in the sample containing 30% weight of
colloidal particles but the pore distribution of the sample
54 when it is modified by isostatic compression shows only
feature of the colloidal particles superstructure.
Adding 3% weight Ca(II) causes enlarging the size of the
particles and pores and increasing of the stiffness. The average size of the particle increases more than three times respect to its size in its pure silica counterpart. The higher the
applied ultrasound dose the larger the particles. The ultrasound dose affects as well the interface pore–solid; low dose
produce a rough particle surface. Under compression
Ca(II) containing samples retain a structure based on particles 70 nm average radius.
L. Esquivias et al. / Journal of Non-Crystalline Solids 351 (2005) 3347–3355
Acknowledgments
The authors are grateful for financial support from the
Spanish Government: Ministerio de Ciencia y Tecnologı́a
(Projects: MAT2001-3805 and MAT2002-0859) and Junta
de Andalucı́a (TEP 0115). The authors are also grateful
to Degussa Iberia, S.A. for supplying Aerosil OX-50 and
Fernando Conde from the Universidad Complutense de
Madrid, (Spain) who provided the SAXS data.
References
[1] M.J. Mosquera, M. Bejarano, N. de la Rosa-Fox, L. Esquivias,
Langmuir 19 (2003) 951.
[2] L. Esquivias, N. de la Rosa-Fox, M. Bejarano, M.J. Mosquera,
Langmuir 20 (2004) 3816.
[3] E. Blanco, L. Esquivias, R. Litrán, M. Piñero, M. Ramı́rez-delSolary, N. de la Rosa-Fox, Appl. Organometal. Chem. 13 (1999) 399.
[4] J. Zarzycki, in: R.W. Cahn, E.A. Davis, I.M. Ward (Eds.), Glasses
and the Vitrous State, Cambridge Solid State Science Series,
Cambridge University Press, p. 40.
[5] K. Yamahara, K. Okazaki, Fluid Phase Equilibria 144 (1998) 449.
[6] L.D. Gelb, K.E. Gubbins, Langmuir 15 (1999) 305.
[7] A. Emmerling, J. Fricke, J. Sol–Gel Sci. Technol. 8 (1997) 781.
[8] M. Grzegorczyk, M. Rybaczuk, K. Maruszewski, Chaos Solitons
Fractals 19 (4) (2004) 1003.
[9] H. Ma, J.H. Prevost, G.W. Scherer, Int. J. Solids Struct. 39 (2002)
4605.
3355
[10] H. Ma, A.P. Roberts, J.H. Prevost, R. Jullien, G.W. Scherer, J. NonCryst. Solids 277 (2000) 127.
[11] J. Primera, A. Hasmy, T. Woignier, J. Sol–Gel Sci. Technol. 26 (2003)
671.
[12] T. Woignier, F. Despetis, A. Alaoui, P. Etienne, J. Phalippou, J. Sol–
Gel Sci. Technol. 19 (2000) 163.
[13] J. Rodrı́guez-Ortega, Modelos de estructura de geles densos (Models
of structure of dense gels), Ph.D. thesis, Universidad de Cádiz, Spain,
1996.
[14] L. Esquivias, J. Rodrı́guez-Ortega, C. Barrera-Solano, N. de la RosaFox, J. Non-Cryst. Solids 225 (1998) 239.
[15] C. Marlière, T. Woignier, et al., J. Non-Cryst. Solids 285 (2001) 175.
[16] J. Rodrı́guez-Ortega, L. Esquivias, J. Sol–Gel Sci. Technol. 8 (1997)
117.
[17] L. Esquivias, A. Gonzalez-Pecci, J. Rodrı́guez-Ortega, C. BarreraSolano, N. de la Rosa-Fox, Ceram. Trans. 95 (1998) 183.
[18] M. Toki, S. Miyashita, T. Takeuchi, S. Kanbe, A. Kochi, J. NonCryst. Solids 100 (1988) 479.
[19] L. Esquivias, J. Zarzycki, in: M.D. Baró, N. Clavaguera (Eds.),
Current Topics on Non-Crystalline Solids, World Scientific, Singapore, 1986, p. 409.
[20] M. Prassas, J. Phalippou, J. Zarzycki, J. Mater. Sci. 19 (1984) 1656.
[21] L. Esquivias, J. Rodrı́guez-Ortega, C. Barrera-Solano, N. de la RosaFox, J. Non-Cryst. Solids 225 (1) (1998) 239.
[22] G. Porod, Kolloid Z. 124 (1951) 83.
[23] A. Fukami, K. Adachi, J. Electron Microsc. 14 (2) (1965) 112.
[24] E.P. Barret, L.G. Joyner, P.P. Halenda, J. Am. Chem. Soc. 73 (1951)
373.
[25] L. Esquivias, N. de la Rosa-Fox, M. Bejarano, M.J. Mosquera,
Langmuir 20 (2004) 3416.
Academia.edu no longer supports Internet Explorer.
To browse Academia.edu and the wider internet faster and more securely, please take a few seconds to upgrade your browser.
Structure of bioactive mixed polymer/colloid aerogels
Journal of Non-Crystalline Solids, 2005
...Read more
Related Papers
Chemistry of Materials, 2009
Download

Journal of Materials Science, 1993
Download

Download


Bible Leage Quarterly, 2023
Download


Download


