Article
Tracking Five Millennia of Horse Management with
Extensive Ancient Genome Time Series
Graphical Abstract
Authors
Antoine Fages, Kristian Hanghøj,
Naveed Khan, ..., Alan K. Outram,
Pablo Librado, Ludovic Orlando
Correspondence
ludovic.orlando@univ-tlse3.fr
In Brief
Genome-wide data from 278 ancient
equids provide insights into how ancient
equestrian civilizations managed,
exchanged, and bred horses and indicate
vast loss of genetic diversity as well as the
existence of two extinct lineages of
horses that failed to contribute to modern
domestic animals.
Highlights
d
Two now-extinct horse lineages lived in Iberia and Siberia
some 5,000 years ago
d
Iberian and Siberian horses contributed limited ancestry to
modern domesticates
d
Oriental horses have had a strong genetic influence within
the last millennium
d
Modern breeding practices were accompanied by a
significant drop in genetic diversity
Fages et al., 2019, Cell 177, 1419–1435
May 30, 2019 ª 2019 The Author(s). Published by Elsevier Inc.
https://doi.org/10.1016/j.cell.2019.03.049
�Article
Tracking Five Millennia of Horse Management
with Extensive Ancient Genome Time Series
Antoine Fages,1,2,88 Kristian Hanghøj,1,2,88 Naveed Khan,2,3,88 Charleen Gaunitz,2 Andaine Seguin-Orlando,1,2
Michela Leonardi,2,4 Christian McCrory Constantz,2,5 Cristina Gamba,2 Khaled A.S. Al-Rasheid,6 Silvia Albizuri,7
Ahmed H. Alfarhan,6 Morten Allentoft,2 Saleh Alquraishi,6 David Anthony,8 Nurbol Baimukhanov,9 James H. Barrett,10
Jamsranjav Bayarsaikhan,11 Norbert Benecke,12 Eloı́sa Bernáldez-Sánchez,13 Luis Berrocal-Rangel,14
Fereidoun Biglari,15 Sanne Boessenkool,16 Bazartseren Boldgiv,17 Gottfried Brem,18 Dorcas Brown,8 Joachim Burger,19
Eric Crubézy,1 Linas Daugnora,20 Hossein Davoudi,21,22 Peter de Barros Damgaard,2
Marı́a de los Ángeles de Chorro y de Villa-Ceballos,23 Sabine Deschler-Erb,24 Cleia Detry,25 Nadine Dill,24
(Author list continued on next page)
1Laboratoire
d’Anthropobiologie Moléculaire et d’Imagerie de Synthèse, CNRS UMR 5288, Université de Toulouse, Université Paul Sabatier,
31000 Toulouse, France
2Lundbeck Foundation GeoGenetics Center, University of Copenhagen, 1350K Copenhagen, Denmark
3Department of Biotechnology, Abdul Wali Khan University, Mardan, Pakistan
4Evolutionary Ecology Group, Department of Zoology, University of Cambridge, Cambridge CB2 3EJ, UK
5Institute for Immunity, Transplantation and Infection, Stanford University, Stanford, CA 94305, USA
6Zoology Department, College of Science, King Saud University, Riyadh 11451, Saudi Arabia
7Seminari d’Estudis i Recerques Prehistoriques, HAR2017-87695-P, Universitat de Barcelona, Barcelona, Spain
8Anthropology Department, Hartwick College 1, Oneonta, NY 13820, USA
9Shejire DNA project, 050046 Almaty, Kazakhstan
10McDonald Institute for Archaeological Research, Department of Archaeology, University of Cambridge, Cambridge CB2 3ER, UK
11National Museum of Mongolia, Ulaanbaatar 210646, Mongolia
12Deutsches Archäologisches Institut (DAI), 14195 Berlin, Germany
13Laboratorio de Paleontologia y Paleobiologia, Instituto Andaluz del Patrimonio Historico, Sevilla, Spain
14Departamento de Prehistoria y Arqueologı́a, Universidad Autónoma de Madrid, Madrid, Spain
15Department of Paleolithic, National Museum of Iran, 1136918111, Tehran, Iran
16Centre for Ecological and Evolutionary Synthesis (CEES), Department of Biosciences, University of Oslo, Postbox 1066, Blindern, 0316
Oslo, Norway
17Ecology Group, Department of Biology, School of Arts and Sciences, National University of Mongolia, Ulaanbaatar 14201, Mongolia
18Institute of Animal Breeding and Genetics, Department of Biomedical Sciences, Veterinary University of Vienna, 1210 Vienna, Austria
19Palaeogenetics Group, Institute of Organismic and Molecular Evolution (iOME), Johannes Gutenberg-University Mainz, 55099 Mainz,
Germany
20Osteological material research laboratory, Klaipeda
_
_
university, Klaipeda
92294, Lithuania
21Department of Osteology, National Museum of Iran, 1136918111, Tehran, Iran
22Department of Archaeology, Faculty of Humanities, Tarbiat Modares University, Tehran, Iran
(Affiliations continued on next page)
SUMMARY
Horse domestication revolutionized warfare and
accelerated travel, trade, and the geographic expansion of languages. Here, we present the largest DNA
time series for a non-human organism to date,
including genome-scale data from 149 ancient animals and 129 ancient genomes (R1-fold coverage),
87 of which are new. This extensive dataset allows
us to assess the modern legacy of past equestrian
civilizations. We find that two extinct horse lineages
existed during early domestication, one at the far
western (Iberia) and the other at the far eastern range
(Siberia) of Eurasia. None of these contributed significantly to modern diversity. We show that the influ-
ence of Persian-related horse lineages increased
following the Islamic conquests in Europe and Asia.
Multiple alleles associated with elite-racing, including
at the MSTN ‘‘speed gene,’’ only rose in popularity
within the last millennium. Finally, the development
of modern breeding impacted genetic diversity
more dramatically than the previous millennia of human management.
INTRODUCTION
Horses provided humans with the first opportunity to spread
genes, diseases, and culture well above their own speed (Allentoft et al., 2015; Haak et al., 2015; Rasmussen et al., 2014).
Horses remained paramount to transportation even after the
Cell 177, 1419–1435, May 30, 2019 ª 2019 The Author(s). Published by Elsevier Inc. 1419
This is an open access article under the CC BY-NC-ND license (http://creativecommons.org/licenses/by-nc-nd/4.0/).
�Maria do Mar Oom,26 Anna Dohr,27,28,29 Sturla Ellingvåg,30 Diimaajav Erdenebaatar,31 Homa Fathi,21,32 Sabine Felkel,18
Carlos Fernández-Rodrı́guez,33 Esteban Garcı́a-Viñas,34 Mietje Germonpré,35 José D. Granado,24 Jón H. Hallsson,36
Helmut Hemmer,19 Michael Hofreiter,37 Aleksei Kasparov,38 Mutalib Khasanov,39 Roya Khazaeli,21,32 Pavel Kosintsev,40
Kristian Kristiansen,41 Tabaldiev Kubatbek,42 Lukas Kuderna,43 Pavel Kuznetsov,44 Haeedeh Laleh,32,45
Jennifer A. Leonard,46 Johanna Lhuillier,47 Corina Liesau von Lettow-Vorbeck,48 Andrey Logvin,49 Lembi Lõugas,50
Arne Ludwig,51,52 Cristina Luis,53,54,55 Ana Margarida Arruda,25 Tomas Marques-Bonet,43,56,57,58 Raquel Matoso Silva,55
Victor Merz,59 Enkhbayar Mijiddorj,31 Bryan K. Miller,60 Oleg Monchalov,44 Fatemeh A. Mohaseb,21,32,61 Arturo Morales,62
Ariadna Nieto-Espinet,63,64 Heidi Nistelberger,16 Vedat Onar,65 Albı́na H. Pálsdóttir,16,36 Vladimir Pitulko,38
�a,69 Natalia Roslyakova,44
Konstantin Pitskhelauri,66 Mélanie Pruvost,67 Petra Rajic Sikanjic,68 Anita Rapan Papes
Alireza Sardari,70 Eberhard Sauer,71 Renate Schafberg,72 Amelie Scheu,19 Jörg Schibler,24 Angela Schlumbaum,24
Nathalie Serrand,61,73 Aitor Serres-Armero,43 Beth Shapiro,74 Shiva Sheikhi Seno,21,32,61 Irina Shevnina,49
Sonia Shidrang,75 John Southon,76 Bastiaan Star,16 Naomi Sykes,77,78 Kamal Taheri,79 William Taylor,80
� Vukic
�evic
�,81 Simon Trixl,29 Dashzeveg Tumen,82 Sainbileg Undrakhbold,17
Wolf-Rüdiger Teegen,27,28 Tajana Trbojevic
(Author list continued on next page)
23Centro
de Biologı́a Molecular Severo Ochoa (CSIC-UAM), E-28049, Madrid, Spain
prähistorische und naturwissenschaftliche Archäologie (IPNA), 4055 Basel, Switzerland
25Uniarq, Centro de Arqueologia da Universidade de Lisboa, Faculdade de Letras da Universidade de Lisboa, 1600-214 Lisboa, Portugal
26CE3C-Centre for Ecology, Evolution and Environmental Changes, Faculdade de Ciências, Universidade de Lisboa, 1749-016 Lisboa,
Portugal
27Institute for Pre- and Protohistoric Archaeology and Archaeology of the Roman Provinces, Ludwig-Maximilians-University Munich, 80539
München, Germany
28ArchaeoBioCenter, Ludwig-Maximilians-University Munich, 80539 München, Germany
29Institute of Palaeoanatomy, Domestication Research and History of Veterinary Medicine, Ludwig-Maximilians-University Munich, 80539
München, Germany
30Explico Foundation, 6900 Florø, Norway
31Department of Archaeology, Ulaanbaatar State University, Ulaanbaatar 51, Mongolia
32Archaezoology section, Bioarchaeology Laboratory of the Central Laboratory, University of Tehran, Tehran CP1417634934, Iran
33Departamento de Historia, Facultad de Filosofı́a y Letras, Universidad de León, León, Spain
34Departamento de Sistemas Fı́sicos, Quı́micos y Naturales, Universidad Pablo de Olavide, 41013 Sevilla, Spain
35Operational Direction, Earth and History of Life, Royal Belgian Institute of Natural Sciences, 1000, Brussels, Belgium
36Faculty of Agricultural and Environmental Sciences, The Agricultural University of Iceland, Keldnaholti - Árleyni 22, 112 Reykjavı́k, Iceland
37University of Potsdam, Faculty of Mathematics and Natural Sciences, Institute for Biochemistry and Biology, 14476 Potsdam, Germany
38Institute for the History of Material Culture, Russian Academy of Sciences, St. Petersburg 191186, Russia
39Archaeology Institute of Samarkand, Uzbekistan
40Institute of Plant and Animal Ecology, Urals Branch of the Russian Academy of Sciences, Ekaterinburg 620144, Russia
41Department of Historical Studies, University of Gothenburg, Gothenburg, Sweden
42Department of History, Kyrgyz-Turkish Manas University, Bishkek, Kyrgyzstan
43Institut de Biologia Evolutiva, (CSIC-Universitat Pompeu Fabra), PRBB, Barcelona, Catalonia 08003, Spain
44Samara State University of Social Science and Education, Samara, Russia
45Department of Archaeology, Faculty of Humanities, University of Tehran, Iran
46Conservation and Evolutionary Genetics Group, Estación Biológica de Doñana (EBD-CSIC), 41092 Sevilla, Spain
47Laboratoire Archéorient, UMR 5133, Maison de l’Orient et de la Méditerranée, 69365 Lyon Cedex 7, France
48Departamento de Prehistoria y Arqueologı́a, Universidad Autónoma de Madrid, Madrid, Spain
49Laboratory for Archaeological Research, Faculty of History and Law, Kostanay State University, Kostanay, Kazakhstan
50Archaeological Research Collection, Tallinn University, 10130 Tallinn, Estonia
51Department of Evolutionary Genetics, Leibniz Institute for Zoo and Wildlife Research, 10315 Berlin, Germany
52Faculty of Life Sciences, Albrecht Daniel Thaer-Institute, Humboldt University Berlin, 10115 Berlin, Germany
53Museu Nacional de História Natural e da Ciência, Universidade de Lisboa, Lisboa, Portugal
54Centro Interuniversitário de História das Ciências e da Tecnologia (CIUHCT), Faculdade de Ciências, Universidade de Lisboa, Lisboa,
Portugal
55Instituto Universitário de Lisboa (ISCTE-IUL), CIES-IUL, Lisboa, Portugal
56Catalan Institution of Research and Advanced Studies (ICREA), 08010 Barcelona, Spain
57CNAG-CRG, Centre for Genomic Regulation (CRG), Barcelona Institute of Science and Technology (BIST), 08028 Barcelona, Spain
58Institut Català de Paleontologia Miquel Crusafont, Universitat Autònoma de Barcelona, Edifici ICTA-ICP, c/ Columnes s/n, 08193,
Cerdanyola del Vallès, Barcelona, Spain
59S.Toraighyrov Pavlodar State University, Joint Research Center for Archeological Studies, 637000 Pavlodar, Kazakhstan
60University of Oxford, Faculty of History, George Street, Oxford, OX1 2RL, UK
61Centre National de la Recherche Scientifique, Muséum National d’Histoire Naturelle, Archéozoologie, Archéobotanique, Sociétés,
Pratiques et Environnements (UMR 7209), 75005 Paris, France
62Laboratory of Archaeozoology, Department Biologı́a, Universidad Autónoma de Madrid, Madrid, Spain
24Integrative
(Affiliations continued on next page)
1420 Cell 177, 1419–1435, May 30, 2019
�Emma Usmanova,83 Ali Vahdati,70 Silvia Valenzuela-Lamas,63 Catarina Viegas,25 Barbara Wallner,18 Jaco Weinstock,84
Victor Zaibert,85 Benoit Clavel,61 Sébastien Lepetz,61 Marjan Mashkour,21,32,61 Agnar Helgason,86 Kári Stefánsson,86
Eric Barrey,87 Eske Willerslev,2 Alan K. Outram,78 Pablo Librado,1,2 and Ludovic Orlando1,2,89,*
63Archaeology
of Social Dynamics Group (ADS), Institució Milà i Fontanals-Consejo Superior de Investigaciones Cientı́ficas (IMF-CSIC),
08001 Barcelona, Spain
64Grup d’Investigació Prehistòrica, HAR2016-78277-R, Universitat de Lleida, 25003 Lleida, Spain
65Osteoarchaeology Practice and Research Center and Department of Anatomy, Faculty of Veterinary Medicine, Istanbul
University-Cerrahpasxa, 34320, Avcılar, Istanbul, Turkey
66Ivane Javakhishvili Tbilisi State University, Tbilisi 0179, Georgia
67Université de Bordeaux, CNRS, UMR 5199-PACEA, 33615 Pessac Cedex, France
68Institute for Anthropological Research, Gajeva 32, 10000 Zagreb, Croatia
69Vinkovci Municipal Museum, 32 100 Vinkovci, Croatia
70Iranian Center for Archaeological Research (ICAR), Iranian Cultural Heritage, Handicrafts, and Tourism Organization (ICHHTO),
1136918111, Tehran, Iran
71School of History, Classics and Archaeology, The University of Edinburgh, Edinburgh, EH8 9AG, UK
72Central Natural Science Collections (ZNS), Martin Luther University Halle-Wittenberg, Domplatz 4, 06108 Halle (Saale), Germany
73INRAP Guadeloupe, Centre de recherches archéologiques, UMR 7209 CNRS/MNHN, 97113 Gourbeyre, Guadeloupe
74Department of Ecology and Evolutionary Biology and Howard Hughes Medical Institute, University of California, Santa Cruz, Santa Cruz, CA
95060, USA
75Saeedi Institute for Advanced Studies, University of Kashan, Kashan 87317-51167, Iran
76Department Earth System Science, University of California, Irvine, Irvine, CA 92697, USA
77Department of Archaeology, University of Nottingham, Nottingham, NG7 2RD, UK
78Department of Archaeology, University of Exeter, Exeter, EX4 4QE, UK
79Kermanshah Regional Water Authority, Kermanshah 67145-1466, Iran
80Max Planck Institute for the Science of Human History, 07745 Jena, Germany
81Department of Anatomy, Histology and Embryology, Faculty of Veterinary Medicine, University of Zagreb, 10 000 Zagreb, Croatia
82Department of Anthropology and Archaeology, School of Arts and Sciences, National University of Mongolia, Ulaanbaatar 14201, Mongolia
83Saryarka Archaeological Institute of Buketov Karaganda State University, Karaganda 100074, Kazakhstan
84Faculty of Humanities (Archaeology), University of Southampton, Avenue Campus, Highfield, Southampton SO17 1BF, UK
85Scientific Research Institute of Archaeology and Steppe Civilizations, Al Farabi Kazakh National University, 050040 Almaty, Kazakhstan
86deCODE Genetics, 101 Reykjavik, Iceland
87GABI UMR1313, INRA, AgroParisTech, Université Paris-Saclay, Jouy-en-Josas, France
88These authors contributed equally
89Lead Contact
*Correspondence: ludovic.orlando@univ-tlse3.fr
https://doi.org/10.1016/j.cell.2019.03.049
advent of steam locomotion and until the widespread use of motor vehicles (Kelekna, 2009). Horses also revolutionized warfare,
pulling chariots at full speed in the Bronze Age, providing the
foundation for mounted battle in the early Iron Age, and facilitating the spread of cavalry during Antiquity (Drews, 2004).
Today, horses remain essential to the economy of developing
countries and to the leisure and racing industries of developed
countries (Faostat, 2009).
The earliest archaeological evidence of horse milking, harnessing, and corralling is found in the �5,500-year-old Botai
culture of Central Asian steppes (Gaunitz et al., 2018; Outram
et al., 2009; see Kosintsev and Kuznetsov, 2013 for discussion).
Botai-like horses are, however, not the direct ancestors of modern domesticates but of Przewalski’s horses (Gaunitz et al.,
2018). The genetic origin of modern domesticates thus remains
contentious, with suggested candidates in the Pontic-Caspian
steppes (Anthony, 2007), Anatolia (Arbuckle, 2012; Benecke,
2006), and Iberia (Uerpmann, 1990; Warmuth et al., 2011). Irrespective of the origins of domestication, the horse genome is
known to have been reshaped significantly within the last
�2,300 years (Librado et al., 2017; Wallner et al., 2017; Wutke
et al., 2018). However, when and in which context(s) such
changes occurred remains largely unknown.
RESULTS
Genome Dataset
To clarify the origins of domestic horses and reveal their subsequent transformation by past equestrian civilizations, we generated DNA data from 278 equine subfossils with ages mostly
spanning the last six millennia (n = 265, 95%) (Figures 1A and
1B; Table S1; STAR Methods). Endogenous DNA content was
compatible with economical sequencing of 87 new horse genomes to an average depth-of-coverage of 1.0- to 9.3-fold (median = 3.3-fold; Table S2). This more than doubles the number of
ancient horse genomes hitherto characterized. With a total of
129 ancient genomes, 30 modern genomes, and new genomescale data from 132 ancient individuals (0.01- to 0.9-fold, median = 0.08-fold), our dataset represents the largest genomescale time series published for a non-human organism (Tables
S2, S3, and S4; STAR Methods).
Most specimens were genetically confirmed as horses (175
males, 70 females; Table S1; STAR Methods). Six belonged to
other equine species, including three hemiones from Chalcolithic, Bronze, and Iron Age sites of Iran and three Roman and
Byzantine donkeys (Figure 1A). A total of 27 specimens were
genetically assigned to mules (the offspring of a donkey jack
Cell 177, 1419–1435, May 30, 2019 1421
�Number of samples
per site:
A
32
25
17
9
1
Identification of
ancient equids:
Evreux, 1717-1917
Saint-Quentin, 1817-2017
asses
Boinville, 1717-1917
Solothurn-Vigier, 1717-2017
hemiones
Tepe Hasanlu, 2617-2930
Sagzabad, 3017-3217
Saint-Just, 2047-2227
Chartres, 1917
mules
Yenikapi, 1156-1730
Tepe Mehr Ali, 5000-8000
horses
coverage < 1X
Saint-Claude (Guadeloupe), 217-267
Age
B
40,000
30,000
20,000
10,000
5,000
4,000
3,000
2,000
1,000
0
horses
coverage > 1X
published horses
coverage > 1X
10
20
30
40
50
60
70
80
90
100
110
120
130
140
150
160
170
180
190
200
210
220
230
240
250
260
270
Figure 1. Equine Archaeological Remains
(A) Location of archaeological sites. Pie charts are proportional to the total number of specimens providing DNA data compatible with the determination of sex,
species and hybrid status. The names and temporal ranges (years ago) of the sites where hybrids and non-caballine species could be genetically identified are
indicated.
(B) Temporal distribution of ancient specimens. Eight individuals showing uncertain age determination are not included.
See also Tables S1, S2, S3, and S4.
and a horse mare), which are difficult to identify in fragmentary
fossil records using morphology alone (Schubert et al., 2017).
The oldest mules identified are from the La Tène Iron Age site
of Saint-Just (France), but they were also found in Roman and
medieval Europe as well as Byzantine Turkey.
Changes in Horse Management through Time and Their
Impact on Diversity
Previous work comparing the sequence variation present in
modern horse genomes and the genomes of 11 ancient horses
belonging to the Scythian Pazyryk culture suggested important
changes in the management of available genetic resources
within the last �2,300 years (Librado et al., 2017). Our thorough
temporal genome sampling allowed us to delineate more precisely when these changes happened. We ensured accurate diversity estimates in ancient horses by only considering genomes
sequenced at minimum 1-fold depth-of-coverage and implementing the three following approaches. First, enzymatic treatment against the most prevalent post-mortem DNA damage
helped avoid inflating past diversity estimates (STAR Methods).
Second, only sites least affected by damage, such as nonCpG dinucleotides and transversion sites, were considered.
Third, we checked that diversity measurements were robust
both to residual error rates and sequencing depth (Figure S1;
STAR Methods).
All modern breeds investigated here showed an �16.4% median drop in individual heterozygosity levels relative to horses
that lived prior to �200 years ago (Wilcoxon test, p value =
2.0 3 10 13) (Figures 2C and S2; STAR Methods). This contrasts
with steady heterozygosity levels during the previous four
millennia, reflecting that earlier equestrian civilizations managed
1422 Cell 177, 1419–1435, May 30, 2019
and maintained higher levels of genetic diversity. A similar trend
was found in autosomal p diversity, which severely declined during the most recent time interval with sufficient data to enable
calculations (i.e., the last �400 years). Autosomal p profiles
also supported a demographic expansion from La Tène to Roman Europe, possibly pertaining to the growing demand for
horses during Roman times (Figure 2A; STAR Methods).
The recent decays of autosomal p diversity and heterozygosity suggest a severe reduction in horse breeding stock within the
last few centuries, parallel to the significant changes in agricultural practices underpinning modern studs. This reduction in
effective size is expected to have increased mutational loads
genome-wide by reducing the efficacy of purifying selection
(Cruz et al., 2008; Schubert et al., 2014a). To test this, we calculated conservative estimates for the mutational loads at homozygous sites within protein-coding genes and accounting for
possible inbreeding differences (Librado et al., 2017) (calculations at heterozygous sites were proven impracticable, in agreement with Pedersen et al. [2017]) (Figures S3A and S3B). As
expected, mutational load estimates correlated with reduced
selection, as measured from differential diversity patterns at
non-synonymous and synonymous sites, and from sites classified as deleterious and non-deleterious on the basis of their
evolutionary conservation across multiple vertebrate species
(STAR Methods). We found mutational loads increasing during
the last �200 years, parallel to changes in breed reproductive
management (�4.6% median load increment; Wilcoxon test,
p value = 8.3 3 10 12) (Figure 2D). Our data therefore support
the contention that reproductive strategies implemented in the
last few centuries reduced the chance to eliminate deleterious
variants from domestic horse stock.
�A
Autosomes
Y chromosome
Y chr. / Autosomes
N/A
Modern - IceShet
C
mtDNA
N/A
Modern - MonYak
0.0006
Modern - other horses
N/A
Witter Place
N/A
Heterozygosity
Culture
Great Mongolian
Empire
Aukstaiciai
Byzantine
Gallo-Roman
0.0005
Roman
La Tène
0.0004
Scythian
N/A
N/A
Xiongnu
5
4
00
00
0
0.
6
0.
0.
0.
0
0.
2
0.
4
0.
00
1
0. 2
00
13
0.
00
1
0. 4
00
15
0.
00
0. 01
00
0. 02
00
0. 03
00
04
Deer Stone
1,000
B
2,000
3,000
4,000
Time (years ago)
Nucleotide diversity
Ancient Modern
D
Autosomes
0.0016
0.0033
0.0015
0.0013
Genetic Load
Nucleotide Diversity
0.0014
0.0012
Y chromosome
0.0004
0.0032
0.0031
0.0003
0.0002
0.0030
0.0001
0
1,000
Europe
2,000
Time (years ago)
Asia
Modern
Number of samples
per time window
3,000
5
10
15
0
1,000
2,000
3,000
Time (years ago)
4,000
Ancient Modern
Figure 2. Genetic Diversity Patterns
(A) Nucleotide diversity (p) estimates and Y-to-autosomal p ratio per equestrian culture. The dashed red line indicates Y-to-autosomal p ratios of 0.25, corresponding to the expected ratio under even male reproductive success.
(B) Autosomal and Y chromosome p estimates through time. See also Figure S2E for more details.
(C) Individual error-corrected heterozygosity estimates. Only transversions were considered to minimize the impact of post-mortem DNA damage. See also
Figures S1 and S2.
(D) Conservative individual mutational loads from homozygous sites. Violin plots contrast the heterozygosity levels and genetic loads present in ancient (pink) and
modern (blue) genomes belonging to the DOM2 lineage.
See also Figure S3 and Table S5.
The Choice of Stallions for Reproduction and Its Impact
in the Last 2,000 Years
The Y chromosome diversity is extremely limited in modern horses (Lindgren et al., 2004) but was greater in the past (Librado
et al., 2017; Lippold et al., 2011), indicating that specific stallion
lines have become increasingly prominent. Previous work
showed that this process started �900 BCE–400 CE, however,
on the basis of only four polymorphic SNPs (Wutke et al.,
2018). We thus leveraged our 105 stallions and the �1,500 orthologous polymorphic sites recovered at monocopy regions
to gain further temporal resolution for this reduction in Y chromosome diversity (STAR Methods). We considered all past time intervals of 250 years represented by a minimum of 3 males in Asia
and in Europe separately, to limit the impact of geographic structure. This revealed that Y chromosome nucleotide diversity (p)
decreased steadily in both continents during the last �2,000
years but dropped to present-day levels only after 850–1,350
CE (Figures 2B and S2E; STAR Methods). This is consistent
with the dominance of an �1,000- to 700-year-old oriental haplogroup in most modern studs (Felkel et al., 2018; Wallner et al.,
Cell 177, 1419–1435, May 30, 2019 1423
�Somali 0226A
0226A00
Somali
Native Iberian (IBE)
ArchaicIberian
Figure 3. TreeMix Phylogenetic Relationships
Extinct Russian (E. lenensis)
Botai
Botai
Borly4
Borly4
The tree topology was inferred using a total of
�16.8 million transversion sites and disregarding
migration. The name of each sample provides the
archaeological site as a prefix, and the age of the
specimen as a suffix (years ago). Name suffixes (E)
and (A) denote European and Asian ancient horses, respectively. See Table S5 for dataset information.
See also Figure S7.
Przewalski
Przewalski
PrzewalskiParatype
Paratype118
118
Przewalski
DunaujvarosDuk2
Duk24077
4077 (E)
Dunaujvaros
ElsVilarsUE4618
UE46182672
2672 (E)
ElsVilars
Halvai KSH4
KSH44017
4017 (A)
Halvai
SintashtaNB46
NB464023
4023 (A)
Sintashta
Deer Stone
Stone (A)
Deer
Scythian (A)
Scythian
Boz Adyr (A)
BozAdyr
Xiongnu (A)
Xiongnu
Karasuk (A)
Karasuk
Ridala (E)
OlonKurinGol
Olon Kurin Gol (A)
Ridala
SaadjarveSaa1
Saa11117
1117 (E)
Saadjarve
Pictish and Viking (E)
Viking
Shetland
Shetland
Icelandic
Icelandic
Aukstaiciai (E)
Aukstaiciai
Roman (E)
Roman
Gallo-Roman (E)
GalloRoman
La Tène (E)
LaTene
Mainz Mzr1
Mzr11373
1373 (E)
Mainz
Sassanid/Persian (A)
Parthian
ZhanaturmusIssyk1
Issyk11143
1143 (A)
Zhanaturmus
Gregorevka4PAVH2
PAVH21192
1192 (A)
Gregorevka4
Great Mongolian Empire (A)
GreatMongolianEmpire
KhotontUCIE2012x85
UCIE2012x851291
1291 (A)
Khotont
Nustar (E)
NuStar
Jeju 0275A 0
Jeju
Mongolian
Mongolian
Yakutian
Yakutian
TumeskiCGG101397
CGG101397192
192 (A)
Tumeski
Byzantine (E)
Byzantine
Influence of Persian Lines Post
C7th–C9th
Duelmener0238A 0
Duelmener
We next tracked evidence for animal
Sorraia0236A 0
Sorraia
exchange between past cultures by mapFMontagnes0065A 0
FMontagnes
Connemara0004A 0
ping genetic variation through space and
Connemara
Heavy Warmblood
HeavyWarmblood
0269A 0
time. We included all samples belonging
Morgan
Morgan
to a particular archaeological culture, as
Marwari0239A 0
Marwari
BelgheisTrBWBX116
TrBWBX116485
485 (A)
long as they collectively accumulated a
Belgheis
Arabian0237A 0
Arabian
minimal genome depth-of-coverage of
Standardbred0081A 0
Standardbred
2-fold (n = 186, Table S5). TreeMix reconHanoverian
Hanoverian 0235A 0
structions (Pickrell and Pritchard, 2012)
Quarter
Thoroughbred
Thoroughbred
Quarter
0073A 0
revealed that modern Shetland and Icelandic ponies were most closely related
to a group of north European horses
including pre-Viking Pictish horses from
C6th–C7th Britain, Viking horses, and one C9th–C10th horse
from Estonia (Saardjave) (Figure 3; STAR Methods). This is in
line with the historical expansion of Scandinavian seafaring warriors in the British Isles and Iceland between the late C8th–C11th
(Brink and Price, 2008). These horses formed a sister clade to
mainland European horses spanning the Iron Age to the C7th
and a number of cultures, including in the La Tène and (Gallo-)
Roman periods. Other modern European native breeds (e.g.,
Friesian, Duelmener, Sorraia, and Connemara) were found to
belong to yet another clade, first appearing in Europe at Nustar,
Croatia in the C9th, but not present at that time in northern Eu�iai, Lithuania). This suggests the introduction of
rope (Auk�
staic
new domestic lineages to the south of mainland Europe between
the C7th–C9th, a time strikingly coincident with the peak of Arab
Witter Place (E)
WitterPlace
Friesian0296A 0
Friesian
Extinct Russian (E. lenensis)
Native Iberian (IBE)
Botai, ~5,500 years ago
Borly4, ~5,000 years ago
Przewalski
Ancient DOM2
Modern DOM2
2017). Our data also indicate that the growing influence of specific stallion lines post-Renaissance (Wallner et al., 2017) was
responsible for as much as a 3.8- to 10.0-fold drop in Y chromosome diversity.
We then calculated Y chromosome p estimates within past
cultures represented by a minimum of three males to clarify the
historical contexts that most impacted Y chromosome diversity.
This confirmed the temporal trajectory observed above as
Byzantine horses (287–861 CE) and horses from the Great Mongolian Empire (1,206–1,368 CE) showed limited yet larger-thanmodern diversity. Bronze Age Deer Stone horses from Mongolia,
�iai horses from Lithuania (C9th–C10th [ninth
medieval Auk�staic
through the tenth centuries of the Common Era]), and Iron
Age Pazyryk Scythian horses showed similar diversity levels
1424 Cell 177, 1419–1435, May 30, 2019
(0.000256–0.000267) (Figure 2A). However, diversity was larger in La Tène,
Roman, and Gallo-Roman horses, where
Y-to-autosomal p ratios were close to
0.25. This contrasts to modern horses,
where marked selection of specific patrilines drives Y-to-autosomal p ratios substantially below 0.25 (0.0193–0.0396)
(Figure 2A). The close-to-0.25 Y-toautosomal p ratios found in La Tène, Roman, and Gallo-Roman horses suggest
breeding strategies involving an even
reproductive success among stallions or
equally biased reproductive success in
both sexes (Wilson Sayres et al., 2014).
�Figure 4. Selection Targets through Time
(A) Population branch statistics (PBS) along the genome of 17 Byzantine horses, compared to 11 Gallo-Roman and 11 Deer Stone horses. The underlying tree
topology consists of three groups with sufficient data and representing pre-C7th–C9th horses in Asia and Europe and post-C7th–C9th horses descending from
Sassanid Persians. We used non-overlapping 50 kb genomic bins, and genes underlying enrichment for functional categories related to vertebral changes are
indicated. These include Sf3b1 and seven HOXB/C genes. Hoxc11, Hoxb7, Hoxb13, and Hoxc12 are not annotated as related to vertebral modifications, but
embedded within the two independent clusters of HOXB/C genes. The MSTN speed gene, one selection candidate in Byzantine horses, is also highlighted. See
also Figure S4 and Tables S6 and S7 for further information.
(legend continued on next page)
Cell 177, 1419–1435, May 30, 2019 1425
�raids on the Mediterranean coasts, including Croatia (Skylitzes
and Wortley, 2010). This, and the earliest identification of this
clade within two Sassanid Persian horses from Shahr-I-Qumis,
Iran (C4th–C5th), supports the growing influence of oriental
bloodlines in mainland Europe following at least the C9th.
Moving focus to Asia, steppe Iron Age Pazyryk Scythian and
Xiongnu horses appear related to Karasuk horses, locally present in the Minusinsk Basin of South Siberia during the late
Bronze Age (Mallory and Adams, 1997). This lineage of horses
survived at least until the C8th in Central Asia at Boz Adyr,
Kyrgyzstan. However, Mongolian horses from the Uyghur
(C7th–C9th, Khotont_UCIE2012x85_1291) and the Great Mongolian Empire (C13th) clustered together with C9th horses from
Kazakhstan (Gregorevka4_PAVH2_1192 and Zhanaturmus_
Issyk1_1143) within the group descending from the two ShahrI-Qumis Sassanid Persian horses. Therefore, the population shift
observed in Europe during the C7th–C9th was also mirrored in
Central Asia and Mongolia.
Gait, Speed, and Selection
We next aimed to identify possible differences in the traits
selected prior to and after the C7th–C9th transition. Only one subset of horses provided sufficient data for calculating the Population Branch Statistics (PBS) (Yi et al., 2010) considering at least
10 individuals above 1-fold depth-of-coverage per archaeological site (Tables S6 and S7; STAR Methods). It consisted of 11
Bronze Age Deer Stone horses (representing the pre-C7th–C9th
Asian group), 11 Gallo-Roman horses (pre-C7th–C9th European
horses), and 17 Byzantine horses (post-C7th–C9th). Enrichment
analyses of the genes overlapping the top 1,000 50 kb windows
revealed that functional categories related to cervical and
thoracic vertebrae were over-represented in Byzantine horses
(adjusted p values %0.05) (Figure 4A; STAR Methods; Figure S4).
Eleven genes within the HOXB/C clusters, instrumental for the
development of the main body plan and the skeletal system
(Pearson et al., 2005), featured among the windows showing
the strongest PBS values (Figure 4A). These findings were robust
to the number of outlier windows considered and the significance threshold retained was conservative relative to neutral
expectations (STAR Methods). Therefore, our results provide
evidence for selection toward changes in the skeletal morphoanatomy of the post-C7th–C9th horses related to Sassanid
Persians.
We further explored temporal shifts in the traits that are
commonly selected by modern breeders. We retraced allelic trajectories at key genomic locations associated with or causal for
locomotion, body size, and coat-coloration phenotypes. We also
tracked known variants underlying genetic disorders through
time (Figure S5; STAR Methods). Allele frequencies were calculated every 1,000 years (step size = 250 years) and restricted to
the lineage leading to modern domesticates (DOM2) (Figures 4B
and 4C). Mutations causing genetic disorders were extremely
rare, including the GYS1 H allele responsible for a severe myop-
athy in Quarter horses and other heavy and saddle horse breeds.
This allele was almost absent across all archaeological sites and,
thus, not particularly advantageous for past breeders despite
the increased glycogen storage muscular capacity conferred in
starch-poor diets (McCue et al., 2008). Spotted and dilution
alleles also remained at low frequencies, in contrast to the
MC1R chestnut coat-coloration allele, which was relatively common, except at the end of the Middle Ages (Figures 4B and S6).
The DMRT3 allele that causes ambling and improves speed
capacity in Icelandic horses (Kristjansson et al., 2014) was first
seen in a Great Mongolian Empire horse (TavanTolgoi_
GEP14_730) and slowly gained in frequency thereafter (Figure S5). Interestingly, the MSTN ‘‘speed’’ gene was among the
PBS selection candidates in the post-C7th–C9th branch (Figure 4A). We found that a number of alleles involved in racing performance, including at MSTN and PDK4 and ACN9 (Hill et al.,
2010), rose in frequency in the last 600–1,100 years (100–1,100
and 600–1,600 years ago) (Figure 4B). Allele frequencies at these
three loci also varied significantly more through time than other
mutations genome-wide (Figure 4C). Altogether, this supports
that speed capacity was increasingly selected in the last
millennium.
Discovering Two Divergent and Extinct Lineages of
Horses
Domestic and Przewalski’s horses are the only two extant horse
lineages (Der Sarkissian et al., 2015). Another lineage was genetically identified from three bones dated to �43,000–5,000 years
ago (Librado et al., 2015; Schubert et al., 2014a). It showed
morphological affinities to an extinct horse species described
as Equus lenensis (Boeskorov et al., 2018). We now find that
this extinct lineage also extended to Southern Siberia, following
the principal component analysis (PCA), phylogenetic, and f3outgroup clustering of an �24,000-year-old specimen from the
Tuva Republic within this group (Figures 3, 5A and S7A). This
new specimen (MerzlyYar_Rus45_23789) carries an extremely
divergent mtDNA only found in the New Siberian Islands some
�33,200 years ago (Orlando et al., 2013) (Figure 6A; STAR
Methods) and absent from the three bones previously
sequenced. This suggests that a divergent ghost lineage of
horses contributed to the genetic ancestry of MerzlyYar_
Rus45_23789. However, both the timing and location of the genetic contact between E. lenensis and this ghost lineage remain
unknown.
PCA revealed that native Iberian horses (IBE) from the 3rd and
early 2nd mill. BCE cluster separately from E. lenensis, Przewalski’s horses (and their Botai-Borly4 ancestors) and the lineage
leading to modern domesticates (DOM2) (Figure 5A; STAR
Methods). This indicates that a fourth lineage of horses existed
during the early phase of domestication (Gaunitz et al., 2018;
Outram et al., 2009). Members of this lineage possess their
own distinctive mtDNA haplogroup (Figure 6A; STAR Methods)
and are represented by two Spanish pre-Bell Beaker Chalcolithic
(B) Temporal allele trajectories for six SNPs associated with racing performance and locomotion patterns.
(C) Variance in allele frequency over time for the 57 SNPs investigated, categorized according to their impact on racing performance, body conformation,
diseases and coat-color variations. The red dashed line delimits the 95th percentile of the variance distribution obtained from all SNP positions segregating
genome-wide. See also Figures S5 and S6 for the full list of the SNPs investigated.
1426 Cell 177, 1419–1435, May 30, 2019
�(legend on next page)
Cell 177, 1419–1435, May 30, 2019 1427
�settlements (Cantorella and Camino de Las Yeseras) and a
Bronze Age village (El Acequión), with archaeological contexts
compatible with both wild and domestic status.
Modeling Demography and Admixture of Extinct and
Extant Horse Lineages
Phylogenetic reconstructions without gene flow indicated that
IBE differentiated prior to the divergence between DOM2 and
Przewalski’s horses (Figure 3; STAR Methods). However, allowing for one migration edge in TreeMix suggested closer affinities
with one single Hungarian DOM2 specimen from the 3rd mill.
BCE (Dunaujvaros_Duk2_4077), with extensive genetic contribution (38.6%) from the branch ancestral to all horses (Figure S7B). This, and the extremely divergent IBE Y chromosome
(Figure 6B), suggest that a divergent but yet unidentified ghost
population could have contributed to the IBE genetic makeup.
To test this and further assess the underlying population history, we explicitly modeled demography and admixture by fitting
the multi-dimensional Site Frequency Spectrum in momi2
(Kamm et al., 2018) (STAR Methods). The two best-supported
scenarios (Figure 5C) provided divergence time estimates on
par with previous work, first �113–119 kya for the E. lenensis
split (Librado et al., 2015; Schubert et al., 2014a), then �34–44
kya for that of Przewalski’s horse and DOM2 lineages (Der Sarkissian et al., 2015). In both models, IBE and E. lenensis show
strong genetic affinities, with no less than 93.2%–98.8% genetic
input from the former into the branch ancestral to E. lenensis,
some �285–333 kya. The magnitude of this pulse could suggest
that the two lineages in fact split at that time, but that a more
divergent ghost population contributed �1.2%–6.8% ancestry
into IBE, pushing the momi2 estimate for the IBE divergence to
deeper times (�539–1,246 kya). The strong genetic affinity between IBE and E. lenensis is consistent with the results of
Struct-f4, a new method developed here leveraging all possible
combinations of f4-statistics to provide a 3D representation of
ancestral population relationships that is robust to lineage-specific genetic drift (Figure 5B; STAR Methods), as opposed to
PCA projections.
Rejecting Iberian Contribution to Modern Domesticates
The genome sequences of four �4,800- to 3,900-year-old IBE
specimens characterized here allowed us to clarify ongoing
debates about the possible contribution of Iberia to horse
domestication (Benecke, 2006; Uerpmann, 1990; Warmuth
et al., 2011). Calculating the so-called fG ratio (Martin et al.,
2015) provided a minimal boundary for the IBE contribution to
DOM2 members (Cahill et al., 2013) (Figure 7A). The maximum
of such estimate was found in the Hungarian Dunaujvaros_
Duk2_4077 specimen (�11.7%–12.2%), consistent with its
TreeMix clustering with IBE when allowing for one migration
edge (Figure S7B). This specimen was previously suggested to
share ancestry with a yet-unidentified population (Gaunitz
et al., 2018). Calculation of f4-statistics indicates that this population is not related to E. lenensis but to IBE (Figure 7B; STAR
Methods). Therefore, IBE or horses closely related to IBE,
contributed ancestry to animals found at an Early Bronze Age
trade center in Hungary from the late 3rd mill. BCE. This could
indicate that there was long-distance exchange of horses during
the Bell Beaker phenomenon (Olalde et al., 2018). The fG minimal
boundary for the IBE contribution into an Iron Age Spanish horse
(ElsVilars_UE4618_2672) was still important (�9.6%–10.1%),
suggesting that an IBE genetic influence persisted in Iberia until
at least the 7th century BCE in a domestic context. However, fG
estimates were more limited for almost all ancient and modern
horses investigated (median = �4.9%–5.4%; Figure 7A). Analytical predictions and population modeling with momi2 further
confirmed that IBE contributed only minimal ancestry (�1.4%–
3.8%) to modern DOM2 horses and well prior to their domestication (�34–44 kya).
DISCUSSION
Recent advances in ancient DNA research have opened access
to the complete genome sequence of past individuals. These
have so far mostly improved our understanding of the evolutionary history of our own lineage, based on hundreds of individual whole genomes and genome-scale data from thousands of
individuals (Marciniak and Perry, 2017). Our study represents
the first effort to apply the available technology at similar scales
to a non-human organism. With 129 ancient genomes and
genome-scale data from 149 additional ancient animals, our
dataset unveils the past complexity of horse evolution, including
the recent impact of humans by means of diversity management,
selection and hybridization.
We genetically identified two mules within the La Tène Iron
Age site of Saint-Just (France). Mules represented invaluable animals to past societies, being more sure-footed, more resistant
to diseases, and harder working than horses. They are, however,
difficult to identify morphologically from fragmentary material.
Our work gives definitive proof that mules have been bred since
Figure 5. Genetic Affinities
(A) Principal Component Analysis (PCA) of 159 ancient and modern horse genomes showing at least 1-fold average depth-of-coverage. The overall genetic
structure is shown for the first three principal components, which summarize 11.6%, 10.4% and 8.2% of the total genetic variation, respectively. The two
specimens MerzlyYar_Rus45_23789 and Dunaujvaros_Duk2_4077 discussed in the main text are highlighted. See also Figure S7 and Table S5 for further
information.
(B) Visualization of the genetic affinities among individuals, as revealed by the struct-f4 algorithm and 878,475 f4 permutations. The f4 calculation was conditioned
on nucleotide transversions present in all groups, with samples were grouped as in TreeMix analyses (Figure 3). In contrast to PCA, f4 permutations measure
genetic drift along internal branches. They are thus more likely to reveal ancient population substructure.
(C) Population modeling of the demographic changes and admixture events in extant and extinct horse lineages. The two models presented show best fitting to
the observed multi-dimensional SFS in momi2. The width of each branch scales with effective size variation, while colored dashed lines indicate admixture
proportions and their directionality. The robustness of each model was inferred from 100 bootstrap pseudo-replicates. Time is shown in a linear scale up to
120,000 years ago and in a logarithmic scale above.
1428 Cell 177, 1419–1435, May 30, 2019
�A
B
MerzlyYar Rus45 23789
NewSiberianIslands JW28MS298 KT757749 33173
Botai G 5500
Botai D5 5500
Botai K 5500
Botai 8 5500
Yenikapi Tur171 1689
Botai D6 5500
Botai 3 5500
Borly4 PAVH11 5015
Borly4 PAVH8 4978
Borly4 PAVH4 4974
Botai Petrous 5500
UralMountains 151 KT757757 39088
Goyet Vert311 35870
ElAcequion Spain39 3993
CaminoDeLasYeseras CdY2 4678
Merzly Yar Rus45 23789
Batagai 5155
Oktvabrsky Rus37 830
Botai 3 5500
Botai D5 5500
Botai 4 5500
Botai 1 5500
Przewalski
Yenikapi Tur141 1430
TepeHasanlu 3394 2808
Uppsala Upps02 1317
Yenikapi Tur169 1443
Yenikapi Tur191 1443
Botai R 5500
Fengtai Fen4 2820
Botai L 5500
Botai N 5500
Berel BER02 B 2300
WhitehallRomanVilla UK08 1667
Quoygrew VHR017 1117
WitterPlace UK18 267
Taymyr CGG10023 16056
Botai 2 5500
Dunaujvaros Duk2 4077
ArzhanI I−K3 Arz2 2727
Botai 6 5500
Botai F 5500
Bo tai K 5500
Borly4 PAVH8 4978
Borly4 PAVH9 4977
Botai D1 5500
Botai C 5500
Ridala Rid2 2717
Chartres GVA56 1917
Botai 5 5500
Botai P 5500
Botai G 5500
UushgiinUvur Mon41 3085
Botai I 5500
Botai A 5500
Yenikapi Tur175 1443
Botai T 5500
Botai D4 5500
Chartres GVA111 1917
Botai E 5500
Botai NB18 4692
Yenikapi Tur145 1156
Botai O 5500
Taymyr CGG10026 KT757742 27298
NewSiberianIslands 154 KT757746 2301
Przewalski Holotype 139
Przewalski Paratype 118
Botai 1 5500
Botai 4 5500
Yenikapi Tur244 1443
TavanTolgoi GEP14 730
Borly4 PAVH6 5012
Belkaragay NB13 CopperAge
Borly4 PAVH9 4977
ArzhanII Arz17 2642
Garbovat Gar3 3574
Yenikapi Tur139 1443
Actiparc GVA124 2143
UralMountains 160 KT757755 28308
Taymyr CGG10032 KT757744 28264
NewSiberianIslands 156 KT757748 24220
Taymyr CGG10023 16056
Batagai 5155
Yukagir KT368723 5451
NewSiberianIslands 152 KT757750 39377
Belkaragay NB15 CopperAge
BroughOfDeerness VHR010 1417
Oktyabrsky Rus37 830
Chartres GVA9 1917
Beauvais GVA375 467
Evreux GVA135 1817
Vermand GVA199 1742
Yenikapi Tur144 1443
SaintJust GVA242 2250
SaintJust GVA212 2162
FrankfurtHeddernheim Fr1 1863
Chartres GVA56 1917
Berel BER12 M 2300
LebyazhinkaIV NB35 Neolithic
Botai I 5500
Chartres GVA36 1917
GolModII Mon24 1993
UushgiinUvur Mon39 3085
Miciurin Mic2 3267
Yenikapi Tur147 1443
SolothurnVigier NB175 1817
TachtiPerda TP4 3604
Gregorevka4 PAVH2 1192
Dunaujvaros Duk2 4077
Botai 2 5500
Botai P 5500
Botai C 5500
ElAcequion Spain39 3993
CaminoDeLasYeseras CdY2 4678
ElAcequion Spain38 4058
Cantorella UE2275x2 4791
Actiparc GVA308 2312
WitterPlace UK17 267
Berufjordur VHR102 1067
Derkul NB4 Neolithic
GolModII Mon26 1999
Botai B 5500
Botai 5 5500
UralMountains 159 KT757756 32734
NewSiberianIslands 155 KT757747 20340
Taymyr CGG10022 42758
DOM2a
Mongolian_0153A_0
Yakutian_0171A_0
Yakutian_0163A_0
Thoroughbred_0290A_0
Arabian_0237A_0
Marwari_0239A_0
Jeju_0275A_0
Sorraia_0236A_0
Connemara_0004A_0
Friesian_0296A_0
Icelandic_0144A_0
Quarter_0073A_0
FMontagnes_0065A_0
HeavyWarmblood_0269A_0
Hanoverian_0235A_0
UralMountains 148 KT757754 31984
UralMountains 158 KT757759 16946
Capote Cap102 2464
Taymyr CGG10027 KT757743 28403
0.005
Bootstrap support:
>0.99
0.9−0.99
0.7−0.9
Goyet Vert293 UpperPalaeolithic
UralMountains 149 KT757758 18538
Przewalski Bijsk1 KT368753 109
Przewalski Bijsk2 KT368754 116
UushgiinUvur Mon45 3080
Botai 6 5500, Botai F 5500
Chartres GVA4 1917
Halvai KSH4 4017
Syrgal Syr1t1c3 2317
Beauvais GVA122 417
Krasnokamenka NB9 4500
BozAdyr KYRH8 1267
Khatuu Kha2 t1 2312
Yenikapi Tur246 1443
Sintashta NB44 3577
SolothurnVigier NB63 1867
Noyon GVA123 717
TepeHasanlu 1140 2682
Botai D1 5500
UushgiinUvur Mon44 3085
UushgiinUvur Mon41 3085
Schlovippach Svi6 3917
Przewalski Theodore KT368758 90
Mongolian Emgl1 KT368739 104
TavanTolgoi GEP13 730
Yerqorqan YER28 2853
DOM2b
Mongolian_0215A_0
Yakutian_0170A_0
Extinct Russian (E. lenensis)
Native Iberian (IBE)
Botai, ~5,500 years ago
0.1
Borly4, ~5,000 years ago
Przewalski
Ancient DOM2
Bootstrap support:
>0.99
Modern DOM2
(legend on next page)
Cell 177, 1419–1435, May 30, 2019 1429
�at least �2,200 years ago, despite considerable cost implications of producing sterile stock (Laurence, 1999).
We found that Y chromosome diversity in horses declined
steadily within the last �2,000 years, with male reproductive success becoming skewed following the (Gallo-) Roman period. This
indicates that breeders increasingly chose specific stallions for
breeding from the Middle Ages onward, consistent with the
dominance of an �700 to 1,000-year-old Arabian haplogroup
in most modern studs (Felkel et al., 2018; Wallner et al., 2017).
Together with the increasing affinity to Sassanid Persian horses
detected in the genomes of European and Asian horses after the
C7th–C9th, this suggests that the Byzantine-Sassanid wars and
the early Islamic conquests significantly impacted breeding
and exchange. The legacy of these historical events has persisted until now as the majority of the modern breeds investigated here clustered within a phylogenetic group related to
Sassanid Persian horses. During the same time period, the horse
phenotype was also significantly reshaped, especially for locomotion, speed capacity, and morpho-anatomy. Whether this
partly or fully reflects the direct influence of Arabian lines requires
further tests.
Most strikingly, we found that while past horse breeders maintained diverse genetic resources for millennia after they first
domesticated the horse, this diversity dropped by �16% within
the last 200 years. This illustrates the massive impact of modern
breeding and demonstrates that the history of domestic animals
cannot be fully understood without harnessing ancient DNA
data. Importantly, recent breeding strategies have also limited
the efficacy of negative selection and led to the accumulation
of deleterious variants within the genome of horses. This illustrates the genomic cost of modern breeding. Future work should
focus on testing how much recent progress in veterinary medicine and the improving animal welfare have contributed to limit
the fitness impact of deleterious variants.
In addition to the two extant lineages of horses, we report two
other lineages at the far eastern and western range of Eurasia, in
Iberia (IBE) and Siberia (E. lenensis). Their genomes suggest the
presence of other yet unidentified ghost populations. The IBE
and E. lenensis lineages are now extinct but lived at the time
horses were first domesticated. None of them, however, contributed significant ancestry to modern domesticates. Interestingly,
Upper Paleolithic cave paintings in Europe have often been
proposed to depict Przewalski’s horses due to striking morphological resemblance (Leroi-Gourhan, 1958). Our sample set
included one horse from the Goyet cave, Belgium dated to
�35,870 years ago. Although characterized at limited coverage
(0.49-fold), D-statistics revealed closer genetic affinity to IBE
and DOM2 than to the ancestors of Przewalski’s horses
( 15.5 < Z scores < 2.4). European cave painting is, therefore,
unlikely to depict Przewalski’s horses. It may instead represent
the ancestors of the Tarpan, assuming that this taxonomically
contentious lineage neither represents domestic horses turned
feral nor domestic-wild hybrids but truly wild horses that went
extinct in the late C19th (Groves, 1994).
Iberia was suggested as a possible domestication center for
horses on the basis of both archaeological arguments (Benecke,
2006) and geographic patterns of genetic variation in modern
breeds (Uerpmann, 1990; Warmuth et al., 2011). Previous
ancient DNA data were limited to short mtDNA sequences of
pre-Bronze Age to medieval specimens (Lira et al., 2010), and remained indecisive regarding the contribution of Iberia to horse
domestication. Our work shows that IBE horses have not genetically contributed to the vast majority of DOM2 domesticates
investigated here, ancient or modern alike, excepting one horse
in Bronze Age Hungary, possibly following the Bell-Beaker phenomenon, and an additional one in Iron Age Iberia. Population
modeling also confirmed limited contribution within modern domesticates, largely pre-dating domestication. Therefore, IBE
cannot represent a main domestication source. Given that other
candidates in the Eneolithic Botai culture from Central Asia do
not represent DOM2 ancestors (Gaunitz et al., 2018), the origins
of the modern domestic horse remain open.
Future work must focus on mapping genomic affinities in
the 3rd and 4th mill. BCE, especially at other candidate regions
for early domestication in the Pontic-Caspian (Anthony, 2007)
and Anatolia (Arbuckle, 2012; Benecke, 2006). Finer mapping
of the Persian-related influence at around the time of the
Islamic conquest and the diversity hotspots in place prior to
modern stud breeding will also improve our understanding
of the source(s) and dynamics underlying the makeup of modern diversity.
STAR+METHODS
Detailed methods are provided in the online version of this paper
and include the following:
d
d
d
KEY RESOURCES TABLE
CONTACT FOR REAGENT AND RESOURCE SHARING
EXPERIMENTAL MODEL AND SUBJECT DETAILS
B Belgium (Goyet A1)
B China
B Croatia (Bapska, Nu�
star, Otok)
B Estonia (Otepää hill-fort, Ridala, Saadjärve)
B France (Beauvais: Maladrerie Saint-Lazare and rue de
L’Isle-Adam, Boinville-en-Woëvre, Boves ‘‘Chemin de
Figure 6. Phylogenetic Reconstructions Based on Uniparental Markers
Tip labels are respectively composed of individual sample names, their reference number as well as their age (years ago, from 2017). Red, orange, light green,
green, dark green and blue refer to modern horses, ancient DOM2, Botai horses, Borly4 horses, Przewalski’s horses and E. lenensis, respectively. Black refers to
wild horses not yet identified to belong to any particular cluster in absence of sufficient genome-scale data. Clades composed of only Przewalski’s horses or
ancient DOM2 horses were collapsed to increase readability.
(A) Best maximum likelihood tree retracing the phylogenetic relationships between 270 mitochondrial genomes.
(B) Best Y chromosome maximum likelihood tree (GTRGAMMA substitution model) excluding outgroup. Node supports are indicated as fractions of 100
bootstrap pseudoreplicates. Bootstrap supports inferior to 90% are not shown. The root was placed on the tree midpoint. See also Table S5 for dataset
information.
1430 Cell 177, 1419–1435, May 30, 2019
�A
B
d
d
Figure 7. Influence of Native Iberian Horses within DOM2
Domesticates
(A) Estimates of native IBE ancestry in DOM2 horses, based on the fraction of
polymorphisms shared between IBE and DOM2 horses relative to Botai and
Borly4 horses, and the level of polymorphisms shared between two IBE horses
relative to Botai and Borly4 horses. The ratio of these values approximates a
minimal boundary for the fraction of genomic ancestry present in DOM2
genomes pertaining to IBE or a closely related lineage. Consistent estimates
are retrieved when replacing Botai with Borly4 horses, an �5,000 years-old
group directly descending from Botai.
(B) Admixture tests. The f4-statistics in the form of (outgroup,
[IBE,(DOM2,Botai-Borly4)]) and (outgroup,[E. lensensis,(DOM2,Botai-Borly4)])
are provided. Negative values indicate excess of shared derived polymorphisms between IBE (or E. lenensis) and DOM2. More negative values
indicate a more likely contribution of IBE (than E. lenensis) into DOM2. Testing
all DOM2 individual genomes provided negative values, except two samples
(Saadjave_Saa1_1117 and Friesian_0296A_0), which are not represented and
for which other unidentified ancestry components could be present.
d
Glisy,’’ Capesterre, Chartres ‘‘Boulevard de la Courtille,’’ Evreux ‘‘Clos-au-Duc 3 rue de la Libération –
2007,’’ Longueil-Annel, Mâcon ‘‘Rue Rambuteau,’’
Metz ‘‘Place de la République,’’ Saint-Claude, SaintLaurent Blangy ‘‘Actiparc 2002,’’ Vermand 2005 and
Saint-Just-en-Chaussée)
B Georgia (Dariali)
B Germany (private collections, Schloßvippach)
B Iceland (Berufjörður and Granastaðir)
B Iran (Belgheis, Kulian Cave, Sagzabad, Shahr-i-Qumis,
Tepe Hasanlu, Tepe Mehr Ali)
B Kazakhstan (Belkaragay, Halvai)
B Kyrgyzstan (Boz-Adyr)
B Lithuania (Marvele_ cemetery)
B Moldova (Miciurin)
B Mongolia (Gol Mod II, Khatuu 2, Olon-Kurin-Gol (Olon
Guuriin Gol), Uushgiin Uvur, Talvan Tolgoi, Khotont)
B Poland (Bruszcewo)
B Portugal (Santarém)
B Russia (Altata, Arzhan II, Balagansk, Bateni – Karasuk,
Derkul, Kokorevo, Krasnaya Gorka, Lebyanzhinka IV,
Merzly Yar, Oktyabrsky, Potapovka I, Sayangorsk,
Sintashta)
B Slovakia (Sebastovce)
B Spain (Camino de las Yeseras, Cantorella, Capote, El
Acequión, Els Vilars)
B Sweden (Uppsala)
B Switzerland (Augusta Raurica, Stein am Charregass,
Solothurn Vigier)
B Turkey (Yenikapi)
B United Kingdom (Brough of Deerness, Quoygrew,
Whitehall Roman Villa and Witter Place)
B Uzbekistan (Yerqorqan/Erkurgan)
B Museum
B Comparative dataset
METHOD DETAILS
B DNA extraction and genome sequencing
B Radiocarbon dating
QUANTIFICATION AND STATISTICAL ANALYSIS
B Read alignment, rescaling and trimming
B Uniparental markers
B Autosomal and sex chromosomes
B Selection targets
B TreeMix population tree
B Struct-f4
B Modeling IBE contribution to DOM2
B Species and sex identification
DATA AVAILABILITY
SUPPLEMENTAL INFORMATION
Supplemental Information can be found online at https://doi.org/10.1016/j.
cell.2019.03.049.
ACKNOWLEDGMENTS
We thank the reviewers for insightful comments and suggestions that helped
improve the manuscript. We thank the staff of the Danish National HighThroughput DNA Sequencing Center for technical support; Rachel Ballantyne,
Cell 177, 1419–1435, May 30, 2019 1431
�Maude Barme, Lucie Cottier, Jean-Marc Fémolant, Stéphane Frère, Gaëtan
Jouanin, Patrice Meniel, Nicolas Morand, Anaı̈s Ortiz, Ollivier Putelat, Vida Rajkovaca, Julie Rivière, Opale Robin, Noémie Tomadini, Jean-Hervé Yvinec, and
the National Museum of Iceland for providing access to osteological material;
Bazartseren Boldbat for his help and guidance; Laurent Frantz, Dan Bradley,
and Greger Larson for critical reading of the manuscript; and Clio Der Sarkissian and Luca Ermini for preliminary analyses, technical support, and insightful
discussion. B.B. was supported by the Taylor Family-Asia Foundation Endowed Chair in Ecology and Conservation Biology. M.L. was supported by a
Marie-Curie Individual Fellowship (MSCA-IF-67852). L.L. was supported by
the Estonian Research Council (PRG29). C.L. was supported by FCT (SFRH/
BPD/100511/2014). P.K., N.R., and O.M. were supported by the Ministry of
Educations and Science of Russian Federation (33.1907, 2017/P4) and the
Russian Scientific Foundation (18-18-00137). T.M.-B. was supported by the
BFU2017-86471-P (MINECO/FEDER, UE), the U01 MH106874 grant, Howard
Hughes International Early Career, Obra Social ‘‘La Caixa,’’ and Secretaria
d’Universitats i Recerca del Departament d’Economia i Coneixement de la
Generalitat de Catalunya. V.P. was supported by Russian Science Foundation
(16-18-10265). This research received support from the SYNTHESYS Project
(http://www.synthesys.info/), which is financed by European Community
Research Infrastructure Action under the Seventh Framework ‘‘Capacities’’
Programme. This work was supported by the Danish National Research Foundation (DNRF94), the Initiative d’Excellence Chaires d’attractivité, Université
de Toulouse (OURASI), the International Highly Cited Research Group Program (HCRC#15-101), Deanship of Scientific Research, King Saud University,
the Villum Fonden miGENEPI research project, the Swiss National Science
Foundation (CR13I1_140638), the Research Council of Norway (project
230821/F20); the investigation grant HAR2016-77600-P, Ministerio de Economı́a y Competitividad, Spain, and the National Science Foundation (ANS1417036). This project has received funding from the European Research
Council (ERC) under the European Union’s Horizon 2020 research and innovation programme (grant agreement 681605).
AUTHOR CONTRIBUTIONS
L.O. conceived the project and designed research. A.F., C. Gaunitz, and N.K.
performed ancient DNA laboratory work, with input from C. Gamba, M.L.,
C.M.C., and L.O. A.S.-O. performed DNA sequencing. K.H., P.L., and L.O. designed, coordinated, and performed computational analyses, with input from
A.F. for hybrid detection and mitochondrial analyses and from S.F., B.W.,
and G.B. for Y chromosome analyses. S. Albizuri, M.A., D.A., N. Baimukhanov,
J. Barrett, J. Bayarsaikhan, N. Benecke, E.B.-S., L.B.-R., F.B., S.B., B.B., D.B.,
J. Burger, L.D., H.D., P.d.B.D., M.d.l.A.d.C.y.d.V.-C., S.D.-E., C.D., N.D.,
M.d.M.O., S.E., D.E., H.F., C.F.-R., M.G., J.H.H., R.K., M.K., P. Kosintsev,
T.K., P. Kuznetsov, H.L., J.A.L., J.L., C.L.v.L.-V., A. Logvin, L.L., A. Ludwig,
C.L., A.M.A., R.M.S., V.M., E.M., B.K.M., O.M., F.A.M., A.M., A.N.-E., H.N.,
A.H.P., V.P., K.P., M.P., P.R.S., A.R.P., N.R., E.S., R.S., A. Sardari, J.S., A.
Schlumbaum, N. Serrand, A.S.-A., S.S.S., I.S., S.S., B. Star, J.S., N. Sykes,
K.T., W.T., W.-R.T., T.T.V., S.T., D.T., S.U., E.U., A.V., S.V.-L., V.O., CV,
J.W., V.Z., B.C., S.L., M.M., and A.K.O. provided samples and/or information
about archaeological/historical contexts. S. Alquraishi, A.H.A., K.A.S.A.-R., B.
Shapiro, J.S., E.W., and L.O. provided reagents and material. A.F., K.H., P.L.,
and L.O. prepared figures and tables. A.F., C. Gaunitz, K.H., P.L., and L.O.
wrote the supplementary information, with input from J. Barrett, F.B., B.B.,
M.G., C.L., H.D., J.L., L.L., M.K., P.R.S., A.R.P., A. Schlumbaum, B.C., S.L.,
and M.M. L.O. wrote the paper, with input from A.K.O., P.L., and all other
co-authors.
DECLARATION OF INTERESTS
The authors declare no competing interests.
Received: October 19, 2018
Revised: February 14, 2019
Accepted: March 27, 2019
Published: May 2, 2019
1432 Cell 177, 1419–1435, May 30, 2019
REFERENCES
Abad, Ò.E., i Garra, A.M., and Bieto, E.T. (2011). Cantorella (Maldà, Urgell), un
nou assentament a l’aire lliure del neolı́tic final-calcolı́tic i del bronze ple a la vall
del Corb. Tribuna d’Arqueologia, 2011–2012.
Allentoft, M.E., Sikora, M., Sjögren, K.-G., Rasmussen, S., Rasmussen, M.,
Stenderup, J., Damgaard, P.B., Schroeder, H., Ahlström, T., Vinner, L., et al.
(2015). Population genomics of Bronze Age Eurasia. Nature 522, 167–172.
Anthony, D. (2007). The Horse, the Wheel, and Language: How Bronze-Age
Riders from the Eurasian Steppes Shaped the Modern World (Princeton University Press).
Arbuckle, B.S. (2012). Pastoralism, Provisioning, and Power at Bronze Age
Acemhöyük, Turkey. Am. Anthropol. 114, 462–476.
Barlow, A., Hartmann, S., Gonzalez, J., Hofreiter, M., and Paijmans, J.L.A.
(2018). Consensify: a method for generating pseudohaploid genome sequences from palaeogenomic datasets with reduced error rates. bioRxiv.
https://doi.org/10.1101/498915.
Barrett, J.H.B. (2012). Being an islander: production and identity at Quoygrew,
Orkney, AD 900-1600 (McDonald Institute for Archaeological Research).
Barrett, J.H., and Slater, A. (2009). New Excavations at the Brough of Deerness: Power and Religion in Viking Age Scotland. J. North Atlantic, 81–94.
Benecke, N. (2006). On the beginning of horse husbandry in the southern Balkan Peninsula-the horse bones from Kirklareli-Kanhgecit (Turkish Thrace). In
Equids in Time and Space: Papers in Honour of Véra Eisenmann, M. Mashkour, ed. (Oxford).
Benjamini, Y., and Hochberg, Y. (1995). Controlling the False Discovery Rate:
A Practical and Powerful Approach to Multiple Testing. J. R. Stat. Soc. Series B
Stat. Methodol. 57, 289–300.
Berta�sius, M., and Daugnora, L. (2001). Viking age horse graves from Kaunas
region (Middle Lithuania). Int. J. Osteoarchaeol. 11, 387–399.
Biglari, F., and Taheri, K. (2000). The discovery of Upper Paleolithic remains at
Mar Kuliyan and Mar Dalan Cave, Rawansar. Essays on the Archaeology, Geology, Geography and Culture of Rawansar Area (Taq-E Bostan Publications), pp. 7–27.
Blasco, C., Rios, P., and Liesau, C. (2011). Yacimientos calcolı́ticos con campaniforme de la región de Madrid: nuevos estudios (Universidad Autónoma de
Madrid Madrid).
Boeskorov, G.G., Potapova, O.R., Protopopov, A.V., Plotnikov, V.V., Maschenko, E.N., Shchelchkova, M.V., Petrova, E.A., Kowalczyk, R., van der
Plicht, J., and Tikhonov, A.N. (2018). A study of a frozen mummy of a wild horse
from the Holocene of Yakutia, East Siberia, Russia. Mammal Res. 63, 1–8.
Briggs, A.W., Stenzel, U., Johnson, P.L.F., Green, R.E., Kelso, J., Prüfer, K.,
Meyer, M., Krause, J., Ronan, M.T., Lachmann, M., and Pääbo, S. (2007). Patterns of damage in genomic DNA sequences from a Neandertal. Proc. Natl.
Acad. Sci. USA 104, 14616–14621.
Briggs, A.W., Stenzel, U., Meyer, M., Krause, J., Kircher, M., and Pääbo, S.
(2010). Removal of deaminated cytosines and detection of in vivo methylation
in ancient DNA. Nucleic Acids Res. 38, e87.
Brink, S., and Price, N. (2008). The Viking World (Routledge).
Cahill, J.A., Green, R.E., Fulton, T.L., Stiller, M., Jay, F., Ovsyanikov, N., Salamzade, R., St John, J., Stirling, I., Slatkin, M., and Shapiro, B. (2013). Genomic
evidence for island population conversion resolves conflicting theories of polar
bear evolution. PLoS Genet. 9, e1003345.
Charlesworth, B. (2009). Fundamental concepts in genetics: effective population size and patterns of molecular evolution and variation. Nat. Rev. Genet. 10,
195–205.
Corbin, L.J., Blott, S.C., Swinburne, J.E., Vaudin, M., Bishop, S.C., and Woolliams, J.A. (2010). Linkage disequilibrium and historical effective population
size in the Thoroughbred horse. Anim. Genet. 41 (Suppl 2 ), 8–15.
Cruz, F., Vilà, C., and Webster, M.T. (2008). The legacy of domestication: accumulation of deleterious mutations in the dog genome. Mol. Biol. Evol. 25,
2331–2336.
�Der Sarkissian, C., Ermini, L., Schubert, M., Yang, M.A., Librado, P., Fumagalli,
M., Jónsson, H., Bar-Gal, G.K., Albrechtsen, A., Vieira, F.G., et al. (2015).
Evolutionary genomics and conservation of the endangered Przewalski’s
horse. Curr. Biol. 25, 2577–2583.
Drews, R. (2004). Early Riders: The Beginnings of Mounted Warfare in Asia and
Europe (Routledge).
Jonvel, R. (2014). Démuin « Le village ». Rapport final d’opération. Autour du
château médiéval (IXe-XVIe siècle) (Amiens: UnivArchéo, UPJV).
Kamm, J.A., Terhorst, J., Durbin, R., and Song, Y.S. (2018). Efficiently inferring
the demographic history of many populations with allele count data. bioRxiv.
https://doi.org/10.1101/287268.
Durand, E.Y., Patterson, N., Reich, D., and Slatkin, M. (2011). Testing for
ancient admixture between closely related populations. Mol. Biol. Evol. 28,
2239–2252.
Keane, T.M., Creevey, C.J., Pentony, M.M., Naughton, T.J., and Mclnerney,
J.O. (2006). Assessment of methods for amino acid matrix selection and their
use on empirical data shows that ad hoc assumptions for choice of matrix are
not justified. BMC Evol. Biol. 6, 29.
Dyson, R.H. (1989). The Iron Age architecture at Hasanlu: an essay. Expedition
31, 107.
Kelekna, P. (2009). The horse in human history (Cambridge University Press
Cambridge).
Dyson, R.H. (1999). The Achaemenid painted pottery of Hasanlu IIIA. Anatolian
Studies 49, 101–110.
Korneliussen, T.S., Albrechtsen, A., and Nielsen, R. (2014). ANGSD: Analysis
of Next Generation Sequencing Data. BMC Bioinformatics 15, 356.
Einarsson, B.F. (1995). The Settlement of Iceland, A Critical Approach: Granastaðair and the Ecological Heritage. Reykjavı́k: Hið ı́slenzka bókmentafélag.
Kosintsev, P.A. (2015). Bone remains from the settlement Belkaragay I. In
Ancient Turgay and the Great Steppe: Part and Whole, A.Z. Beisenov, ed.
(Kostanay-Almaty), pp. 142–144.
Faostat, F.A.O. (2009). Statistical databases (Food and Agriculture Organization of the United Nations).
Felkel, S., Vogl, C., Rigler, D., Jagannathan, V., Leeb, T., Fries, R., Neuditschko, M., Rieder, S., Velie, B., Lindgren, G., et al. (2018). Asian horses
deepen the MSY phylogeny. Anim. Genet. 49, 90–93.
Gamba, C., Hanghøj, K., Gaunitz, C., Alfarhan, A.H., Alquraishi, S.A., Al-Rasheid, K.A.S., Bradley, D.G., and Orlando, L. (2016). Comparing the performance of three ancient DNA extraction methods for high-throughput
sequencing. Mol. Ecol. Resour. 16, 459–469.
Gaunitz, C., Fages, A., Hanghøj, K., Albrechtsen, A., Khan, N., Schubert, M.,
Seguin-Orlando, A., Owens, I.J., Felkel, S., Bignon-Lau, O., et al. (2018).
Ancient genomes revisit the ancestry of domestic and Przewalski’s horses.
Science 360, 111–114.
Germonpré, M. (2004). Influence of climate on sexual segregation and cub
mortality in Pleniglacial cave bear. The Future from the Past: Archaeozoology
in Wildlife Conservation and Heritage Management (Proceedings of the 9th
ICAZ Conference) (Oxbow Books).
Kosintsev, P., and Kuznetsov, P. (2013). Comment on ‘‘The Earliest Horse Harnessing and Milking.’’. Tyragetia 7, 405–408.
Kousathanas, A., and Keightley, P.D. (2013). A comparison of models to infer
the distribution of fitness effects of new mutations. Genetics 193, 1197–1208.
Kovalev, A.A., Erdenebaatar, D., and Rukavishnikova, I.V. (2016). A ritual complex with deer stones at Uushigiin Uvur, Mongolia: composition and construction stages. Archaeol. Ethnol. Anthropol. Eurasia 44, 82–92.
Kristjansson, T., Bjornsdottir, S., Sigurdsson, A., Andersson, L.S., Lindgren,
G., Helyar, S.J., Klonowski, A.M., and Arnason, T. (2014). The effect of the
‘Gait keeper’ mutation in the DMRT3 gene on gaiting ability in Icelandic horses.
J. Anim. Breed. Genet. 131, 415–425.
Lang, V. (2012). The Bronze and Early Iron Ages in Estonia. Settlement Sites
and Settlement in the Late Bronze and Early Iron Ages (University of Tartu
Press), pp. 63–65.
Laurence, R. (1999). The Roads of Roman Italy: Mobility and Social Change
(Routledge).
Green, R.E., Krause, J., Briggs, A.W., Maricic, T., Stenzel, U., Kircher, M., Patterson, N., Li, H., Zhai, W., Fritz, M.H.-Y., et al. (2010). A draft sequence of the
Neandertal genome. Science 328, 710–722.
Lefort, V., Desper, R., and Gascuel, O. (2015). FastME 2.0: A comprehensive,
accurate, and fast distance-based phylogeny inference program. Mol. Biol.
Evol. 32, 2798–2800.
Groves, C.P. (1994). Morphology, habitat, and taxonomy. In Przewalski’s
Horse–The History and Biology of an Endangered Species, L. Boyd and K.A.
Houpt, eds. (SUNY Press), pp. 39–60.
Leroi-Gourhan, A. (1958). L’art pariétal: langage de la préhistoire (Editions Jérôme Millon).
Haak, W., Lazaridis, I., Patterson, N., Rohland, N., Mallick, S., Llamas, B.,
Brandt, G., Nordenfelt, S., Harney, E., Stewardson, K., et al. (2015). Massive
migration from the steppe was a source for Indo-European languages in Europe. Nature 522, 207–211.
Hall, S.J.G. (2016). Effective population sizes in cattle, sheep, horses, pigs and
goats estimated from census and herdbook data. Animal 10, 1778–1785.
Haller, B.C., and Messer, P.W. (2017). SLiM 2: Flexible, Interactive Forward
Genetic Simulations. Mol. Biol. Evol. 34, 230–240.
Hansman, J., and Stronach, D. (1970). A Sasanian Repository at Shahr-I
�mis. JRAS 102, 142–155.
Qu
Hansman, J., Stronach, D., and Bailey, H. (1970). Excavations at Shahr-I
�mis. The Journal of Royal Asiatic Society of Great Britain and Ireland
Qu
1, 29–62.
Li, H., and Durbin, R. (2009). Fast and accurate short read alignment with Burrows-Wheeler transform. Bioinformatics 25, 1754–1760.
Librado, P., Der Sarkissian, C., Ermini, L., Schubert, M., Jónsson, H., Albrechtsen, A., Fumagalli, M., Yang, M.A., Gamba, C., Seguin-Orlando, A., et al.
(2015). Tracking the origins of Yakutian horses and the genetic basis for their
fast adaptation to subarctic environments. Proc. Natl. Acad. Sci. USA 112,
E6889–E6897.
Librado, P., Gamba, C., Gaunitz, C., Der Sarkissian, C., Pruvost, M., Albrechtsen, A., Fages, A., Khan, N., Schubert, M., Jagannathan, V., et al. (2017).
Ancient genomic changes associated with domestication of the horse. Science 356, 442–445.
Liesau, C. (2005). Arqueozoologı́a del caballo en la antigua Iberia. Gladius 25,
187–206.
Hill, E.W., Gu, J., McGivney, B.A., and MacHugh, D.E. (2010). Targets of selection in the Thoroughbred genome contain exercise-relevant gene SNPs associated with elite racecourse performance. Anim. Genet. 41 (Suppl 2 ), 56–63.
Liesau, C. (2017). Fauna in Living and Funerary Contexts of the 3rd Millennium
BC in Central Iberia. In Key Resources and Sociocultural Developments in the
Iberian Chalcolithic, M. Bartelheim, P. Bueno, and M. Kunst, eds. (Tübingen
Publishing), pp. 107–128.
Jónsson, H., Ginolhac, A., Schubert, M., Johnson, P.L.F., and Orlando, L.
(2013). mapDamage2.0: fast approximate Bayesian estimates of ancient
DNA damage parameters. Bioinformatics 29, 1682–1684.
Lindgren, G., Backström, N., Swinburne, J., Hellborg, L., Einarsson, A., Sandberg, K., Cothran, G., Vilà, C., Binns, M., and Ellegren, H. (2004). Limited number of patrilines in horse domestication. Nat. Genet. 36, 335–336.
Jónsson, H., Schubert, M., Seguin-Orlando, A., Ginolhac, A., Petersen, L., Fumagalli, M., Albrechtsen, A., Petersen, B., Korneliussen, T.S., Vilstrup, J.T.,
et al. (2014). Speciation with gene flow in equids despite extensive chromosomal plasticity. Proc. Natl. Acad. Sci. USA 111, 18655–18660.
Lippold, S., Matzke, N.J., Reissmann, M., and Hofreiter, M. (2011). Whole
mitochondrial genome sequencing of domestic horses reveals incorporation
of extensive wild horse diversity during domestication. BMC Evol. Biol.
11, 328.
Cell 177, 1419–1435, May 30, 2019 1433
�Lira, J., Linderholm, A., Olaria, C., Brandström Durling, M., Gilbert, M.T.P., Ellegren, H., Willerslev, E., Lidén, K., Arsuaga, J.L., and Götherström, A. (2010).
Ancient DNA reveals traces of Iberian Neolithic and Bronze Age lineages in
modern Iberian horses. Mol. Ecol. 19, 64–78.
Logvin, A.V., and Shevnina, I.V. (2015). Settlement Belkaragaj 1. In Ancient Rugay and the Great Steppe: Part and Whole, A.Z. Beisenov, ed. (Kostanay-Almaty), pp. 122–144.
Lõugas, L. (1997). Post-glacial development of vertebrate fauna in Estonian
water bodies: a palaeozoological study. Dissertationes Biologicae Universitatis Tartuensis (Tartu University Press).
Mallory, J.P., and Adams, D.Q. (1997). Encyclopedia of Indo-European Culture
(Taylor & Francis).
Marciniak, S., and Perry, G.H. (2017). Harnessing ancient genomes to study
the history of human adaptation. Nat. Rev. Genet. 18, 659–674.
Martin, S.H., Davey, J.W., and Jiggins, C.D. (2015). Evaluating the use of
ABBA-BABA statistics to locate introgressed loci. Mol. Biol. Evol. 32, 244–257.
McCue, M.E., Valberg, S.J., Miller, M.B., Wade, C., DiMauro, S., Akman, H.O.,
and Mickelson, J.R. (2008). Glycogen synthase (GYS1) mutation causes a
novel skeletal muscle glycogenosis. Genomics 91, 458–466.
Pollard, K.S., Hubisz, M.J., Rosenbloom, K.R., and Siepel, A. (2010). Detection
of nonneutral substitution rates on mammalian phylogenies. Genome Res. 20,
110–121.
Purcell, S., Neale, B., Todd-Brown, K., Thomas, L., Ferreira, M.A.R., Bender,
D., Maller, J., Sklar, P., de Bakker, P.I.W., Daly, M.J., and Sham, P.C.
(2007). PLINK: a tool set for whole-genome association and population-based
linkage analyses. Am. J. Hum. Genet. 81, 559–575.
Ramsey, C.B. (2009). Bayesian Analysis of Radiocarbon Dates. Radiocarbon
51, 337–360.
Rasmussen, M., Anzick, S.L., Waters, M.R., Skoglund, P., DeGiorgio, M., Stafford, T.W., Jr., Rasmussen, S., Moltke, I., Albrechtsen, A., Doyle, S.M., et al.
(2014). The genome of a Late Pleistocene human from a Clovis burial site in
western Montana. Nature 506, 225–229.
Rohland, N., Harney, E., Mallick, S., Nordenfelt, S., and Reich, D. (2015). Partial
uracil-DNA-glycosylase treatment for screening of ancient DNA. Philos. Trans.
R. Soc. Lond. B Biol. Sci. 370, 20130624.
McDonald, J.H., and Kreitman, M. (1991). Adaptive protein evolution at the
Adh locus in Drosophila. Nature 351, 652–654.
Schmid, D., Peter, M., and Deschler-Erb, S. (2011). Crise, culte et immondices:
le remplissage d’un puits au 3ème siècle à Augusta Raurica. In L’Empire Romain En Mutation - Répercussions Sur Les Villes Dans La Deuxième Moitié
Du 3e Siècle, R. Schatzmann and S. Martin-Kilcher, eds. (éditions monique
mergoil montagnac), pp. 125–132.
McKenna, A., Hanna, M., Banks, E., Sivachenko, A., Cibulskis, K., Kernytsky,
A., Garimella, K., Altshuler, D., Gabriel, S., Daly, M., and DePristo, M.A. (2010).
The Genome Analysis Toolkit: a MapReduce framework for analyzing nextgeneration DNA sequencing data. Genome Res. 20, 1297–1303.
Schubert, M., Jónsson, H., Chang, D., Der Sarkissian, C., Ermini, L., Ginolhac,
A., Albrechtsen, A., Dupanloup, I., Foucal, A., Petersen, B., et al. (2014a). Prehistoric genomes reveal the genetic foundation and cost of horse domestication. Proc. Natl. Acad. Sci. USA 111, E5661–E5669.
Meyer, M., and Kircher, M. (2010). Illumina sequencing library preparation for
highly multiplexed target capture and sequencing. Cold Spring Harb. Protoc.
2010, pdb.prot5448.
Schubert, M., Ermini, L., Der Sarkissian, C., Jónsson, H., Ginolhac, A., Schaefer, R., Martin, M.D., Fernández, R., Kircher, M., McCue, M., et al. (2014b).
Characterization of ancient and modern genomes by SNP detection and phylogenomic and metagenomic analysis using PALEOMIX. Nat. Protoc. 9,
1056–1082.
Miller, B., Allard, F., Erdenebaatar, D., and Le, C. (2006). A Xiongnu tomb complex: Excavations at Gol Mod 2 Cemetery, Mongolia (2002–2005). Mongolian
J. Anthropol. Arc. Ethnol. 2, 1–21.
�n, E.O. (1974). Sagzabad Excavation Report. Iran 12, 216.
Negahba
Nieto Espinet, A. (2016). Seguint les traces de la transhumància. Aproximació
teòrica a partir dels resultats arqueozoològics de la fortalesa dels Vilars (Arbeca, Garrigues). Revista D’arqueologia de Ponent 26, 11–34.
Olalde, I., Brace, S., Allentoft, M.E., Armit, I., Kristiansen, K., Booth, T., Rohland, N., Mallick, S., Szécsényi-Nagy, A., Mittnik, A., et al. (2018). The Beaker
phenomenon and the genomic transformation of northwest Europe. Nature
555, 190–196.
Onar, V., Pazvant, G., Alpak, H., _Ince, N.G., Armutak, A., and Kiziltan, Z.S.
(2013). Animal skeletal remains of the Theodosius harbor: general overview.
Turk. J. Vet. Anim. Sci. 37, 81–85.
Orlando, L., Ginolhac, A., Zhang, G., Froese, D., Albrechtsen, A., Stiller, M.,
Schubert, M., Cappellini, E., Petersen, B., Moltke, I., et al. (2013). Recalibrating
Equus evolution using the genome sequence of an early Middle Pleistocene
horse. Nature 499, 74–78.
Outram, A.K., Stear, N.A., Bendrey, R., Olsen, S., Kasparov, A., Zaibert, V.,
Thorpe, N., and Evershed, R.P. (2009). The earliest horse harnessing and milking. Science 323, 1332–1335.
Schubert, M., Lindgreen, S., and Orlando, L. (2016). AdapterRemoval v2: rapid
adapter trimming, identification, and read merging. BMC Res. Notes 9, 88.
Schubert, M., Mashkour, M., Gaunitz, C., Fages, A., Seguin-Orlando, A., Sheikhi, S., Alfarhan, A.H., Alquraishi, S.A., Al-Rasheid, K.A.S., Chuang, R., et al.
(2017). Zonkey: A simple, accurate and sensitive pipeline to genetically identify
equine F1-hybrids in archaeological assemblages. J. Archaeol. Sci. 72,
147–157.
Sheikhi Seno, S., Mashkour, M., and Sardari, A. (2012). Subsistence Economy
of the Lapui settlement of Tepe Mehr Ali Fars on the basis of the archaeozoological analysis. J. Iran. Archaeol. 2, 39–60.
Skylitzes, J., and Wortley, J. (2010). John Skylitzes: A Synopsis of Byzantine
History, 811–1057: Translation and Notes (Cambridge University Press).
Stamatakis, A. (2014). RAxML version 8: a tool for phylogenetic analysis and
post-analysis of large phylogenies. Bioinformatics 30, 1312–1313.
Uerpmann, H.-P. (1990). Die Domestikation des Pferdes im Chalkolihikum
West-und Mitteleuropas, mit 10 Textabbildungen. Madrider Mitteilungen 31,
109–153.
Paradis, E., Claude, J., and Strimmer, K. (2004). APE: Analyses of Phylogenetics and Evolution in R language. Bioinformatics 20, 289–290.
Vieira, F.G., Lassalle, F., Korneliussen, T.S., and Fumagalli, M. (2016).
Improving the estimation of genetic distances from Next-Generation
Sequencing data. Biol. J. Linn. Soc. Lond. 117, 139–149.
Patterson, N., Moorjani, P., Luo, Y., Mallick, S., Rohland, N., Zhan, Y., Genschoreck, T., Webster, T., and Reich, D. (2012). Ancient admixture in human
history. Genetics 192, 1065–1093.
�evic
�, T.T., Pape�sa, A.R., Alic
�, I., Kabalin, A.E., Ostovic
�, M., and Ku�zir, S.
Vukic
(2017). Contribution to understanding Avar burials with equids in Croatia:
detailed archaeozoological analysis. Rev. Med. Vet. (Toulouse) 168, 73–80.
Pearson, J.C., Lemons, D., and McGinnis, W. (2005). Modulating Hox gene
functions during animal body patterning. Nat. Rev. Genet. 6, 893–904.
Wade, C.M., Giulotto, E., Sigurdsson, S., Zoli, M., Gnerre, S., Imsland, F., Lear,
T.L., Adelson, D.L., Bailey, E., Bellone, R.R., et al.; Broad Institute Genome
Sequencing Platform; Broad Institute Whole Genome Assembly Team
(2009). Genome sequence, comparative analysis, and population genetics of
the domestic horse. Science 326, 865–867.
Pedersen, C.T., Lohmueller, K.E., Grarup, N., Bjerregaard, P., Hansen, T., Siegismund, H.R., Moltke, I., and Albrechtsen, A. (2017). The Effect of an Extreme
and Prolonged Population Bottleneck on Patterns of Deleterious Variation: Insights from the Greenlandic Inuit. Genetics 205, 787–801.
Pickrell, J.K., and Pritchard, J.K. (2012). Inference of population splits and mixtures from genome-wide allele frequency data. PLoS Genet. 8, e1002967.
1434 Cell 177, 1419–1435, May 30, 2019
Wallner, B., Palmieri, N., Vogl, C., Rigler, D., Bozlak, E., Druml, T., Jagannathan, V., Leeb, T., Fries, R., Tetens, J., et al. (2017). Y Chromosome Uncovers
the Recent Oriental Origin of Modern Stallions. Curr. Biol. 27, 2029–2035.
�Wang, J., Vasaikar, S., Shi, Z., Greer, M., and Zhang, B. (2017). WebGestalt
2017: a more comprehensive, powerful, flexible and interactive gene set
enrichment analysis toolkit. Nucleic Acids Res. 45 (W1), W130–W137.
Warmuth, V., Eriksson, A., Bower, M.A., Cañon, J., Cothran, G., Distl, O., Glowatzki-Mullis, M.-L., Hunt, H., Luı́s, C., do Mar Oom, M., et al. (2011). European
domestic horses originated in two holocene refugia. PLoS ONE 6, e18194.
Williamson, R.J., Josephs, E.B., Platts, A.E., Hazzouri, K.M., Haudry, A.,
Blanchette, M., and Wright, S.I. (2014). Evidence for widespread positive
and negative selection in coding and conserved noncoding regions of Capsella
grandiflora. PLoS Genet. 10, e1004622.
Wilson Sayres, M.A., Lohmueller, K.E., and Nielsen, R. (2014). Natural selection reduced diversity on human y chromosomes. PLoS Genet. 10, e1004064.
Wutke, S., Sandoval-Castellanos, E., Benecke, N., Döhle, H.-J., Friederich, S.,
Gonzalez, J., Hofreiter, M., Lõugas, L., Magnell, O., Malaspinas, A.-S., et al.
(2018). Decline of genetic diversity in ancient domestic stallions in Europe.
Sci. Adv. 4, eaap9691.
Xu, X., and Arnason, U. (1994). The complete mitochondrial DNA sequence of
the horse, Equus caballus: extensive heteroplasmy of the control region. Gene
148, 357–362.
Yi, X., Liang, Y., Huerta-Sanchez, E., Jin, X., Cuo, Z.X.P., Pool, J.E., Xu, X.,
Jiang, H., Vinckenbosch, N., Korneliussen, T.S., et al. (2010). Sequencing of
50 human exomes reveals adaptation to high altitude. Science 329, 75–78.
Youn, M., Kim, J.C., Kim, H.K., Tumen, D., Navaan, D., and Erdene, M. (2007).
Dating the Tavan Tolgoi Site, Mongolia: Burials of the Nobility from Genghis
Khan’s Era. Radiocarbon 49, 685–691.
Cell 177, 1419–1435, May 30, 2019 1435
�STAR+METHODS
KEY RESOURCES TABLE
REAGENT or RESOURCE
SOURCE
IDENTIFIER
osteological remain
this study
Actiparc_GVA124_2143
osteological remain
this study
Actiparc_GVA307_2127
osteological remain
this study
Actiparc_GVA308_2312
osteological remain
this study
Actiparc_GVA309_2302
osteological remain
this study
Actiparc_GVA311_2253
osteological remain
this study
ArzhanII_Rus9_2500
osteological remain
this study
AugustaRaurica_JG160_1817
osteological remain
this study
Bateni_Rus16_3350
osteological remain
this study
Beauvais_GVA122_417
osteological remain
this study
Beauvais_GVA375_467
osteological remain
this study
Belgheis_TrBWBX116_485
osteological remain
this study
Boves_GVA191_1717
osteological remain
this study
BozAdyr_KYRH10_1267
osteological remain
this study
BozAdyr_KYRH8_1267
osteological remain
this study
CaminoDeLasYeseras_CdY2_4678
osteological remain
this study
Cantorella_UE2275x2_4791
osteological remain
this study
Chartres_GVA26_1917
osteological remain
this study
Chartres_GVA36_1917
osteological remain
this study
Chartres_GVA4_1917
osteological remain
this study
Chartres_GVA43_1917
osteological remain
this study
Chartres_GVA56_1917
osteological remain
this study
Chartres_GVA81_1917
osteological remain
this study
ElAcequion_Spain39_3993
osteological remain
this study
ElsVilars_UE4618_2672
osteological remain
this study
Evreux_GVA133_1817
osteological remain
this study
Evreux_GVA140_1817
osteological remain
this study
FrankfurtHeddernheim_Fr1_1863
osteological remain
this study
GolModII_Mon23_2007
osteological remain
this study
GolModII_Mon24_1993
osteological remain
this study
GolModII_Mon25_2011
osteological remain
this study
GolModII_Mon26_1999
osteological remain
this study
GolModII_Mon27_2011
osteological remain
this study
Halvai_KSH4_4017
osteological remain
this study
Khatuu_Kha2_t1_2312
osteological remain
this study
Khotont_UCIE2012x85_1291
osteological remain
this study
Macon_GVA201_1767
osteological remain
this study
Mainz_Mzr1_1373
osteological remain
this study
Marvele_01_1138
osteological remain
this study
Marvele_18_1189
osteological remain
this study
Marvele_21_1087
osteological remain
this study
Marvele_32_1144
osteological remain
this study
MerzlyYar_Rus45_23789
osteological remain
this study
Museum_Earb6_89
Biological Samples
(Continued on next page)
e1 Cell 177, 1419–1435.e1–e22, May 30, 2019
�Continued
REAGENT or RESOURCE
SOURCE
IDENTIFIER
osteological remain
this study
Noyon_GVA123_717
osteological remain
this study
Nustar_5_1187
osteological remain
this study
Oktyabrsky_Rus37_830
osteological remain
this study
OlonKurinGol_OKG2_2367
osteological remain
this study
Otepaa_Ote2_1184
osteological remain
this study
Ridala_Rid2_2717
osteological remain
this study
Saadjarve_Saa1_1117
osteological remain
this study
Sagzabad_SAGS27_3117
osteological remain
this study
SaintJust_GVA242_2250
osteological remain
this study
Sayangorsk_Rus41_2677
osteological remain
this study
SharIQumis_AM115_1557
osteological remain
this study
TavanTolgoi_GEP13_730
osteological remain
this study
TavanTolgoi_GEP14_730
osteological remain
this study
TavanTolgoi_GEP21_730
osteological remain
this study
UushgiinUvur_Mon37_3085
osteological remain
this study
UushgiinUvur_Mon39_3085
osteological remain
this study
UushgiinUvur_Mon41_3085
osteological remain
this study
UushgiinUvur_Mon42_3130
osteological remain
this study
UushgiinUvur_Mon43_3120
osteological remain
this study
UushgiinUvur_Mon44_3085
osteological remain
this study
UushgiinUvur_Mon45_3080
osteological remain
this study
UushgiinUvur_Mon79_3085
osteological remain
this study
UushgiinUvur_Mon87_3117
osteological remain
this study
WitterPlace_UK15_217
osteological remain
this study
WitterPlace_UK16_217
osteological remain
this study
WitterPlace_UK17_267
osteological remain
this study
WitterPlace_UK18_267
osteological remain
this study
Yenikapi_Tur140_1289
osteological remain
this study
Yenikapi_Tur141_1430
osteological remain
this study
Yenikapi_Tur142_1396
osteological remain
this study
Yenikapi_Tur145_1156
osteological remain
this study
Yenikapi_Tur146_1730
osteological remain
this study
Yenikapi_Tur150_1443
osteological remain
this study
Yenikapi_Tur170_1443
osteological remain
this study
Yenikapi_Tur171_1689
osteological remain
this study
Yenikapi_Tur173_1443
osteological remain
this study
Yenikapi_Tur175_1443
osteological remain
this study
Yenikapi_Tur176_1443
osteological remain
this study
Yenikapi_Tur181_1443
osteological remain
this study
Yenikapi_Tur193_1443
osteological remain
this study
Yenikapi_Tur194_1360
osteological remain
this study
Yenikapi_Tur229_1443
osteological remain
this study
Yenikapi_Tur243_1443
osteological remain
this study
Yerqorqan_YER28_2853
osteological remain
this study
ArzhanII_Arz15_2642
osteological remain
this study
ArzhanII_Arz17_2642
osteological remain
this study
ArzhanII_Rus11_2500
osteological remain
this study
Berufjordur_VHR102_1057
(Continued on next page)
Cell 177, 1419–1435.e1–e22, May 30, 2019 e2
�Continued
REAGENT or RESOURCE
SOURCE
IDENTIFIER
osteological remain
this study
BroughOfDeerness_VHR010_1417
osteological remain
this study
BroughOfDeerness_VHR011_1367
osteological remain
this study
BroughOfDeerness_VHR037_1417
osteological remain
this study
BroughOfDeerness_VHR062_1417
osteological remain
this study
Chartres_GVA111_1917
osteological remain
this study
Chartres_GVA112_1917
osteological remain
this study
Chartres_GVA115_1917
osteological remain
this study
Chartres_GVA28_1917
osteological remain
this study
Chartres_GVA47_1917
osteological remain
this study
Chartres_GVA48_1917
osteological remain
this study
Chartres_GVA53_1917
osteological remain
this study
Chartres_GVA60_1917
osteological remain
this study
Chartres_GVA75_1917
osteological remain
this study
Chartres_GVA9_1917
osteological remain
this study
ElAcequion_Spain38_4058
osteological remain
this study
Evreux_GVA135_1817
osteological remain
this study
Goyet_Vert311_35870
osteological remain
this study
Granastadir_VHR031_1067
osteological remain
this study
Marvele_02_1138
osteological remain
this study
Marvele_05_1138
osteological remain
this study
Marvele_16_1138
osteological remain
this study
Marvele_22_1138
osteological remain
this study
Marvele_27_1138
osteological remain
this study
Nustar_4_1187
osteological remain
this study
OlonKurinGol_OKG1_2367
osteological remain
this study
Quoygrew_VHR017_1117
osteological remain
this study
SaintQuentin_GVA237_1917
osteological remain
this study
Syrgal_Syr1t1c4_2317
osteological remain
this study
UushgiinUvur_Mon40_3085
osteological remain
this study
UushgiinUvur_Mon89_3085
osteological remain
this study
Vermand_GVA199_1742
osteological remain
this study
WitterPlace_UK19_267
Chemicals, Peptides, and Recombinant Proteins
N-Lauroylsarcosine solution 30% 500ml
Dutscher
Cat# 348533
Proteinase K 100MG
Thermo Fisher Scientific
Cat# 10103533
H2O, Molecular Biology Grade, Fisher BioReagents
Thermo Fisher Scientific
Cat# 10490025
Tween 20 100ML
Thermo Fisher Scientific
Cat# 10113103
Ethanol, Absolute, Mol Biology Grade
Thermo Fisher Scientific
Cat# 10644795
5M Sodium Chloride 100ML
Thermo Fisher Scientific
Cat# 10609823
USER Enzyme
New England Biolabs
Cat# M5505L
NEBNext End Repair Module
New England Biolabs
Cat# E6050L
Bst DNA Polymerase
New England Biolabs
Cat# M0275L
NEBNext Quick Ligation Module
New England Biolabs
Cat# E6056L
BSA Molecular Biology Grade
New England Biolabs
Cat# B9000S
ROX REFERENCE DYE 500mL
Thermo Fisher Scientific
Cat# 10635353
SYBR Green I Nucleic Acid 10000X concentrate
Thermo Fisher Scientific
Cat# 10710004
ACCUPRIME PFX DNA POLYMERASE 100mL
Thermo Fisher Scientific
Cat# 10472482
Agencourt AMPure XP - 60ml
Beckman Coulter
Cat# A63881
(Continued on next page)
e3 Cell 177, 1419–1435.e1–e22, May 30, 2019
�Continued
REAGENT or RESOURCE
SOURCE
IDENTIFIER
Buffer PE
QIAGEN
Cat# 19065
Buffer PB
QIAGEN
Cat# 19066
Buffer EB
QIAGEN
Cat# 19086
DMSO molecular biol 250ML
Thermo Fisher Scientific
Cat# 10397841
dNTP Set 100mM 100mL
Thermo Fisher Scientific
Cat# 10336653
EDTA 0.5M pH 8.0 Fisher Bioreagents 500ML
Thermo Fisher Scientific
Cat# 10182903
Tris HCl, 1M, pH 8.0, 100ML
Thermo Fisher Scientific
Cat# 10336763
Critical Commercial Assays
MinElute PCR Purification kit
QIAGEN
Cat# 28006
Tapestation screenTape D1000 HS
Agilent
Cat# 5067-5584
Bioanalyzer High Sensitivity DNA labchips kit
Agilent
Cat# 5067-4626
this study
ENA: PRJEB31613
Deposited Data
Raw and analyzed data
Software and Algorithms
ANGSD
Korneliussen et al., 2014
https://github.com/ANGSD/angsd
TreeMix
Pickrell and Pritchard 2012
https://bitbucket.org/nygcresearch/treemix/
wiki/Home
mapDamage
Jónsson et al., 2013
https://ginolhac.github.io/mapDamage
Paleomix
Schubert et al., 2014b
https://github.com/MikkelSchubert/paleomix
mstatspop
unpublished
https://github.com/CRAGENOMICA/mstatspop
NGSdist
Vieira et al., 2016
https://github.com/fgvieira/ngsDist
fastme
Lefort et al., 2015
http://www.atgc-montpellier.fr/fastme/binaries.php
raxML
Stamatakis 2014
https://cme.h-its.org/exelixis/web/software/raxml/
index.html
PLINK
Purcell et al., 2007
https://www.cog-genomics.org/plink2
AdapterRemoval
Schubert et al., 2016
https://github.com/MikkelSchubert/adapterremoval
Samtools
Li and Durbin, 2009
https://github.com/samtools/samtools
Momi2
Kamm et al., 2018
https://github.com/popgenmethods/momi2
Admixtools
Patterson et al., 2012
https://github.com/DReichLab/AdmixTools
CONTACT FOR REAGENT AND RESOURCE SHARING
Further information and requests for resources and reagents should be directed to and will be fulfilled by Lead Contact, Ludovic
Orlando (ludovic.orlando@univ-tlse3.fr).
EXPERIMENTAL MODEL AND SUBJECT DETAILS
Following low-depth sequencing, a total of 278 ancient equids reached a nuclear DNA coverage higher than 0.01X and were
investigated for sex and species identification using the methodology implemented in Zonkey (Table S1) (Schubert et al., 2017).
Additionally, 87 pure horses recovered from museum and/or private collections, palaeontological and archaeological sites spread
across Eurasia, showing moderate to high endogenous DNA content 0.06-0.78 were selected for whole-genome sequencing at a
depth-of-coverage higher than 1-fold. The following section describes the archaeological contexts associated with all equids
sequenced in this study (Tables S1, S2, and S3). The full name of each specimen is composed of the excavation site, followed by
the sample name and age (in years ago from 2017), as estimated from direct radiocarbon dating (Table S1) or inferred from the
archaeological context.
Belgium (Goyet A1)
The sample Goyet_Vert311_35870, a proximal fragment of a metatarsus, was unearthed from the first bone horizon (A1) of the third
cave of Goyet, which was excavated for the first time in 1868 by Edouard Dupont. The paleolithic Goyet cave is part of a larger cave
system located in the Belgian Mosan basin. Cave bear, reindeer and wild horse remains are the most common represented animals at
Cell 177, 1419–1435.e1–e22, May 30, 2019 e4
�the site (Germonpré, 2004). Excavations also revealed samples Goyet_Vert293_UpperPalaeolithic, Goyet_Vert300_31750 and
Goyet_Vert304_UpperPalaeolithic.
China
The sample Fengtai_Fen4_2820 originates from the multilayered dwelling of the Kayue site of Fengtai (Province Qinghai), which is
located at the rim of a large valley and consists of two phases. An early phase consisting of mainly wooden houses, dated to
�1190-920 BCE and a later phase composed of mud brick constructions, dated to �980-750 BCE. The presence of permanent houses and the substantial amount of remains of domesticated plant grains like wheat and barley found at the site indicate a relative
advanced mixed agropastoral economy.
�tar, Otok)
Croatia (Bapska, Nus
The late Neolithic settlement of Bapska-Gradac is located in Eastern Croatia, 4.5 km south of the Danube river. The site consists of
�a cultures and potentially also the Starc
�evo culture based on tools
different layers that have been associated with the Sopot and Vinc
and pottery finds. Radiocarbon dating of individual BapskaGradac_BAPSKA_1305 revealed that the remain was intrusive and dated
to �1305 years ago (C7th–C8th).
The late Avar period cemetery of Nu�
star is located in continental Croatia and is dated to the C8th and C9th. Samples Nustar_4_1187
and Nustar_5_1187 were unearthed during a rescue excavation in 2011 from one of the only two graves containing human and horse
remains. Both graves were found near the southwest edge of the cemetery and were oriented east-west. Within the burial, the human
remains were located on the right side, leaving the horse remains on the left side. Numerous grave goods such as iron knives, bronze
belts decorated with floral motifs and horse equipment were found. Some pathologies were detected on Nustar_5_1187, and are
exclusive to the spine, including thoracolumbar transitional vertebrae, spondylitis ankylopoetica (first two lumbar vertebrae) and
spondylosis chronica deformans on four thoracic vertebrae and one lumbar vertebra. Further morphological analysis showed that
the horse skeleton found in grave 4 (Nustar_4_1187) was probably five and a half to six years old at the time of death and had a slightly
larger height to the withers of 143 cm, whereas Nustar_5_1187 reached an age of circa seven years and had average withers height of
�evic
� et al., 2017).
139 cm (Vukic
The sample Otok_OTOK16_1307 was found at the archaeological site of Otok-Gradina, near the city Vinkovci during an excavation
carried out in 1970. Based on the grave goods, the site was dated to the late C8th-early C9th. Among the 22 graves found, there were
only two burials (Grave 4 and 16) containing the remains of humans and horses. The sample used in this study was found within grave
context 16 alongside a 40 to 50 years old male skeleton. The morphology of the bones identified the horse as a mare, which was
�evic
� et al., 2017).
confirmed genetically. Further morphological analyses estimated the withers height of the mare to 139 cm (Vukic
Estonia (Otepää hill-fort, Ridala, Saadjärve)
The sample Estonia_Ote2_1184 originates from the archaeological site of Otepää Hill-fort, which is located on an eponymous upland
area in the south of Estonia. This site covers a time period ranging from the Iron Age to the Middle Ages. However, the majority of the
archaeological bone material and artifacts found at the site are associated with the late Iron Age. The site produced numerous tools
(needles, knife handles, spinning-whorls, combs), weapons (arrowheads), ornaments (tusks, pendants, brooch), toys (die, toggles)
and other unidentified objects. Those artifacts have been mostly made out of bones and antler of domestic and wild animals, but teeth
(mainly canines) were also used to manufacture pendants. The bone material found at Otepää Hill-fort consists of cattle, pig, elk, bird,
sheep, goat and horse remains. Among the horse bone material, there were also two bones showing signs of processing.
The sample Ridala_Rid2_2717 was recovered from a fortified settlement on a moraine ridge close to the coastal zone of Saaremaa
Island (west Estonia), which was at the time of the settlement a coastal island. Excavations were carried out in 1961 by Aita Custin and
in 1963 by Artur Vassar. The archaeological site covers an area of around 4500 m2 and was dated to the C8th–C7th. Until now, approximately one tenth (435 m2) of the area has been excavated. A total of 2020 bone fragments have been recovered, 75% of which
belonging to domestic animals (sheep/goat, pigs, cattle, and horses) and 25% to wild animals (seals). Sheep and goat bone fragments are the most frequent while horse bones represent the least frequent of all faunal remains. The horse remains recovered
from this site belong to eight different individuals. Two were foals, two were slaughtered before the age of three and the other
four were between two and four and a half years old. The presence of remains from exclusively juvenile individuals suggests their
use for food consumption (Lang, 2012).
Sample Saadjarve_Saa1_1117 was excavated in 1984 at the settlement site of Saadjärve in eastern central Estonia, which is located
17 km north of the city of Tartu. Next to the remains of elks, cattle, goats, sheep, pigs, foxes, beavers, water voles, pikes and breams,
fourteen horse remains were recovered together with a range of the remains of freshwater fish, such as perch and burbot (Lõugas, 1997).
France (Beauvais: Maladrerie Saint-Lazare and rue de L’Isle-Adam, Boinville-en-Woëvre, Boves ‘‘Chemin de Glisy,’’
Capesterre, Chartres ‘‘Boulevard de la Courtille,’’ Evreux ‘‘Clos-au-Duc 3 rue de la Libération – 2007,’’ LongueilAnnel, Mâcon ‘‘Rue Rambuteau,’’ Metz ‘‘Place de la République,’’ Saint-Claude, Saint-Laurent Blangy ‘‘Actiparc
2002,’’ Vermand 2005 and Saint-Just-en-Chaussée)
La Maladrerie Saint-Lazare, located in Beauvais, Northern France, was a leper colony founded during the late C11th or early C12th. It
remained in activity until the French revolution, when it was closed and then sold to the French State. Horse Beauvais_GVA122_417
e5 Cell 177, 1419–1435.e1–e22, May 30, 2019
�was sampled from a petrosal bone excavated in 2013 from a latrine transformed into a waste pit (US 8057). The site from rue de L’IsleAdam at Beauvais is a former convent, excavated in 1992, dating back to the C15th. A deep hole containing equine bones, including
sample Beauvais_GVA375_567, was found next to the church of the convent. The bone remains include pieces of rachis and various
dislocated anatomical parts.
Boinville-en-Woevre is an ancient Gallo-Roman villa, located in Meuse, France. Fifteen pits containing the remains of some large
equids have been found in the pars rustica of the villa. Some of those pits contained several individuals, potentially buried simultaneously. In total, 22 individuals dating back to the C2nd and C3rd have been discovered, including Boinville_GVA125_1817, an 8-to10-year-old male, genetically identified as a donkey (Schubert et al., 2017).
Boves « chemin de Glisy » corresponds to a large archaeological area of Northern France. Several settlements dated from Iron Age
and Roman periods have been studied. The excavation of a large pit (6.80 m deep), corresponding to a Gallo-Roman quarry (C3th)
revealed several carcasses of animals (sheep, equids), including individual Boves_GVA191_1717.
The site of Roseau, located in Capesterre Belle-Eau (Guadeloupe), is associated with both some European remains dating back to
the C16th–C17th, and some pre-colonial Amerindian remains dating back to the C11th–C15th. Individual Capesterre_LIS2_417 is
associated with the European settlement.
Twenty-four horses sequenced in this study were excavated from the archaeological site of ‘‘Boulevard de la Courtille C277,’’
situated in the outskirts of Chartres, France. Hundreds of well-preserved scattered equids skulls were found lying on the
grounds, probably employed to drain excessive water in the antic city of Autricum (present-day Chartres). These 24
individuals are Chartres_GVA1_1917, Chartres_GVA2_1917, Chartres_GVA4_1917, Chartres_GVA9_1917, Chartres_GVA26_
1917, Chartres_GVA28_1917, Chartres_GVA36_1917, Chartres_GVA39_1917, Chartres_GVA43_1917, Chartres_GVA47_1917,
Chartres_GVA48_1917, Chartres_GVA53_1917, Chartres_GVA56_1917, Chartres_GVA60_1917, Chartres_GVA64_1917, Chartres_GVA64_1917, Chartres_GVA68_1917, Chartres_GVA75_1917, Chartres_GVA78_1917, Chartres_GVA81_1917, Chartres_GVA95_1917, Chartres_GVA111_1917, Chartres_GVA112_1917 and Chartres_GVA115_1917.
The archaeological site of Démuin is located in Somme, France and revealed an occupation period extending from the C9th to the
Renaissance. The equine bones represent 2.8% of more than 5,000 remains collected (Jonvel, 2014). Individuals Demuin_GVA401_917 and Demuin_GVA402_917 were sampled from isolated bones discovered in two grain silos transformed
into trash.
The site ‘‘clos-au-Duc 3 rue de la liberation’’ in Evreux, France, is a funeral site dated to the C1st to C3rd. Several excavated pits
contained parts of equid skeletons, including samples Evreux_GVA130_1817, Evreux_GVA132_1817, Evreux_GVA133_1817,
Evreux_GVA135_1817 and Evreux_GVA140_1817. There does not seem to be any ritual connection between humans and equids
since dead horses have been shown to represent waste. However, the site is connected to a rendering activity.
The archaeological site of Longueil-Annel, located in the middle valley of Oise, between the towns of Noyon and Compiegne, has
been associated with different occupations throughout the Neolithic, Bronze Age and Iron Age. However, individual
LongueilAnnel_GVA129_267 comes from a skeleton found in a modern pit dating back to the C18th.
The ‘‘Rue Rambuteau’’ site is situated in the outskirts of the antique city of Mâcon, Eastern France, and dates back to the C3rd. The
excavated area is a large dirt quarry containing a great amount of animal remains, mainly equids, but also cattle, dogs and pigs. In
total, 1,497 parts of dead equids were thrown in this waste area, representing at least 16 individuals, Macon_GVA201_1767.
Individual Metz_GVA321_492 was unearthed from the ‘‘Place de la République’’ site in Metz, France. The excavation, spreading
over 1,375 m2, has allowed the identification of numerous archaeological levels and remains, from the C1st to the C19th.
The excavations at Saint-Claude ‘‘Cité de la connaissance’’ (Basse-Terre, Guadeloupe), have revealed some pre-columbian occupations and some ancient sugar refineries. Some equine remains could be identified in levels dating back to the second half of the
C18th, including SaintClaude_GVA381_242, sampled from a petrous bone belonging to a 7-to-10-year-old individual.
Actiparc at Saint-Laurent-Blangy, Northern France, is a large area of 300 hectares excavated as part of the construction of a
craft activity area. Excavation campaigns revealed several types of settlements, including rural habitats, indigenous farms and a
necropolis. The time periods represented range from the ancient La Tène period in the Iron age, to the Roman period (3rd century
BCE – 4th century CE). The bones of horses Actiparc_GVA124_2143, Actiparc_GVA307_2127, Actiparc_GVA308_2312,
Actiparc_GVA309_2302 and Actiparc_GVA311_2253 all come from waste pits.
The gallic sanctuary of ‘‘Les Rossignols’’ in Saint-Just-en-Chaussée (Oise, France), excavated in 1994-1995, was occupied from
the final La Tène period in the Iron Age (D1-D2) up until the Roman High Empire. The most remarkable remains were ditches filled
with horse bones with pieces of chariots and harnesses, and some human bones. Samples SaintJust_GVA212_2162,
SaintJust_GVA219_2162 and SaintJust_GVA242_2250 were recovered from such ditches.
Saint-Quentin is an archaeological site in Aisne, France, from which a large number of bovine and equine samples have been
recovered. However, the precise nature of the assemblages has not been defined yet, it is therefore unsure whether the site can
be associated with some cultural activities or was rather used as a ditch. Individuals SaintQuentin_GVA237_1917 and
SaintQuentin_GVA238_1917 were sampled from petrosal bones dated to the C1st–C2nd.
The excavations at Vermand, in the department of Aisne, Northern France, were carried out in 2015 and delivered remains of an
ancient Roman way, as well as the remains of equines, including individual Vermand_GVA199_1742, which was excavated from
structure 15 of the site.
Cell 177, 1419–1435.e1–e22, May 30, 2019 e6
�Georgia (Dariali)
Tamara fort is situated in the Dariali Gorge of Northern Georgia, next to the Russian border, on a raised landform of the west bank of
the Tergi river. It was occupied from the Sasanian period to the Medieval period. Excavations at the site indicate several occupations
mainly between c. 400-1000 CE and a late reoccupation between the late C13th and early C15th. Individual Dariali_Georgia2_317
most likely dates back to this medieval period or a post-medieval one.
Germany (private collections, Schloßvippach)
The samples Mainz_Mzr1_1373 and FrankfurtHeddernheim_Fr1_1863 were both sampled from a private collection of Prof. emer.
Helmut Hemmer (Johannes Gutenberg-University Mainz). It was compiled between the 1960s to 1980s, mainly consisting of stray
finds of single loose bones found during excavations of Roman sites of the Rhine-Main area, Germany. Sample Mainz_Mzr1_1373
is a calvarium found at the construction site of the Mainz University clinic and was radiocarbon dated to 1,373 years ago. Sample
FrankfurtHeddernheim_Fr1_1863 is a calvarium found in Frankfurt-Heddernheim (Nida) in a soil filled well shaft and was radiocarbon
dated to 1,863 years ago.
Schloßvippach is an Early Bronze Age site located in Germany, dating back to 1600-2200 BCE and composed of a settlement of
long dwelling houses and a burial site with a large number of graves. Excavations have revealed some ceramics, bronze tools and
jewels, as well as animal bone remains, including the horse sample Schloßvippach_Svi6_3917.
Addendum to (Gaunitz et al., 2018), regarding the Roman horse from Augsburg-Haunstetten (Haunstetten_1979): Archaeozoological analysis revealed a 5-8-year-old stallion with a withers height of 124 ± 3 cm according to Kiesewalter. The specimen shows splint,
a premature ankylosis between the inside splint bone and the cannon bone of the right foreleg. This was probably caused by too early
and too much exercise. The teeth are showing cementum hypoplasias in the occlusal plane and transversal enamel hypoplasia near
to the dentinoenamel-junction. The latter is indicating unspecific stress at the end of enamel formation.
Iceland (Berufjörður and Granastaðir)
The sample Berufjordur_VHR102_1067 was excavated in 1898 by Daniel Bruun and Brynjúlfur Jónsson at site of Berufjörður in
Barðastrandasýsla (Westfjörds), Iceland and is dates to the Viking Age (ca. 850-1050 CE). Due to the incomplete documentation
of the site the exact association of the horse and human burials at the site is not clear. Only a few horse teeth with fragments of a
maxilla were kept from this particular horse burial, the horse was 5-to-7-year-old at death. The tooth sampled for this study was a
maxillary molar. The tooth has been radiocarbon dated to cal. (2s) 890–1015 CE.
Individual Granastadir_VHR031_1057 was sampled from a maxillary molar from Granastaðir, an early Viking farmstead in Northern
Iceland. The molar has been radiocarbon dated to cal. AD (2s) 895–1025. The site was excavated by Bjarni F. Einarsson between
1987 and 1991 (Einarsson, 1995). A collection of animal bones was recovered from the site both from a midden and from within
the excavated buildings mostly representing domestic animals.
Iran (Belgheis, Kulian Cave, Sagzabad, Shahr-i-Qumis, Tepe Hasanlu, Tepe Mehr Ali)
The citadel of Belgheis is located three kilometers away from the modern city of Esfarayen, in North East Iran. It covers an area of 180
hectares and was occupied from the beginning of the Islamic period until the C18th. Individual Belgheis_TrBWBX116_485 sequenced
in this study was sampled from a left third lower molar recovered from Tr BWBX116, Unit 12, Depth 515-235, dated to the SeljukidIlkhanid periods (C11th–C14th). Radiocarbon dating, however, further indicated that the specimen belonged to the C16th.
Kulian Cave is located near the city of Rawansar, about 52 km northwest of Kermanshah, in west Iran. The site contains Pleistocene
and Holocene archaeological deposits (Biglari and Taheri, 2000). The cave is about 20 m long and consists of two chambers. A
petrosal bone of a horse sequenced for this study, KulianCave_MV178_1694, was found in the inner chamber. Animal bone accumulation in this chamber most likely originated from carnivore activity and natural death. The equid belongs to a female individual
and was dated to the time of reign of Sasanian king Shapur II (309–379 CE).
Samples Sagzabad_SAGS27_3117 and Sagzabad_SAGxPit22_3117 were excavated from the archaeological site of Sagzabad,
located in the central district of Buin Zahra in the Qazvin plain, 140 km west of Tehran, Iran. Multiple archaeological campaigns
�n, 1974). The large animal assemblage
have evidenced a continuous occupation from the Late Bronze Age to the Iron Age II (Negahba
is composed of more than 10,000 identified bones and shows the importance of domestic herbivores ovi-caprines and cattle, followed by an important contribution of domestic equids.
Shahr-i-Qumis is a site in North East Iran, consisting of several isolated mounds spread across an area of 28 km. It dates back to
the Parthian and Sasanian periods, although some recent radiocarbon datings of faunal remains tend to show a longer period of
occupation, from the 8th century BCE to the 8th century CE (Hansman et al., 1970). The site has been identified as Hekatompylos,
the capital of the Parthian Empire and major hub of the Silk Road and Great Khorasan Road. Excavations at Shahr-i-Qumis revealed
a very large quantity of equine skeletons, including sample ShahrIQumis_AM115_1557 (Hansman and Stronach, 1970). The
radiocarbon date obtained for this sample place it either during the kingdom of Yazdegerd II (438–457 CE) or his brother Peroz I
(457–484 CE). At the beginning of the C5th, nomadic group and in particular the Hephthalites or White Huns attacked Persia several
times, invading parts of eastern Persia for several years. These events may have had also an impact of the equine population. A large
set of equine bones from Shahr-i-Qumis has been studied during these last years at the British Institute of Persian studies in Tehran
and currently a morphometric geometric project is ongoing on this material.
e7 Cell 177, 1419–1435.e1–e22, May 30, 2019
�Tepe Hasanlu is a fortified site located in Solduz Valley of Western Azerbaijan province, Northwestern Iran. The site was occupied
from the Late Neolithic to the Iron Age and consisted of two distinct parts: a High Mound and a Low Mound (Dyson, 1989). A total of
four individuals sequenced in this study originate from this site. Two horse samples were recovered from the citadel of Iron Age II
(1,050-800 BCE) associated with the Mannaean kingdom and destroyed by the Urartians during a battle around 800 BCE. While
individual TepeHasanlu_3461_2930 was unearthed from a rough soil deposit, TepeHasanlu_3394_2808 was found together with
thousands of artifacts and faunal remains, within the deposit and collapse of buildings, likely used as horse stables (Dyson,
1989). Individuals TepeHasanlu_1140_2682, TepeHasanu_3459_2667 and TepeHasanlu_V31E_2667 date back to the Urartian occupation period that followed the destruction of the citadel.
After a hiatus, period IIIa related to the Achaemenid Dynasty (550-330 BCE), for which no substantial architectural remains have
been found. Period II is also a debated issue but generally assigned to the Seleucid or Parthian period, post-Achaemenid (Dyson,
1999). These historical periods were very short at Hasanlu, chronologically between 400 to 270 BCE. Four samples, including
TepeHasanlu_2327_2352, TepeHasanlu_2529_2352, TepeHsanlu_2689_2352 and TepeHasanlu_3398_2352, belong to this
Historic Era.
Tepe Mehr Ali is located in the province of Fars, Southwest of Iran. The site belongs to the Lapui culture, dated to the Chalcolithic
(6th-4th mill. BCE), and shows an over-representation of domestic animals such as cattle, sheep and goats but also a significant number of wild herbivores, such as hemiones and gazelles (Sheikhi Seno et al., 2012). Individual TepeMehrAli_Trj12x31_CopperAge was
genetically identified as a pure hemione specimen (Schubert et al., 2017).
Kazakhstan (Belkaragay, Halvai)
Belkaragay is a Copper Age site located in the Kostanay region, Kazakhstan. The area of excavation spreads over 1,000 m2 and is
composed of ten house-like structures, in which many different animal bones were discovered. Those were attributed to various species, including the wolf, the Saiga antelope, the fox, the hemione and the horse, such as samples Belkaragay_NB13_CopperAge and
Belkaragay_NB15_CopperAge included in this study (Kosintsev, 2015; Logvin and Shevnina, 2015).
Sample Halvai_KSH4_4017 was excavated from Kurgan Halvai 5 (pit number 4), which located on the left bank of the Tobol branch
of the Karatomar Reservoir in Northern Kazakhstan (Kostanay Region), located 500 m to the north-east of the Sintashta kurgan Halvai
3. The kurgan was 30 m in diameter and 80 cm in height. Pit number 4, which is associated with the Sintashta culture of the Bronze
Age, was located directly in the center of the kurgan. The horse skull was found close to the edge of the southern wall of the pit. In
addition to the horse skull, the pit also contained human remains, belonging to a female, and other grave goods, such as a zoomorphic stone altar, stone tips, pebble fragments and fragments of a vessel. Another individual, Halvai_KSH5_2542, was excavated from
Kurgan Halvai 3 (pit number 8A). The horse skeleton was found together with the remains of an approximately 50 years old woman
and a sheep. Based on the position of the skeleton and stratigraphic information, the burial can be assumed to have been constructed during the Early Iron Age.
Kyrgyzstan (Boz-Adyr)
The Boz-Adyr burial ground is located on the slope of the Ak-Bakshy mountain range, located in the Issyk-Kul region, Kyrgyzstan. The
burials are located in mounds, which is characteristic for the funeral traditions of the nomadic and semi-nomadic populations of Tien
Shan and Semirechye, especially during the C12th–C15th. During the excavation in 2014, three burial mounds showing next to human
remains also the skeletons of horses were discovered (burial mounds number 10, 16 and 19). The burial rites associated with those
graves are characteristic for the Turkic period of the C6th–C9th.
Burial mound 16 was a swampy rock-earthen embankment of a circular shape with a diameter of 5 m. At a depth of
150-160 cm, the remains of a decapitated adult male, accompanied by a horse, were discovered. The skeleton of horse
sample BozAdyr_KYRH8_1267 was supported by two boulders, with its legs bent and the head pointing west. The neck
was bend facing north. Alongside with the horse remains, bit wear, iron stirrups and the remains of a wooden saddle were
also discovered.
Burial mound number 19 is located 15 m to the west of burial mound number 16. At a depth of 140 cm, the undisturbed remains of a
human and horse, BozAdyr_KYRH10_1267, were discovered. The human skeleton was found lying on its back with the head pointing
to the east, and the legs bent pointing to the right. The horse was positioned on it, with the abdomen turned to the right and the head
pointing to the west.
Lithuania (Marvele_ cemetery)
Marvele is a large medieval cemetery located in Kaunas, Lithuania, and dates back to the C8th to the C11th. It consists of 211 human
sius and
burials that also contain about 250 horse remains, either whole skeletons, head and forelegs only or scattered remains (Berta�
Daugnora, 2001). The vast majority of buried horses are young adults under ten years and can be associated with some ritual
�iai people during that era. Individuals Marvele_01_1138,
offerings, which seemed to be common in the Baltic Auk�
staic
Marvele_02_1138, Marvele_05_1138, Marvele_16_1138, Marvele_18_1189, Marvele_21_1087, Marvele_22_1138, Marvele_27_1138
and Marvele_32_1144 were all excavated from Marvele cemetery.
Cell 177, 1419–1435.e1–e22, May 30, 2019 e8
�Moldova (Miciurin)
The horse sample Miciurin_Mic2_3267 was excavated from the Bronze Age site of Mciurin, Moldova (1500-1000 BCE). The discovery
of some slag fragments and some mill remains indicate the presence of Bronze craftsmanship, and to some extent mill cereal agriculture at Miciurin.
Mongolia (Gol Mod II, Khatuu 2, Olon-Kurin-Gol (Olon Guuriin Gol), Uushgiin Uvur, Talvan Tolgoi, Khotont)
The Gol Mod II site is a cemetery located in Central North Mongolia, north of the Khangai mountains, that dates back to the 3rd century
BCE to the 1st century CE (Miller et al., 2006). All sequenced horses from this site come from Grave #1, which apparently belonged to
an aristocratic figure of the Xiongnu period. With a length of 86 m, the whole burial structure is one of the largest burial structure of
Central Asia. The grave has been robbed, but still yields with rather astonishing bronze, glass and gold artifacts, which suggests a
burial ritual for kings of the Xiongnu period. At a depth of 10 m, remains of 25 different horses were excavated, including GolModII_
Mon23_2007, GolModII_Mon24_1993, GolModII_Mon25_2011, GolModII_Mon26_1995 and GolModII_Mon27_2011, which were all
sampled from petrous bones.
Khatuu 2 is an Iron Age site located in the Mongolian Altai, associated with the nomad culture of Pazyryk and dating back to the 4th
and 3rd centuries BCE. Sample Khatuu_Kha2_t1_2312 was excavated from a tomb that contained the skeletons of one human and
one horse.
The undisturbed and permafrozen Pazyryk burial complex of Olon-Kurin-Gol (Olon Guuriin Gol) was excavated in the summer of
2006 by a German-Mongolian-Russian expedition team. The Kurgan is located close to the upper Olon-Kurin-Gol River on the southern slope of the Saylyugem Mountains, Mongolian Altai. The grave contained the partially-mummified, fully-dressed remains of a
Scythian warrior and two horse skeletons. The samples OlonKurinGol_OKG1_2367 and OlonKurinGol_OKG2_2367 originate from
such horses. Along with the horse remains, the harness and saddle of the horses were found.
The individuals UushgiinUvur_Mon37_3085, UushgiinUvur_Mon39_3085, Uushgiin UushgiinUvur_Mon40_3085, UushgiinUvur_
Mon41_3085, UushgiinUvur_Mon42_3130, UushgiinUvur_Mon43_3120, UushgiinUvur_Mon44_3085, UushgiinUvur_Mon45_3080,
UushgiinUvur_Mon79_3085, UushgiinUvur_Mon87_3117 and UushgiinUvuur_Mon89_3085 were all sampled from petrosal bones
excavated from the Uushgiin Uvur site, a large Bronze Age complex of deer stones and ritual mounds, located in front of the Ulaan
Uushig Mountain, Mongolia. There are about 30 deer stones, arranged in a row from north to south, surrounded by many ritual structures with solid or ring-shaped rock coverings. Mongolian-Russian archaeologists within the Uushgiin Uvur – 2013 Project, run by the
Department of Archaeology of Ulaanbaatar University of Mongolia and the Institute of Archaeology, Russian Academy of Sciences,
excavated a ritual complex with deer stones (Kovalev et al., 2016). All deer stone statues are made of light gray, reddish brown or
blue-gray granite. Based on the horse bones, the Uushgiin Uvur Deer Stone Complex was dated to 1,312-810 BCE.
Tavan Tolgoi is a steppe cemetery located in South East Mongolia, associated with the Mongolian Empire and dated to 1,2061,368 CE (Youn et al., 2007). It is characterized by a post and unique stone carvings that indicate the presence of no less than 14
graves. Eight graves were excavated in 2004 and 2005 by a team from the National University of Mongolia and revealed artifacts
dating to the Mongolian Empire period. Grave 4 contained horse stirrups, a birch bark quiver, male adult human remains as well
as sheep and horse cranial bones, from which the genomes of TavanTolgoi_GEP13_730, TavanTolgoi_GEP14_730 and
TavanTolgoi_GEP21_730 were sequenced. In 2012, a Chinese-Mongolian team of archaeologists excavated a mound on the top
of the mountain Bayantsogt, located in Khotont Soum in the Arkhangai Aimag province. The site is elevated at 1.75 m above sea level.
The mound itself is approximately 2.6 m tall with the basal diameter of about 26 m and shows a 24 m-long and six meters-wide ridge
on its southeast face. Graverobbers have left a hole starting from the top. The excavation yielded wooden artifacts, sheep and/or goat
bones, along with some horse bones, including a petrosal bone of individual Khotont_UCIE2012x85_1291. The external features and
internal organization of the mound indicate that it belonged to ancient Uyghurs (611-840 CE).
Poland (Bruszcewo)
Individual Bruszcewo_Bru4_3917 was excavated from the Early Bronze Age site of Bruszcewo, located in Poland around 60 km south
of Poznan and dating back to 2,200-1,600 BCE.
Portugal (Santarém)
Alcáçova of Santarém is placed in the right bank of the lower Tagus estuary, it is an important and large site (50,000 m2) located in a
plateau overlooking the river, where an extensive diachronic occupation (since Late Bronze Age until nowadays) has been identified.
The sample 254, an inferior premolar 4, was recovered in the excavations carried out in 2001, at layer [14], corresponding to the
Islamic occupation, according to the ceramic material, well dated to the C11th–C12th.
Russia (Altata, Arzhan II, Balagansk, Bateni – Karasuk, Derkul, Kokorevo, Krasnaya Gorka, Lebyanzhinka IV, Merzly
Yar, Oktyabrsky, Potapovka I, Sayangorsk, Sintashta)
Altata is a settlement located in the Saratov region, Russia, encompassing a total area of 100 to 200 m2, from which different artifacts
associated with the Neolithic could be recovered. Animal remains found at this site have been identified aurochs, foxes and horses,
including sample Altata_NB31_Neolithic.
e9 Cell 177, 1419–1435.e1–e22, May 30, 2019
�The Scythian burial mound or the so-called kurgan of Arzhan represents the youngest of its kind and can be associated with the
Aldy-Bel culture, which dates back to the boundary of the 7th and 6th century BCE. The elite funeral complex is located only nine
kilometers away from Arzhan I in the Uyuk hollow, from which ArzhanI_Arz3_2767 was excavated. The undisturbed kurgan is
80 m in diameter and 2 m-high and consists of 27 graves, from which individuals ArzhanII_Arz15_2642 and ArzhanII_Arz17_2642
were unearthed. Additionally, a special burial including fourteen harnessed horses was found during the excavation expedition
from 2001 to 2003, which includes individuals ArzhanII_Rus9_2500 and ArzhanII_Rus11_2500.
Individual Balagansk_Rus19_2017 was excavated from Balagansk, a village located close to the Angara river in the Irkutsk region,
flooded by the Bratsk reservoir. It represents a Central Asian trading settlement associated with the Ust-Talka culture.
The sample Bateni_Rus16_3318 was retrieved from a right distal metatarsal bone and belongs to the Late Bronze Age Karasuk
culture (1,500-800 BCE), which followed the Andronovo culture in the South of Siberia. It covered an area from the Aral Sea to the
Yenisei river on the East and to the Altai mountains and Tien Shan in the South. Karasuk communities are known to be farmers
who practiced a mixture of agricultural and stockbreeding of cattle, sheep and horse. They are especially known for their metallurgy,
in particular for their daggers and knives (Mallory and Adams, 1997). The bone sample was excavated close to the Bateni settlement,
Republic of Khakassiya. The excavation site is not accessible anymore due to the flooding of the Krasnoyarsk Reservoir.
Derkul is a settlement dating back to the Neolithic, situated in the Orenburg region of Russia, and from which only one house-like
structure has been excavated. Both Neolithic artifacts and animal bones, including remains of individuals Derkul_NB2_Neolithic and
Derkul_NB4_Neolithic, could be unearthed from this small site.
Kokorevo I is a late Upper Palaeolithic site associated with the Kokorevo culture, located by the Upper Yenisey river, Russia. The
horse sample Kokorevo_Rus3_14450 was found in level 4, and is thus thought to be slightly older than level 3, dated to 14,450 years
BP. This Pleistocene horse most likely represents a wild individual.
Horse sample KrasnayaGorka_Rus48_1446 was sampled from a left humerus unearthed from the Krasnaya Gorka burial mound,
Republic of Tyva, Russia, and dating back to the C6th. No further information could be recovered regarding this site.
Individual LebyazhinkaIV_NB35_Neolithic was unearthed from the settlement of Lebyazhinka IV, Samara region, Russia. Based on
excavated artifacts, this site has been associated with the Neolithic and the Copper Age. Animal bone remains found on site have
been associated with beavers, horses, Siberian roe deers, aurochs and elks.
The Paleolithic horse MerzlyYar_Rus45_23789 was sequenced from bone fragments recovered from an outcrop in the Todza
depression, close to the village of Seiba, Republic of Tuva, Russia. It is not associated with any archaeological context.
Oktyabrsky is a village located on the lower Volga river, in Ustin district, Kalmyk Republic of Kalmyk, Russia. The burial ground is
associated with the Sarmat culture, but as many steppe cemeteries, it contains a number of additional younger graves. Individual
Oktyabrsky_Rus37_830 was sampled from a left metatarsal bone of a complete horse carcass, unearthed from grave 1 of the burial
mound number 16. A second individual, Oktyabrsky_Rus38_659, was unearthed from grave 1 of burial mound 3. These burial
grounds are associated with Sarmatian time in general, but some bone remains, including the two individuals included in this study,
date back to more recent times, namely the early post-Khazar and the late Golden Horde periods.
Sintashta is a late Bronze Age archeological site located in Chelyabinsk Oblast, Russia, and is associated with the eponymous
Sintashta culture. This site includes five cemeteries and no less than 40 graves. The horse samples Sintashta_NB44_3577 and
Sintashta_NB45_3577 were recovered from grave number 19, together with a chariot and two other horses.
Individual PotapovkaI_1_3900 was sampled from the left mandible of mare excavated from Kurgan 3 of the settlement of
Potapovka I, by the Sok River, in the Samara region, Russia. This site is associated with the Bronze Age Potapovka culture and
has revealed a large number of pieces of metalwork. The horse skull was placed over the body of a decapitated woman, potentially
as an offering.
The city of Sayanagorsk in the Republic of Khakassiya is located in the south part of the Minusinsk basin at the left bank of the
Sayan Mountains. Sample Sayangorsk_Rus41_2677 originates from the right tibia of a horse which was unearthed during the excavations from the site Ai-Dai 1 (mound 3, grave 1). This site is associated with the Tagar culture (7th to 2nd centuries BCE) in South
Siberia, which was preceded by the Karasuk culture.
Slovakia (Sebastovce)
Individual Sebastovce_131_1317 was sampled from a tooth, excavated from the medieval Avarian_Slavonic cemetery of
�
Sebastovce,
Slovakia, dating back to the C7th–C8th.
Spain (Camino de las Yeseras, Cantorella, Capote, El Acequión, Els Vilars)
The large settlement of Camino de las Yeseras, located in San Fernando de Henares, Madrid, Spain, was occupied between the
beginning of the 3rd and the 2nd millennia BCE. Domestic structures such as hut pits have been associated with both pre-Beaker
phase and Bell-Beaker culture. Because of its remarkable size and strategic location - near rivers and flint mines, it is thought to
have played a major role in central Iberia (Blasco et al., 2011). The central area of Camino de las Yeseras is a big structure with a
sunken floor of circa 600 m2, with more than 50 adjunct structures and a stratigraphy of about 2 m. One of the excavated units yielded
1772 faunal remains, including both domestic and wild animals. The horse CaminoDeLasYeseras_CdY2_4678 was excavated from
the central area of the site and radiocarbon dated to 2,861-2,496 BCE, which is associated with the Pre-Bell-Beaker phase of the site
(Liesau, 2017).
Cell 177, 1419–1435.e1–e22, May 30, 2019 e10
�The Cantorella settlement is situated in the Corb valley, Catalonia, Spain, discovered in March 2010 and dated to 3,670-1,800 BCE.
It was inhabited twice in prehistory, once during the Final Neolithic - chalcolithic and once during the Bronze Age, and a distance of
200 m separates the two settlements. Although Cantorella faunal archaeological records are scarce compared to Iron Age Catalan
sites, horse remains are very abundant relative to other animals, especially in the Late Neolithic - Chalcolithic occupancy (Abad et al.,
2011). A number of 15 silos of that period revealed the presence of Equus sp., which might represent an autochthonous species of
horse. Horse remains were present in approximately 50% of the final Neolithic structures but absent from all but two Bronze Age
silos. Cantorella_UE2275x2_4791 was sampled from a petrous bone unearthed from silo SJ-191 that contained two horse skulls
from Final Neolithic - Chalcolithic period.
The sample Capote_Cap102_2464 is an upper molar tooth. It was found in a bone depot, inside of a house at the hill-fort of Castrejón de Capote, a Celtic fortified village of the Iberian Late Iron Age (4th–1st century BCE). This house, ‘‘HE-A,’’ is an archetypical
household of two rooms, the first bigger and used for several functions (cooking, eating, etc.) and the second and smaller, for storing
and sleeping. In this pattern of household, the first room used to be a hearth and a quern, and in this room, there is a central big hearth
that was stratigraphically dated to the middle of 2nd century BCE. Below the layer sequence of this depot, there is an older sequence
dated from the 4th century to the first half of the 2nd century BCE, and above, a later sequence from the second half of the 2nd century
BCE to the first half of the 1st century BCE. The three sequences show similar household remains but only the intermediate one has
faunal remains, mainly from horses, cows and pigs. Although this hill-fort is well-known in Celtic archaeology for an important very
well-preserved shrine, where collective banquets were hold by the time of the sequence IIb, the charcoal and bones remains of HE-A
are believed to belong to the household field.
The two individuals belonging to the Bronze Age village of El Acequión were sampled from petrous bones (ElAcequion_
Spain38_4055 and ElAcequion_Spain39_3993). El Acequión is located on the margins of an eponymous drained endorheic lake.
Excavated features in the inner precinct include huts, pavements and dump yards, where most of the faunal remains derive. An
extraordinary number of horse bones have been found on site, many of them exhibiting chop and hack marks, which gave rise to
the hypothesis that, despite its chronology, some of these horses could represent domestic animals (Liesau, 2005). No human remains have been recorded.
The fortress of Els Vilars, located in the Segre valley, Catalonia, Spain, is a complex defensive site, occupied between 750 BCE and
325 BCE. The fortress has been built and developed throughout four distinct periods: Vilars 0 (775-700/675 BCE), Vilars I (700-675550 BCE), Vilars II (550-425 BCE), Vilars III (425-375/350 BCE) and Vilars IV (375/350-325 BCE). The pre-Iberian phases (Vilars 0 and I)
yielded little faunal archaeological record and very few equids (representing only �0.8% of animal remains) as they were most likely
associated with a pastoral economy based on subsistence activities. Both the quantity of domestic animal and the proportion of
horse remains excavated increased throughout the following periods, with horses representing more than 10% of excavated animal
bones of Vilars III (Nieto Espinet, 2016). Intriguingly, people inhabiting Els Vilars started burying horse fetuses by Vilars I, an unprecedented ritual practice that seemed to have become more common throughout Vilars II. Individual ElsVilars_UE4618_2672 was
sampled from an adult bone in a domestic unit associated with Vilars I.
The sample Vicerrectorado_VIR175_1717, a superior premolar, comes from the excavation developed in a plot of the Roman city of
Lucus Augusti, capital of the Conventus Lucensis and administrative center of northern Gallaecia in the northwest of the Iberian
Peninsula. In this place, a long occupational sequence has been recognized, but the stratigraphic unit (UE-2101) in which this sample
was recovered is assigned to low-imperial moments (C4th) considering the archaeological material present. In addition to equine remains, the fauna corresponds mainly to domestic species (cattle, pigs, sheep, goats, dogs) as well as some wild animals, mainly deer.
Sweden (Uppsala)
Individual Uppsala_Upps02_1317 was sampled from a tooth excavated from a medieval site dating back to the C7th–C9th, and
situated in Uppsala, Sweden.
Switzerland (Augusta Raurica, Stein am Charregass, Solothurn Vigier)
The Roman archaeological site of Augusta Raurica is located on the Rhine bank 20 km east of Basel, Switzerland, and was an important Roman trade center throughout the C1st, C2nd and C3rd. Individual AugustaRaurica_JG160_1817 was recovered from an underground fountain in Insula 8, an ancient residential and artisanal area of the site (Schmid et al., 2011). The fountain was established
around 80 CE together with an 11 m-deep well and an access tunnel typical of a Roman province architecture. The well was then
likely used as a disposal structure and filled on several times with artifacts, tools and animal remains throughout the C2nd and
C3rd. Individuals AugustaRauricaSchmidmatt_NBxK9279_1717 and AugustaRauricaSchmidmatt_NBxP9261_1782 were unearthed
from building Schmidmatt in Augusta Raurica, which represents one of the best preserved Roman buildings of Switzerland.
The site of Stein am Rhein Charregass was a Roman military camp on a hill close to the river Rhine. It was built as defense at the
border of the Roman Empire at the end of the C3rd to the end of C4th. Large amounts of animal bones were retrieved from a ditch
around the camp, including sample Charregass_NBxRa849_1667.
The site Solothurn Vigier was a Roman vicus and trading post during the C1st–C4th by the river Aare. It is located along the axis of
the Roman regional capital Aventicum and Augusta Raurica at the river Rhine. A bridge indicates a changing place for transport
animals, which is supported by the presence of cattle and many equine remains, such as SolothurnVigier_NB63_1867
SolothurnVigier_NB175_1817 and SolothurnVigier_NB699_1867.
e11 Cell 177, 1419–1435.e1–e22, May 30, 2019
�Turkey (Yenikapi)
Yenikapi is a site located in present-day Istanbul that used to be the major Byzantine harbor of Theodosius, founded by emperor Theodosius I during the 4th century BCE. Yenikapi thus represents the major harbor of the Byzantine period, and a prominent Late Antiquity
trade hub in the Mediterranean basin. Excavations revealed 36 wrecked ships, many artifacts and tools, and over 20,000 animal bones,
mostly horses, mules and donkeys, but also cattle, sheep and pigs. Horse skeletons, representing �32.6% of all animal skeletal remains,
mainly belong to young male individuals no older than ten years (Onar et al., 2013). These include 12 stallions sequenced in this study, all
sampled from petrosal bones: Yenikapi_Tur140_1289, Yenikapi_Tur141_1430, Yenikapi_Tur142_1396, Yenikapi_Tur145_1156,
Yenikapi_Tur146_1730, Yenikapi_Tur150_1443, Yenikapi_Tur167_1443, Yenikapi_Tur168_1443, Yenikapi_Tur169_1443, Yenikapi_
Tur170_1443, Yenikapi_Tur171_1689, Yenikapi_Tur173_1443, Yenikapi_Tur175_1443, Yenikapi_Tur176_1443, Yenikapi_Tur181_1443,
Yenikapi_Tur189_1443, Yenikapi_Tur191_1443, Yenikapi_Tur193_1443, Yenikapi_Tur194_1360, Yenikapi_Tur206_1443, Yenikapi_
Tur229_1443, Yenikapi_Tur243_1443, Yenikapi_Tur244_1443, Yenikapi_Tur246_1443, Yenikapi_Tur271_1443, Yenikapi_Tur273_1443,
Yenikapi_Tur276_1443 and Yenikapi_Tur277_1443.
United Kingdom (Brough of Deerness, Quoygrew, Whitehall Roman Villa and Witter Place)
Brough of Deerness is a Pictish (pre-Viking Age) and Viking Age settlement set atop a roughly 30 m-high sea stack located in the
East Mainland of Orkney. All horse samples analyzed in this study (BroughOfDeerness_VHR010_1417, BroughOfDeernees_
VHR011_1367, BroughOfDeerness_VHR037 and BroughOfDeerness_VHR062_1417) are of Pictish date (C6th–C7th) and originate
from excavation area C (Barrett and Slater, 2009).
The sample Quoygrew_VHR017_1117 was excavated from the site of Quoygrew, a rural settlement situated on the island of Westray in Orkney, Scotland, that was occupied from the C10th until the 1930s. The sample was from Context C010 (of C11th–C12th date)
within excavation area C of a coastal shell and fish-bone midden (Barrett, 2012).
Individual WhitehallRomanVilla_UK08_1667 was sampled from a petrous bone of a horse excavated from a Roman settlement near
Nether Heyford, Northamptonshire, United Kingdom, dating back to the Roman times (C3rd and C4th).
Witter Place is a post-medieval/pre-modern site, dating back to the C17th to the C19th and located just outside the northern walls of
the city of Chester, United Kingdom. Excavated in 2001, the site shows a very large number of animal remains, mainly of cattle and
horse (representing 93% of identifiable remains) but also dog, and to a smaller extent goat, sheep, pig and other wild mammal species, such as rabbit or hare. Witter place most likely represents a butchery site involved in animal-based industry and a possible tanning complex as suggested by the discovery of tanning pits. Most horses were old individuals over 20 years, showing some hack and
chop marks for �3% of them. While all parts of the horse skeleton could be recovered, the distribution of bones was uneven, with a lot
of long bones but very few phalanxes. Individuals WitterPlace_UK15_217, WitterPlace_UK16_217, WitterPlace_UK17_267, WitterPlace_UK18_267, WitterPlace_UK19_267 and WitterPlace_UK20_217 were recovered from petrosal bones found on site.
Uzbekistan (Yerqorqan/Erkurgan)
Sample Yerqorqan_YER28_2853 was recovered from Yerqorqan (also referred to as Erkurgan), an ancient city surrounded by walls,
located in Southern Uzbekistan, North of Qarshi. It was first settled during the second half of the 2nd millennium BCE, then occupied
until the Sassanian period and destroyed by the Turks during the C6th. Excavations revealed the presence of a large palace located
within a citadel, as well as temples and a mausoleum, thus showing the political and religious influence of the ancient city. Moreover,
excavated blacksmith tools, pottery and currencies tend to suggest that this site used to be a major trading hub.
Museum
Individual Museum_Earb6_89 is an English Thoroughbred racehorse stallion, known as Dark Ronald, preserved in a museum in Halle,
Germany. He was born in 1905 and shot to death in 1928, when old and suffering from colic. Early in his life, he fathered many thoroughbred and sport horses, and hence has had a critical influence on the whole horse warmblood breeding industry until now. DNA
was sequenced from a petrosal bone of Dark Ronald’s skull. Individual Museum_Earb5_105 was sampled from a petrosal bone of an
English Thoroughbred stallion, also from a museum in Halle, Germany, that was born in 1891 and died in 1912.
Comparative dataset
We assembled a comparative panel consisting of 42 ancient and 30 modern genomes published in the literature (Table S3). Additionally, the genomes of namely a Somali wild ass and/or a domestic donkey were included as outgroups (Jónsson et al., 2014; Orlando
et al., 2013). The panel of ancient horse genomes consists of three wild extinct horses from a now-extinct lineage dating back to
�5000-42000 years ago (Librado et al., 2015; Schubert et al., 2014a), four horses from Botai and five from Borly4, dated to
�5,000-5,500 years ago, one mare associated with the Sintashta culture (�4,000 years ago), two stallions from Arzhan I dating
back to �2,700 years ago, 11 stallions associated with the Scythian site of Berel’, �2,300 years ago, one horse from the C19th Yakutia
and one historical Przewalski’s individual, also from the C19th. The panel of modern horse includes six genomes of Przewalski’s horses and those of 24 domestic horses from 18 domestic breeds, namely one Arabian horse, one Connemara Pony, one Duelmener, one
Franche-Montagnes, one Friesian, one Hanoverian, one Saxon-Thuringian Heavy Warmblood, one Jeju pony, one Marwari, one
Morgan, one American Quarter, one Sorraia, one Standardbred breed, as well as two Icelandic horses, two Shetland ponies, two
Mongolian individuals, two Thoroughbreds and three Yakutian horses.
Cell 177, 1419–1435.e1–e22, May 30, 2019 e12
�METHOD DETAILS
DNA extraction and genome sequencing
Drilling and DNA extractions of osseous material were carried out in the ancient DNA facilities of the Centre for GeoGenetics, University of Copenhagen (Denmark), and laboratoire AMIS CNRS UMR 5288, Université de Toulouse III Paul Sabatier (France). DNA
was extracted from 115-730 mg of bone or tooth powder, following method Y from Gamba et al. (2016), with slight modifications.
The powder was first digested for 1h at 37� C, in 4 mL of lysis buffer, composed of EDTA 0.45M, N-lauryl Sarcosyl 0.5% and
Proteinase K 0.25 mg/ml. Following this pre-digestion step, the recovered pellets underwent a second digestion overnight at
42� C in an identical fresh lysis buffer. DNA was then concentrated and purified from the supernatant fraction of this second digestion.
The vast majority of DNA extracts were also incubated with USERTM enzyme mix (NEBâ, 0.235 units/mL) at 37� C for 3 hours in order to
remove uracil residues and thus reduce the impact of nucleotide mis-incorporations due to post-mortem cytosine deamination,
typical of ancient DNA (Briggs et al., 2007).
DNA extracts were subsequently constructed into Blunt-End DNA libraries, following Meyer and Kircher (2010) as modified in
Gamba et al. (2016) (method A) or for a limited number of samples (Cantorella_UE2275x2_4791, ElAcequion_Spain38_4058,
ElAcequion_Spain39_3993, ElsVilars_UE4618_2672), a slightly different procedure (method B) that differed from method A in the
addition of 7-nucleotides-long unique indices within each P5 and P7 adapters prior to ligation to DNA, the sequence of which
was obtained from Rohland et al. (2015). A quantitative real-time Polymerase Chain Reaction (qPCR) was then carried out on 20X
dilution duplicates of each library to determine the required PCR cycle number for amplification. Subsequently, libraries were
amplified for 4-16 cycles (Table S4), following Gamba et al. (2016). Each PCR reaction included 1 unit of AccuPrimeTM Pfx DNA
polymerase, 3 to 6 ml of unpurified DNA library and 1-2 ml of 5 mM custom PCR primers, one of which containing a unique external
6-bp index used for post-sequencing sequence demultiplexing. PCR products were then purified using either Minelute columns
(QIAGEN(C)) or Agencourt AMPure beads, eluted in 25 ml of EB (10 mM Tris-Cl, pH 8.5) supplemented with 0.05% Tween, and quantified on Tapestation 2100/4200 or Bioanalyzer instruments (Agilent technologies). Finally, sequencing was performed at the Danish
National High-Throughput DNA Sequencing Centre, either on Illumina HiSeq2500 for the vast majority of samples (method A),
or the Illumina HiSeq4000 for samples (Cantorella_UE2275x2_4791, ElAcequion_Spain38_4058, ElAcequion_Spain39_3993,
ElsVilars_UE4618_2672) (method B). Sequence trimming, mapping, filtering and base calibration at damaged sites were carried
out following the methodology from Gaunitz et al. (2018).
Multiple independent amplifications carried out for most DNA libraries to limit PCR duplicates, aiming at limiting sequencing costs.
In total, one to seven libraries were generated for each sample selected for whole-genome sequencing, among which the vast majority were USERTM-treated (322/326, representing �98.8%). The list of these indexed libraries with corresponding sequencing effort
and clonality can be found in Table S4.
Radiocarbon dating
Unless indicated otherwise, AMS-radiocarbon dating of the samples was performed at the Keck Carbon Cycle Accelerator Mass
Spectrometry Laboratory, UC Irvine. Bone or tooth pieces between 1.01 g and 2.24 g were sampled in the bone laboratory in the
ancient DNA facilities of the Centre for GeoGenetics and sent for subsequent dating of ultrafiltered collagen. Sample preparation
backgrounds were estimated, and subtracted, based on measurements of 14C-free mammoth and whale bone. Calibration was
carried out using OxCalOnline (Ramsey, 2009) and the IntCal13 calibration curve. Calibrated dates are provided in Table S1.
Collagen yields obtained for the samples Ridala_Rid2_2717, Marvele_01_1117, Saadjarve_Saa1_1117, Dariali_Georgia2_317,
Halvai_KSH4_4017, Halvai_KSH5_2542, were insufficient for radiocarbon dating. Their respective age was, thus, determined based
on their archaeological context.
QUANTIFICATION AND STATISTICAL ANALYSIS
Read alignment, rescaling and trimming
We generated one to seven DNA libraries per sample, the majority of which were built on DNA extracts treated with USERTM enzyme
mix (322/326, �98.8%). This enzyme mix was used to limit the impact of mis-incorporations at deaminated cytosines in downstream
analyses (Briggs et al., 2010). For each library, sequencing reads were parsed through PALEOMIX version 1.1.1 (Schubert et al.,
2014b) with default parameters, except seeding that was disabled. Through this pipeline, reads were trimmed for low quality termini
and known adaptor sequences, then filtered out if shorter than 25 nucleotides, and finally aligned against the horse mitochondrial
(GenBank Accession number NC_001640) (Xu and Arnason, 1994), and the horse nuclear reference sequence (EquCab2) (Wade
et al., 2009) appended for 2,797 Y chromosome contigs (Wallner et al., 2017). AdapterRemoval2 (Schubert et al., 2016) was used
to trim reads and BWA version 0.5-9-r26-dev (Li and Durbin, 2009) to map reads, excluding alignments whose mapping qualities
were inferior to 25. Finally, PCR duplicates were removed and reads were locally realigned around indels using the IndelRealigner
procedure from GATK (McKenna et al., 2010).
The software mapDamage2 (Jónsson et al., 2013) was used to check for the presence of nucleotide mis-incorporation profiles
characteristic of ancient DNA data at the library level, randomly selecting 100,000 reads. We observed the expected increase of
C to T (G to A) mis-incorporation rates at read starts (read ends) for both USERTM-treated and non-USERTM-treated data.
e13 Cell 177, 1419–1435.e1–e22, May 30, 2019
�Furthermore, genomic positions preceding read starts were higher in purines in non-USERTM read alignments, consistently with postmortem DNA fragmentation being depurination-driven. In USERTM-treated read alignments, these positions were enriched in
cytosine residues, in line with the excision of deaminated cytosines by the sequential activities of Uracil DNA glycosylase and Endonuclease VIII enzymes present in the USERTM mix. In order to limit the impact of remnant mis-incorporations in downstream analyses,
we applied the computational procedure combining end trimming and base quality rescaling based on post-mortem DNA damage
profiles, as described in Gaunitz et al. (2018).
Uniparental markers
Mitochondrial DNA
Mitochondrial haplotypes were called following the procedure from Gaunitz et al. (2018), restricting to positions showing at least
3-fold coverage after mapDamage rescaling and trimming, and a minimal base quality score (post-rescaling) of 25. The sequence
data were divided into six independent partitions, including first codon positions (partition 1; 3,802 sites), second codon positions
(partition 2; 3,799 sites), third codon positions (partition 3; 3,799 sites), the control region (partition 4; 961 sites), ribosomal RNAs
(partition 5; 2,555 sites) and transfer RNAs (partition 6; 1,518 sites). We then constructed a dataset including all mitochondrial sequences analyzed by Gaunitz et al. (2018) plus all novel sequences reported in this study (dataset 1, 393 sequences). This dataset
was used for phylogenetic reconstruction in RAxML (Stamatakis, 2014), using, for each partition, the GTRGAMMAI substitution
model. This model was determined following modelgenerator v0.85 under the Bayesian Information Criterion (BIC) (Keane et al.,
2006) as the best implemented in the software for partitions 1, 4, 5, and 6 (the best models implemented in the software for partitions
2 and 3 were GTRINV and GTRGAMMA and were nested within the GTRGAMMAI model). Node support was estimated using 100
bootstrap pseudo-replicates. The best-ML phylogenetic tree reconstructed is provided in Figure 6A.
Y chromosome
Read alignment, rescaling and trimming were carried out following the same methodology as described by Gaunitz et al. (2018). The
Y chromosome haplotype was reconstructed from the high-quality reads aligning against the concatenated Y chromosome contigs
described by Wallner et al. (2017) and three non-repetitive parts of the Y chromosome (GenBank Accession Nb. AC215855.2 and
JX565703), following the filtering criteria presented by Gaunitz et al. (2018), relaxed here to include samples showing at least 25%
of the total number of sites covered in the most-covered individual (Icelandic_0144A_0). This resulted in the selection of a total
number of 139 individuals. In order to ensure orthology, phylogenetic reconstructions on the Y chromosome data were restricted
to the set of contigs present as single copy (i.e. excluding collapsed Copy Number Variants), as identified by Wallner et al. (2017).
Additionally, singletons as well as sites not covered in at least half of the total number of males were disregarded in order to reduce
the impact of sequencing errors and missing information on the reconstruction, respectively. The phylogenetic analyses were
performed using a GTRGAMMA substitution model in RAxML (version 8.2.4) (Stamatakis, 2014). The GTRGAMMA model was the
second best-supported model identified in ModelGenerator v0.85 (Keane et al., 2006) under both Akaike and Bayesian Information
Criteria, and the best of those implemented in RAxML. Figure 6B shows an easy-to-read collapsed version of the tree rooted on the
domestic donkey, which was based on 4,996 variable sites. The overall topology was in agreement with those reported by Gaunitz
et al. (2018) based on a more limited number of samples. Node support was estimated using 100 bootstrap pseudo-replicates.
Autosomal and sex chromosomes
For all datasets considered in subsequent analyses of autosomal and sex chromosomes, we applied the following filters using
ANGSD (Korneliussen et al., 2014):
d
d
d
d
d
d
Minimum base quality: 20 (-minQ 20)
Minimum mapping quality: 25 (-minMapQ 25)
Remove all no primary, duplicated, and unmated reads (-remove_bads 1)
Remove all reads showing multiple hits (-uniqueOnly 1)
Downgrade quality scores around indels (-baq 1)
Adjust mapping qualities in regions with excessive mismatches (-C 50)
We also used ANGSD (Korneliussen et al., 2014) to generate two different datasets based on autosomal sequencing data. The first
dataset (a) consists of pseudo-haploid genomes (hereafter referred to as the pseudo-haploid dataset), generated by random sampling of reads, following the methodology used in Gaunitz et al. (2018). Briefly, from the pileup of reads passing all quality filters, we
sampled a single read at every genomic site for every horse. This dataset contains 160 samples that, prior to read random sampling,
reached a sequencing depth-of-coverage equal to or greater than 1-fold, including E. africanus somaliensis as an outgroup
(Table S5).
The second dataset (b) was prepared following the filtering of nine samples (Berel_BER04_D_2300, Friesian_0296A_0, Garbovat_
Gar3_3574, Berel_BER07_G_2300, Berel_BER12_M_2300, Oktyabrsky_Rus37_830, Saadjarve_Saa1_1117, TachtiPerda_
TP4_3604, Yerqorqan_YER28_2853) showing high overall error rate estimates (noCpG error estimate; ε R 0.0005 errors per site) (Figure S1). In contrast to dataset (a), which was based of pseudo haploid calls, dataset (b) is based on posterior probabilities of
genotypes (‘posterior probability genotype dataset’) of 126 modern and ancient samples with a depth-of-coverage equal to or
Cell 177, 1419–1435.e1–e22, May 30, 2019 e14
�greater than 1-fold. The 126 samples fall within the second domestic clade (DOM2), as defined by both the bootstrapped neighborjoining tree and TreeMix results. Allele frequencies of at least 60 out of the 126 individuals were used as prior (-doMajorMinor 1 -doMaf 1 -beagleProb 1 -doPost 1 -GL 2). This dataset was used to estimate individual heterozygosities, autosomal nucleotide diversity
profiles across cultures and through time (Table S5).
Additionally, we used ANGSD (Korneliussen et al., 2014) to generate pseudo-haploid calls for the two sex chromosomes, conditioning on males with a depth-of-coverage of at least 1-fold. We used these datasets to calculate nucleotide diversity profiles across
cultures and through time. We excluded the nine samples with high overall error rates (noCpG error estimate; ε R 0.0005 per site), to
ensure cross-comparison with the analyses based on dataset (b).
Type-specific and overall error rate estimates
We estimated type-specific and overall error rates following the procedure developed in Orlando et al. (2013), which leverages a test
genome, an outgroup genome (E. africanus somaliensis), and a so-called ‘perfect’ genome (Icelandic_0144A_0). For every genomic
site covered by all three samples, a random allele was sampled from the pile of reads passing the quality scores per individual. This
matrix of counts was then used to estimate the individual error rates. Briefly, the method uses a maximum likelihood approach to
estimate the excess of derived mutations in the test genome, compared to the perfect genome. We estimated the error rates for
all samples included in dataset (a) showing a depth-of-coverage equal to or greater than 1-fold. Three different filtering approaches
were used to estimate the error rates, (i) using all covered genomic sites, (ii) masking CpG dinucleotide sites in the reference genome
(EquCab2.0) (Wade et al., 2009), (iii) forcing observed transitions from procedure (i) to zero prior to estimation of the overall error rate,
in order to recover an error rate based on transversions only. The distribution of error rates in modern and ancient horses following
each of the three filtering approaches is shown in Figure S1A. For every individual in dataset (b), we also estimated type-specific and
overall error rates using the same high-quality genome and outgroup. For every site, we sampled an allele according to its corresponding genotype posterior probabilities as weights. As for dataset (a), we applied the three filters described above. Distributions
of error rates in modern and ancient horses following these filters of dataset (b) are shown in Figure S1B.
Genetic Distance and f3-outgroup statistics
We followed the methodology in Gaunitz et al. (2018) to assess the amount of shared genetic drift between a pair of individuals
using the f3-outgroup statistics (Patterson et al., 2012) in the form f3(X, Y; outgroup), where X, Y represent all possible pairwise
permutations of horses. We used dataset (d), which consists of 160 samples (including ass E. africanus somaliensis as outgroup)
with a sequencing depth-of-coverage equal or higher than 1-fold, and an Upper Palaeolithic individual, Goyet_Vert311_35780
(Table S5). To limit the possible impact of post-mortem DNA damage, we computed pairwise genetic distances on the basis
of nucleotide transversions only (n = 50,757,656) using ngsDist (Vieira et al., 2016) and estimated node support from 100
pseudo-replicate bootstraps. In total, we computed 12,561 f3-outgroup statistics based on those 50,757,656 nucleotide transversion sites (Figure S7A).
Principal Component Analysis (PCA)
Using the same dataset as for the calculation of genetic distances (dataset (a)), we conducted a Principal Component Analysis (PCA).
We excluded the outgroup sample (Somali_0226A_0) and positions that segregated as singletons, which represented a total of
45,944,755 nucleotide transversions. The remaining 4,812,870 were used to conduct a PCA with plink v1.90b4.9 (Figure 5A). The
fraction of the variance explained by the first three components was 11.6%, 10.4%, and 8.2%, respectively.
Genomic consequences of breeding: an increased genetic load
Population genetics predicts that the efficacy of negative selection depends on s x Ne product, where s is the selection
coefficient and Ne the effective population size. This product is often binned into four categories, representing nearly neutral mutations (s x Ne % 1), slightly deleterious (1 < s x Ne % 10), mildly deleterious (10 < s x Ne % 100), and strongly deleterious (s x Ne > 100)
(Kousathanas and Keightley, 2013; Williamson et al., 2014). With Ne recently dropping to ca. 100 reproductive horses (Corbin et al.,
2010; Hall, 2016), some breeds likely carry a substantial number of alleles with s < 0.01, which behave as nearly neutral owing to a
limited efficacy of negative selection (s x Ne = 0.01 3 100 = 1).
Such reduced efficacy of natural selection filtering out deleterious alleles results in an accumulation of harmful mutations (Charlesworth, 2009). Increased genomic load was indeed observed for domestic horses, relative to a limited ancient DNA dataset including
14 Scythian horse genomes dating back to �2.3 kya (Gaunitz et al., 2018; Librado et al., 2017). Leveraging the extensive time-series
generated in this study (dataset (b)), we investigated the precise historical context in which the strong demographic declines resulting
from breeding started to compromise the efficacy of selection, as potentially reflected by a burst in genetic load observed in each
individual genome.
Prior to empirical analyses, however, we first thoroughly evaluated available genomic load estimators. In our previous work, the
preferred estimator was calculated from protein-coding sites, following the procedure detailed in Librado et al. (2017) and Gaunitz
et al. (2018)
P
Pðhomozygous alternativeÞi x PhyloPi
P
LOADðHOMÞ = i = 1
i = 1 PðhomozygousÞi
where P(homozygous_alternative)i is the probability that site i is homozygous for the non-constrained nucleotide variant, as estimated
by ANGSD (Korneliussen et al., 2014). PhyloPi is the evolutionary score for position i, which was used as proxy for the phenotypic
e15 Cell 177, 1419–1435.e1–e22, May 30, 2019
�impact of mutations at this position. PhyloP scores are available at http://hgdownload.cse.ucsc.edu/goldenPath/hg19/
phyloP46way/placentalMammals/ (Pollard et al., 2010). Since the denominator normalizes by the total amount of homozygous positions, calculations account for individual differences in inbreeding. This estimator should thus be interpreted as deleterious load per
homozygous site. We here similarly define the genetic load in heterozygous positions
P
0:5 x PðhetÞi x PhyloPi
LoadðHETÞ = i = 1 P
i = 1 PðhetÞi
We evaluated both statistics conducting forward simulations with SLiM 3.0 (Haller and Messer, 2017). In particular, we let an ancient
population of 50,000 horses to evolve during 100,000 generations, until reaching mutation-selection-drift equilibrium. A hundred generations ago, the ancestral horse population split into three additional subpopulations, with Ne = 100, 200 and 500, respectively. This
range was chosen to mirror recent population sizes estimated for modern horse breeds. Mutation and recombination rates were
assumed to be 7.24x10 9 mutations per generation and site, and 1x10 8 crossovers per generation and site, respectively. Deleterious mutations were supposed to represent 2/3 of the protein coding sites, and were drawn from an exponential distribution with
parameter 0.0001 (average selection coefficient against mutations = 0.0001). Five thousand 5 kb-long fragments were simulated
(25 Mb in total), representing 5,000 protein-coding genes. Five individuals were sampled from each population.
We found that the estimator based on homozygous positions scales well with Ne reductions, for all mutation categories, as
expected (Figures S3A and S3B). Although the heterozygosity dropped by ca. 12% (for Ne = 500), 27% (Ne = 200) and 44%
(Ne = 100), the load per heterozygous position remained steady. Since simulations provided certain genotype calls with null error
rates, a steady heterozygous load cannot reflect methodological challenges associated with calling heterozygous genotypes.
Instead, it suggests that the more random loss or fixation of alleles owing to elevated drift, especially for variants that segregated
as slightly deleterious in the ancient horse population, ultimately increased the levels of homozygous load. Therefore, given the
limited power provided by heterozygous sites, we estimated genetic load from homozygous sites.
We further validated the homozygous load estimator by investigating its relation to the composite s x t parameter, where s is
the selection coefficient against deleterious alleles and t is the number of generations of selection. Inspired by the McDonaldKreitman test (McDonald and Kreitman, 1991), we contrasted two classes of sites. The first class was assumed to be neutral,
and was comprised of protein-coding sites with a phyloP score lower than 1.5. This threshold was shown to best discriminate
zero-fold and four-fold codon sites, the latter of which induces synonymous changes in protein-coding regions, and are often
considered to evolve under almost neutrality (Librado et al., 2017). Besides drift and inbreeding, the second class of sites was
supposed to be also affected by negative selection, and pertained to protein-coding sites with a PhyloP score greater or equal
to than 1.5.
The rationale is that elevated drift, reflected as the loss of heterozygous sites, should result in an equally-balanced increase of both
homozygous genotypes. With purifying selection, however, the deleterious homozygous genotype is often filtered out, resulting in the
preferential inheritance of non-deleterious homozygous genotypes. More specifically, the genotype frequencies were modeled as:
AAs =
AAn
AAn + Aan 3 ð1
t
shÞ + aan 3 ð1
t
sÞ
t
Aas =
Aan 3 ð1 shÞ
AAn + Aan 3 ð1 shÞt + aan 3 ð1
sÞt
aas =
aan 3 ð1 sÞt
AAn + Aan 3 ð1 shÞt + aan 3 ð1
sÞt
where the s or n subindices denote selected and neutral sites respectively. The dominance coefficient is represented by h. This implies that the ratio of homozygous genotypes is:
AAs
AAn
=
aas aan ð1 sÞt
Rearranging
stz
�
�
AAn 3 aas
ln
AAs 3 aan
The s x t parameter was estimated from high-quality modern horse genomes. We also conditioned on sites that segregated as nucleotide transversions in our extensive panel of ancient horses; ie. at the time-scale studied encompassing a few hundred generations,
Cell 177, 1419–1435.e1–e22, May 30, 2019 e16
�the accumulation of deleterious alleles mainly reflects an increased impact of drift (measured as a loss of heterozygous sites), relative
to a presumably-recent relaxation of purifying selection.
Applying this validation method to the selected positions, we found a negative correlation between s x t and genetic load at
homozygous sites (Spearman correlation; r = 0.8736; p-value = 5.2834x10 8; Figure S3C). This confirms that a relaxation of
negative selection (ie. reduction in s x t) drove the load increment observed in modern horse genomes. No relation to the average
depth-of-coverage was found (p-value = 0.7796).
Similarly, we calculated the substitution rate at functional and nearly-neutrally evolving sites. To simplify calculations, we relied on
zero-fold (hereafter, 0d) and four-fold degenerate (4d) codon sites, where nucleotide changes always imply non-synonymous and
synonymous changes, respectively. We conditioned on nucleotide transversions, to mitigate the impact of post-mortem damage
in ancient DNA samples. For each horse in the DOM2, we calculated
dN
dS
where dN is the genetic distance, at 0d sites, between pseudo-haploidized version of a DOM2 and the donkey genome. The principle of this subtraction is analogous to the well-known dN/dS statistics. While dN - dS scores greater than zero reflect the action of
positive selection, values lower than zero reveal evolution under negative selection. The dN - dS values are more robust than the
dN/dS statistics to the presence of undetected sequencing errors, which is typically the case for genomes sequenced at low
coverage. Assuming the error rate is approximately constant in 0d and 4d sites, modeling selective pressure as a subtraction allows
canceling out the impact of errors on dN and dS estimates, in contrast to modeling through dN/dS statistics, where a constant error
rate added to the numerator and denominator could considerable distort the ratio.
Less efficient purifying selection is expected to elevate this dN - dS, owing to non-synonymous deleterious mutations being more
often fixed. Therefore, if individual deleterious loads increased, we should find such ratios to be larger in modern DOM2 horses than in
horses that lived prior to the C19th. This was indeed observed (Figure S3D). The correlation between the dN - dS statistics and the
load estimator was actually significant (Pearson correlation; r = 0.67; p = 0; Figure S3E), despite exploiting considerably different
information to estimate either the selective pressure or the accumulation of deleterious mutations, respectively. All together, these
findings support that the genomic load only increased in the last centuries, following the horse population decline and population
structuration implemented by modern breeding practices.
Individual heterozygosity
We calculated the individual heterozygosity level for all horses within the second domestic clade (DOM2) using dataset (b). DOM2
members were defined based on the TreeMix (Figures 3 and S7B). We summed up the posterior probability of being heterozygous
per site per individual, excluding sites with missing data for each corresponding individual. To reduce the possible bias driven by
misincorporations as a result of deamination in the historic and ancient samples, we conducted a series of analyses, (i) including
all covered positions, (ii) masking all data observations overlapping a CpG in the reference genome, (iii) excluding all transitions (Figures S2A and S2B). We then performed the exact same analyses after subtracting mean error rates per site in order to mitigate the
total contribution of sequencing errors (Figures S2C and S2D).
We next regenerated the dataset of posterior probabilities of genotypes restricting the analysis to individuals with a depth-ofcoverage greater than or equal to 4-fold downsampled to 4-fold to control for the possible effect of depth-of-coverage variation
across samples. Individual heterozygosity levels with and without subtracting mean error rates per site were consistent (drop of
heterozygosity: 18.5% (p value: 2.63x10 14) prior to subtracting errors, and 13.2% (p value: 8.365x10 15) after subtracting errors).
Nucleotide diversity (p) profiles across cultures
We computed the nucleotide diversity (p) of a set of predefined cultures in dataset (b), provided the number of samples is equal to or
greater than three (Table S5). We estimated p for the autosomes, the Y chromosome, and the mitochondrial DNA. We used three
different approaches to compute p, depending on the ploidy and depth-of-coverage. For autosomes, we extracted the individuals
related to each culture from the ‘posterior probabilities of genotypes’ dataset as:
p=
2pð1 pÞn
n 1
where p is the ancestral allele frequency segregating within the samples of this culture, and n the corresponding sample size. For the
Y chromosome, we computed the Site Frequency Spectrum (SFS) from pseudo haploid genomes for all males per culture (N_males
R 3) and computed p from the SFS using an in-house script, following Librado et al. (2017). Finally, p per culture of the mitochondrial
DNA was computed from multiple sequence alignment of haplotypes. To reduce DNA damage related biases for ancient samples, we
excluded genomic sites in CpG dinucleotides context for both the autosomes and Y chromosome.
Nucleotide diversity (p) profiles through time
In addition to calculating p for a set of a priori defined cultures, we computed p through time, following the same approaches as
described in section ‘Nucleotide diversity (p) profiles across cultures’, except that datasets were stratified according to the age of
the individuals instead of culture. Samples younger than 400 years were represented within a single group, and from 400 years
ago to the oldest sample in the second domestic clade, we grouped samples using a step size of 250 years. Groups with fewer
than 3 stallions were excluded from the calculations. To reduce the possible bias introduced by different geographic substructure
e17 Cell 177, 1419–1435.e1–e22, May 30, 2019
�across the temporal windows, we estimated p in Asia and Europe separately (Table S5). As an additional caution, we computed p
using the same set of stallions for the autosomes and Y chromosome in each time window. To minimize the impact of damage related
biases, present in ancient samples, we excluded genomic sites in CpG dinucleotides for the autosomes and Y chromosome. Lastly,
following Wutke et al. (2018), we also stratified the samples in the Asian clade into four time windows (0-400, 400-900, 900-2200,
2200-5000 years ago) and computed p for the autosomes and Y chromosome (Figure S2E). We applied the same filters as for the
time slicing described above.
Selection targets
Populations Branch Statistic (PBS)
We applied the population branch statistics (PBS) (Yi et al., 2010) to a subset of cultures in the DOM2 domestic clade. PBS can
identify genomic regions that underwent recent natural selection by comparing allele frequency changes between two sister populations and an outgroup population. We investigated selection targets in Byzantine horses, representative of Persian-related lines, in
comparison to Gallo-Roman (representing European horses prior to pre-Islamic conquests) and Deer Stone (Asian horses prior to
pre-Islamic conquests) horses.
First, using mstatspop v.0.1beta (20180220) (available at https://codeload.github.com/CRAGENOMICA/mstatspop/zip/master),
we calculated the fixation index (FST) between pairs of cultures in 50 kb genomic windows with a step size of 10kb, and transformed
these into drift units -log(1-FST). Using the computed drift units, we then calculated the population branch statistics following the
methodology in Yi et al. (2010). We excluded genomic windows with more than 25% missing sites as well as regions showing an
excess of the transition/transversion (ti/tv) ratio. The upper boundary, delineating this ti/tv excess, was estimated from the distribution
of ti/tv ratios across genomic windows. In particular, windows with a ti/tv greater than the mode of the distribution, plus the distance
from the mode to the lowest ratio, were excluded. This was done to minimize the number of false positives due to post-mortem
deaminations, which are reflected as nucleotide transitions. From the remaining windows, we selected the top-1,000 genomic
windows according to their higher PBS score, as candidate regions for positive selection on each given branch/population. We
confirmed that this arbitrarily-high threshold was conservative by estimating the distribution of (nearly-)neutral PBS scores from
two categories of sites: (1) intergenic sites (defined as located at least 5kb from the closest gene annotation) and (2) fourfold-degenerate sites within annotated protein coding regions. Two null distributions of PBS scores under (nearly-)neutral evolution were
generated by performing 5,000 bootstrap pseudo-replicates, which consisted of random sampling with replacement 50k sites pertaining to both categories (Figure S4). We found, for all three branches, that the highest PBS score for neutral evolving sites was
smaller than the lowest identified PBS score among the top-1,000 genomic windows. This indicates that the significance threshold
that we selected is conservative, and that the top-1,000 genomic windows provide genuine candidate regions for positive selection.
The same was true when considering the top-2,000 genomic windows.
Genes whose protein-coding exons overlapped the top-1,000 or top-2000 PBS windows (Table S6) were submitted to functional
enrichment analyses (Table S7), provided that they have a 1:1 ortholog relationship (single-copy genes) to human or mouse genes.
Orthology was defined according to annotations in Ensembl Genes 92. Human and mouse orthologs were analyzed for functional
enrichment, using the WebGestaltR script, on the following functional databases hosted by WebGestalt 2017 (Wang et al., 2017):
geneontology_Biological_Process_noRedundant, geneontology_Cellular_Component_noRedundant, geneontology_Molecular_
Function_noRedundant, pathway_KEGG, pathway_Panther, pathway_Reactome, pathway_Wikipathway, disease_Disgenet,
disease_GLAD4U, phenotype_Human_Phenotype_Ontology. Only functional categories significantly enriched, according to their
adjusted p-value < 0.05 (Benjamini and Hochberg, 1995), are reported in Table S7.
Mendelian traits
We investigated 57 SNPs associated with key phenotypic traits, including coat-color variation, genetic disorders, body size configuration, as well as racing and locomotion skills. We explored their origin and evolution across past equestrian civilizations.
We followed the same approach as in Librado et al. (2017) to chart the frequency of the causative allele in all 159 horses comprising
dataset (b). Causative alleles supported by a single read were conservatively considered as absent (Figure S5). A few alleles were not
detected in ancient horses, but only identified in modern domesticates, including in PDK4 and PON1, improving racing capabilities.
The DMRT3 allele, causing ambling gaits, was first identified in a heterozygous horse dating back 730 years ago (TavanTolgoi_
GEP13_73), from the Great Mongolian Empire.
We next estimated allele trajectories over time, for the 57 SNPs, using a sliding window approach (step = 250 years, span =
1,000 years). For each horse within each time bin, we randomly sampled a single read, provided it passes all quality filters. This
enabled us to calculate allele frequencies without genotype uncertainties. This process was repeated 100 times to approximate
the sampling variance. The mean over the 100 replicates was plotted, with the shaded area representing twice the standard deviation, which approximately delimits the 95% confidence interval around the mean (Figures 4B and S6).
TreeMix population tree
We created an extended dataset (c) where specimens were grouped mainly by culture, as shown in Table S5. This dataset consisted
of some individuals present in dataset (a) plus a number of other specimens for which genome-scale data could be generated,
providing a minimum of 2-fold genome coverage per group considered. In total, dataset (c) included 186 horses and an outgroup.
Intra-group allele counts (eg. within cultures) were calculated supplying the–within command to plink v1.90b4.9 (Purcell et al.,
Cell 177, 1419–1435.e1–e22, May 30, 2019 e18
�2007). The resulting output was subsequently transformed into TreeMix input format using the plink2treemix.py script delivered
within the TreeMix package. Sites not covered in all groups were disregarded, yielding a total of 16,829,417 nucleotide transversions.
TreeMix v1.13 (Pickrell and Pritchard, 2012) was run applying the same parameters as in Gaunitz et al. (2018), with a number of
migration edges ranging from 0 to 10. The outgroup was forced to be placed in-between the wild ass and horses. The variance explained by each migration model ranges from 0.9989676 (0 migration edge) to 0.9989983 (10 migration edges), thus indicating a
limited improvement for an increasing number of migration edges. For illustrative purposes, the tree with one migration edge was
visualized using the R APE package (Paradis et al., 2004).
Struct-f4
The D (Green et al., 2010) and related f (Patterson et al., 2012) statistics have been proven as useful tools to unravel dynamic population structures in the last millennia, including to track introgression from extinct lineages. Methods exploiting f4 statistics have
been already implemented, in ADMIXTOOLS and the more recent admixturegraph packages (Patterson et al., 2012). These two
package implementations often require proposing a model to be fit to all f4 permutations. Proposed models should be based on prior
knowledge, in the form of potential hypotheses that can be subsequently contrasted. Owing to reduced sample sizes, prior knowledge can be however limited or even biased.
Leveraging permutations of the f4 statistics (Patterson et al., 2012), we here present an additional approach to infer fine-scale population affinities, in the form of 3D visual embedding, which is complementary to existing methods. These will be included in the
Struct-f4 package, available upon request.
The first step in the Struct-f4 pipeline is an efficient C implementation to rapidly calculate millions of f4 permutations from a TreeMix
or PLINK file in tped format. The output provides BABA and ABBA counts, alongside with f4 values, standard errors and Z-scores.
The second program performs 3D visual embedding. More specifically, the f4 statistics is formally defined as:
f4ðA; B; C; OÞ = ðpA
pB ÞðpC
pD Þ
where pA, pB, pC and pO represent the allele frequencies in individuals/populations A, B, C and the outgroup, respectively. The term
(pA – pB) is then the change in allele frequency between individuals A and B. As drift path between two populations, it can be visualized
as a Euclidean distance:
qffiffiffiffiffiffiffiffiffiffiffiffiffiffiffiffiffiffiffiffiffiffiffiffiffiffiffiffiffiffiffiffiffiffiffiffiffiffiffiffiffiffiffiffiffiffiffiffiffiffiffiffiffiffiffiffiffiffiffiffiffiffiffiffiffiffiffiffiffiffiffiffi
dðpA ; pB Þ = ðxA xB Þ2 + ðyA yB Þ2 + ðzA zB Þ2
where xA, yA and zA are the x, y and z geometrical coordinates for individual A. Struct-f4 searches for the x, y and z coordinates that
minimize the difference between the observed f4 values and those predicted from the 3D geometrical embedding. Higher dimensionality can be also considered.
Struct-f4 currently implements a cost function based on weighted least-squares:
argmin
½dðpA ; pB ÞdðpC ; pO Þ
s2
f4ðA; B; C; OÞ
2
The s in denominator stands for the standard deviation of the corresponding f4 estimate, so that f4 values estimated with large variances contribute less to the overall cost function. This correction enables to include samples sequenced at very depth-of-coverage.
They are implemented in the R programming language, and C++ for intensive calculations.
Struct-f4 minimizes the cost function in two steps. First, f4_2_3D runs the SANN algorithm, as implemented in the optim R function,
for 100,000 MCMC iterations. This provides a sub-optimal approximation to the global maximum. This is followed by ML refinement
through the L-BGFS-B algorithm, with stringent convergence criteria (maxit = 50000, factr = 1e1). Figure 5B provides a visualization of
Struct-f4.
Modeling IBE contribution to DOM2
We used momi2 (Kamm et al., 2018) to model the population history underlying the main horse lineages characterized, as well as to
further assess the possible contribution of IBE to DOM2. Momi2 leverages the multidimensional Site Frequency Spectrum (SFS) to
identify the best population model among a pre-defined set, characterized by a series of demographic changes, split and admixture
events. We first sub-selected modern horses to represent the DOM2 and Przewalski’s horse lineages.
(DOM2: FMontagnes_0065A, Hanoverian_0235A, Marwari_0239A, Shet_0249A_SPH020, Shetland_0250A, Icelandic_0144A,
Mongolian_0153A and Mongolian_0215A and Przewalski’s horses: Przewalski_0150A, Przewalski_0160A, Przewalski_0159A, Przewalski_0158A, Przewalski_0157A and Przewalski_0151A).
The other lineages considered were represented by one high-coverage sample for E. lensensis (Taymyr_CGG10022_42758) and
two ancient specimens sequenced to lower coverage for IBE (Cantorella_UE2275x2_4791 and CaminoDeLasYeseras_CdY2_4678).
We prioritized high-coverage modern genomes whenever possible to perform strict genotype calling and avoid inflating split times
and population size estimates, owing to post-mortem damage and sequencing errors.
e19 Cell 177, 1419–1435.e1–e22, May 30, 2019
�The coverage and age for the sample considered are provided in Tables S2 and S3. The donkey genome was used as outgroup to
polarize alleles as ancestral or derived. Sites uncovered or heterozygous in the donkey genome were thus skipped.
To estimate the 4D-SFS, we applied all filters described in section ‘Autosomal and sex chromosomes’ to calculate the genotype
probabilities with ANGSD (Korneliussen et al., 2014). Based on these probabilities, we called the most likely genotype. We restricted
to sites covered at least in all non-IBE samples, provided they did not exceed the depth-of-coverage threshold reported by the
PALEOMIX depths file and consisting to the 99.5% quantile of the per site depth-of-coverage distribution. This intended to eliminate
regions which may represent undetected CNVs and erroneously inflate local heterozygosity estimates. We also removed heterozygous sites where the alternative allele is supported by a reduced number of reads, such as sites with a heterozygous allele balance
lower or equal than 15%. For instance: in cases where the sequencing depth was eight-fold and only one read supported the alternative allele, this site was skipped as potentially resulting from a sequencing error.
The sequencing depth of the two IBE samples was not sufficiently high to perform accurate genotype calling (< 3.68x). Based on
the new strategy proposed by Consensify (Barlow et al., 2018), we devised a random-sampling approach that limits the impact of
sequencing errors in the calculation of 4D-SFS. Sequencing errors are indeed often reflected as singletons and introduce long terminal branches in the genealogy. This may lead to overestimating both population sizes and split times. Our strategy consisted of
randomly sampling three, four and five reads per site and sample. If three out of these three randomly sampled sets agreed, the allele
determined by these reads was called. Otherwise, the site was set as missing. This strategy seeks for removing errors solely represented by one or two reads, which are usually incorporated into the data frame when sampling a single read per site. This error-aware
sampling strategy is feasible for these two samples because their average sequencing depth is not extremely low, but > 2.45x, warranting a sufficient number of sites covered three, four or five times. A pseudo-diploid IBE individual was reconstructed merging the
two IBE samples that were pseudo-haploidized.
After filtering, we retained a total of 1,228,613,653 sites. Of these, 2,183,704 correspond to nucleotide transversions and were used
to build the 4D-SFS. For momi2, the transversion mutation rate was fixed to be 2.3728x10 9 transversions per site and generation,
following previous work (Orlando et al., 2013). We then used momi2 to contrast the fit of five evolutionary scenarios to the 4D-SFS.
These models are presented below:
d
d
d
d
d
d
Model A consisted of the topology in the form (IBE, (E. lenensis, (Przewalski, DOM2))), disregarding admixture. Each branch in
the population tree was allowed to have a different population size, except for the DOM2 demographic trajectories prior to
33,930 years ago, which was fixed according to the PSMC profiles reconstructed by Librado et al. (2015).
Model B1 was equivalent to Model A, except that an introgression event from DOM2 into IBE, constrained to occur after the split
between the Przewalski’s horse and DOM2 lineage.
Model B2 was equivalent to Model B1, except that the directionality of the introgression event was reversed, from IBE
into DOM2.
Model C1 consisted of the topology in the form (Ghost, (E. lenensis, (Przewalski, (IBE, DOM2)))), with gene flow from the early
diverging Ghost population into IBE, as suggested by TreeMix (Figure S7B).
Model C2 consisted of the topology in the form (IBE,(E. lenensis,(Przewalski, DOM2)))), with three gene flow events: (i) from IBE
to DOM2; (ii) from IBE to the branch ancestral to (E. lenensis, (Przewalski, DOM2)) and (iii) from DOM2 to Przewalski’s horses.
Model C3 was the same as C2, except that an additional introgression event was introduced from the branch ancestral to
DOM2-Przewalski split into the IBE lineage.
Model A consistently recovers population trajectories previously published
To avoid issues related to local minima during likelihood optimization, models were initialized with reasonable starting guesses
(from previous work), as well as with three sets of random values. The most likely replicate was selected for each model, albeit
only limited likelihood variation was observed across replicates. Model A reported a likelihood of 9345832.7844 and a
Kullback-Leibler divergence (KLdivergence) between the predicted and observed 4D-SFS of 0.05214. Under this model,
the split time between the DOM2 and Przewalski’s horse lineages was estimated to have occurred 45,775 ya, whereas the
divergence of both E. lenensis and IBE lineages were 181,248 and 222,152 ya respectively. The estimated population sizes
were Ne = 30,985 (DOM2), 7,360 (Przewalski’s horses), 64,709 (E. lenensis) and 14,899 (IBE). These estimates are in line
with previous work (Orlando et al., 2013) and mirror the well-documented demographic collapse in the Przewalski’s horse
population (Der Sarkissian et al., 2015). These Ne also support population decay in IBE horses, possibly owing to partial isolation within Iberia, an area that could have served as horse refugium during the last glacial maximum (Warmuth et al., 2011).
That the split times of E. lenensis and IBE are separated by only 40 kya with high Ne implies reduced drift at the time of divergence and is consistent with their relative positioning on the PCA versus struct-f4 plots (i.e., IBE is closer to E. lenensis in the
latter as this method is less sensitive to drift post-divergence; the PCA places IBE farther away from all other lineages due to
recent population collapses).
Limited but significant introgression from IBE into DOM2
Model B1 marginally improved the likelihood to 9345720.5512, as well as the KLdivergence (0.05209) over model A. Yet, the
improvement detected was lower than that observed for Model B2 (likelihood: 9345653.5967; KLdivergence: 0.05206), suggesting
that introgression preferentially occurred from IBE to DOM2, rather than in the reverse direction. Model B2 estimated gene flow from
Cell 177, 1419–1435.e1–e22, May 30, 2019 e20
�IBE to DOM2 to be �0.4%, and to have occurred 8,483 ya. We caution that the estimated date for introgression is likely imprecise, as
the amount of the underlying gene-flow is extremely limited and thus barely impacts likelihood values.
To further validate the directionality of gene flow, we polarized shared variants as ancestral (A) and derived (D), in order
to efficiently exploit diagnostic allele configurations. We assumed the topology (((((DOM2, Dunaujvaros_Duk2_4077),
Botai),E. lenensis),IBE),DONKEY). Note Dunaujvaros_Duk2_4077 was not included in the momi2 analyses due to its low sequencing
depth, but incorporated due to its greater affinities to IBE (Figure 7). Assuming an infinite-sites model (one mutation per site, at most),
there is only one scenario whereby IBE and DOM2 (or Dunaujvaros_Duk2_4077) could share ancestral alleles, yielding ADDDAA
(DADDAA) patterns. This scenario involves derived mutations happening in the lineage immediately ancestral to E. lenensis, and
the ancestral allele re-appearing into Duk2 through introgression from IBE.
Leveraging the panel of nucleotide transversions built for TreeMix and with Sintashta_NB46_4023 as representative of DOM2, we
contrasted the amount of DADDAA versus ADDDAA patterns. We indeed found an excess of DADDAA (2,722 versus 1,817), revealing
increased affinities between IBE and Dunaujvaros_Duk2_4077, relative to DOM2, consistent with Figure 7. The absolute difference is
small, but revealed significant through 100 bootstrap pseudo-replicates (p-value < 0.01). This supports gene flow directionality from
IBE to Dunaujvaros_Duk2_4077.
Detecting the presence of a ghost lineage
That IBE introgressed into Dunaujvaros_Duk2_4077 does not support TreeMix inference assuming one migration pulse. Under this
TreeMix tree, IBE and Dunaujvaros_Duk2_4077 are placed as sister taxa, with input from a divergent unsampled (ghost) population
into IBE (Figure S7B). Using momi2, we evaluated such topology (Model C1), but found no likelihood improvement ( 9351206.7300).
More importantly, under this model, all the IBE ancestry was inferred to derive from the ghost population, suggesting that IBE should
actually occupy the position of the ghost population, and thus that IBE is basal to all caballine lineages investigated here.
Yet, IBE shows an extremely divergent Y chromosome (Figure 6B). Based on the observed versus expected pairwise genetic distances as proxies for the residuals of the model fit, we propose an alternative explanation. This involves two additional admixture
events (Model C2). The first consists of gene flow from DOM2 to Przewalski’s horses, while the second from IBE to the ancestor
of all remaining caballine horses. Implementing Model C2 substantially improved KLdivergence and likelihood values, to 0.01899
and 9273440.1542, respectively. Optimizing Model C2 parameters estimated that DOM2 branched off from Przewalski’s 43.8
kya, and from E. lensensis 118.6 kya. Both such estimates are more in line with previous results based on F-statistics (Orlando
et al., 2013). This model also indicates that DOM2 contributed 22% to the ancestor of Przewalski’s horses ca. 9.47 kya, suggesting
the Holocene optimum, rather than the Eneolithic Botai culture (�5.5 kya), as a period of population contact. This pre-Botai introgression could explain the Y chromosome topology, where Botai horses were reported to carry two different segregating haplogroups:
one occupied a basal position in the phylogeny while the other was closely related to DOM2 (Figure 6B). Multiple admixture pulses,
however, are known to have occurred along the divergence of DOM2 and the Botai-Borly4 lineage, including 2.3% post-Borly4
contribution to DOM2, and a more recent 6.8% DOM2 intogression into Przewalski’s horses (Gaunitz et al., 2018). Model C2 parameters accommodate all these as a single admixture pulse, likely averaging the contributions of all these multiple events.
More surprisingly, IBE was inferred to have massively contributed to the ancestor of all caballine horses, 285.3 kya with 98.8% of its
genetic ancestry. The split time between IBE and the rest of caballine horses is then pushed back 1.25 mya, which could be compatible with the very divergent Y haplogroup carried by IBE stallions. This 98.8% should be interpreted as if most of the IBE-DOM2
genomic regions coalesced 285.3 kya, while a 1.2% originated from an even more divergent population. The massive improvement
driven by this admixture event strongly supports the existence of a divergent ghost population, which could have participated to the
genetic makeup of the caballine horses investigated here.
We caution however that the exact split time of 1.25 mya might vary depending on the existence of other unsampled populations.
For example, the f4 permutations involving Goyet_Vert_311 revealed that it likely represents a different lineage, with close affinities to
both IBE and DOM2 at the same time. Although its low sequencing depth precludes its inclusion in momi2 analyses, its 35 kya radiocarbon date suggests it could descend from a population ancestral to the Przewalski-DOM2 split. More specifically, comparison of
the observed versus predicted genetic distances (residuals) of Model C2 indicated that both Przewalski and DOM2 horses should be
modeled as closer to IBE. We incorporated thus another admixture pulse in Model C3, from the branch ancestral DOM2 and Przewalski’s horses to IBE. We found again significant improvement, with KLdivergence and likelihood values of 0.01738 and
9269933.1010, respectively. Model C3 predicts a 36.7% contribution into IBE, 65.2 kya. The split between IBE and all remaining
horse lineages is then reduced to 539.1 kya, more in line with the scale of the Y chromosome tree. The Ne of Przewalski’s and
IBE horses decreased, to ca. 3,798 and 8,848 reproductive individuals, respectively. Importantly, Model C3 is consistent with other
models investigated, inferring an IBE to DOM2 introgression of only 1.4%.
Analytical predictions corroborate limited IBE contribution into DOM2
We next analytically estimated whether the admixture proportions estimated from the fG parameter (Figure 7A) represent reasonable
estimates of the possible genetic contribution of IBE into the DOM2 lineage. The following derivations assume three well-established
constraints:
d
According to the long internal branch leading to the IBE population in TreeMix inference (not shown for illustrative purposes), as
well as momi2 parameters for Model C3, it is likely that IBE experienced a population decay. Its Ne population size was 8,848
e21 Cell 177, 1419–1435.e1–e22, May 30, 2019
�d
d
horses, which is slightly larger than the value retrieved for Przewalski’s horses, but considerably smaller than those leading to
both the E. lenensis and DOM2 lineages.
Under Model C3, the split time of E. lenensis was estimated to be �112.7 kya, in line with previous work (Orlando et al., 2013).
With a generation time of 8 years, this means that IBE diverged at approximately 15,000 generations ago (kga).
As shown in Figure 7B, the introgression from IBE to DOM2 should have occurred after the split of Przewalski and DOM2, some
35.4 kya (�4.425 kga).
Given the distance between the early IBE split and its late contribution to DOM2, we here demonstrate that an admixture fraction
greater than 15% is highly incompatible with the f4 values reported in Figure 7B, ranging from 0.00018 for Dunaujvaros_Duk2_4077
to 2.68933 5 for Jeju_0275A. Durand and colleagues analytically showed that the expected number of ABBA-BABA events, in a
(O,(P3,(P2,P1))) configuration, can be expressed in terms of explicit coalescent parameters (Durand et al., 2011). Respecting their notation (the sign of f4 is reverted because we calculated BABA-ABBA):
f4 =
ABBA BABA 3fdðN + tp3 tGf
=
#SNPs
#SNPs
tÞ
Isolating the admixture fraction (f)
f=
#SNPs � f4
3dðN + tp3 tGf
tÞ
where d is the probability of pairwise coalescence within P3. The denominator includes (i) N as the size of the population ancestral to
P1, P2 and P3; (ii) tp3 the split time of P3, (iii) tGf the time of admixture between P3 and P2, (iv) and t is the expected time of coalescence
within P3, given that both lineages indeed coalesced within P3. Assuming a constant N3 population size within P3:
�ðtp3 tGfÞ
�
1
d=1
1
N3
and
t=
Ptp3
t
t = tGf N3
�
1
d
1
N3
�ðt
tGfÞ
Our three constraints imply that tGf < 5.6 kga, tp3 > 10k and N3 < < N. Indeed, while momi2 infers an N3 of 8,848 IBE horses, the PSMC
reconstructions 200-100 kya indicate that the horse population exceeded N = 100,000 horses (Librado et al., 2015). Based on this, we
evaluated different realistic ranges for N (100-200k reproductive horses) and N3 (5-50k), tp3 (10-62.5 kga) and tGf (0.5-6.2 kga). Within
such parametric space, a f4 = 0.0001 (Figure 7B) is compatible with very small admixture proportions. The maximum possible
admixture fraction is �12%, and is obtained under the less realistic values of N = 100,000, N3 = 45,000, tp3 = 10,000 ga
(80,000 ya) and tGf = 6,000 ga (48,000 ya). For other parameter combinations, the predicted admixture fraction is �1%–2%, in
line with the limited fraction modeled in Model C3. Coupled with such constraints, therefore, the small f4 values in Figure 7B corroborate that IBE contributed to DOM2, but cannot represent the major genetic pool leading to the makeup of modern domesticates.
Species and sex identification
Preliminary sequence data obtained while screening the DNA libraries, typically considering 1-5 million sequencing reads, were
processed with the Zonkey package, as part of PALEOMIX (https://github.com/MikkelSchubert/paleomix) (Schubert et al., 2017)
in order to identify first-generation equine hybrids and determine the molecular sex of each individual. Among the 278 individuals
included in this study, we detected three hemiones, three asses, 27 mules, 245 pure horses. We also identified 196 males (representing �70.5% of all individuals) and 82 females (�29.5%). Additionally, among pure horses, we identified 175 stallions and 70 mares.
DATA AVAILABILITY
Sequencing data aligned against the horse reference genome EquCab2.0 (Wade et al., 2009) can be found on the European Nucleotide Archive, ENA: PRJEB31613.
Cell 177, 1419–1435.e1–e22, May 30, 2019 e22
�Supplemental Figures
A
B
All sites
All sites
40
40
30
20
20
10
0
0
All sites except CpGs
40
Ancient
horses
Modern
horses
20
Counts of samples
Counts of samples
All sites except CpGs
40
30
20
10
0
0
Tranversions only
Tranversions only
40
40
30
20
20
10
0
0
0
0.0004
0.0008
Error rates per site
0.0012
0
0.00025
0.00050
0.00075
Error rates per site
Figure S1. Distribution of Error Rates in Modern and Ancient Horses following Three Filtering Approaches, Related to Figure 2
(A) Histogram of overall error rate estimates for samples in dataset (a) (n = 159), based on random sampling of a single allele per site. All horses were grouped into
modern (turquoise) or ancient horses (red). Three approaches were used to estimate the individual error rates, ‘‘All sites’’ makes use of all sites for which
sequencing data was present, ‘‘All sites except CpG’s’’ masks data in CpG contexts according to the reference genome, and finally, ‘‘Transversions Only’’
excludes all sites observed as transitions. The vertical line represents the maximal allowed error rate (0.0005) cut off for analyses including ‘‘All sites
except CpGs.’’
(B) Histogram of overall error rate estimates for samples in the DOM2 clade (dataset (b), n = 126), with the same filtering procedure as in (A), but based on posterior
genotype probabilities.
�A
B
All covered sites
All
Allcovered
coveredsites
sites
no CpG dinucleotides
Transversions only
0.003
0.002
0.003
0.001
mean error rate
per site
no CpG dinucleotides
0.0001-0.0002
0.0002-0.0003
0.0003-0.0004
0.0004-0.0005
0.0005-0.0006
0.0010
Heterozygosity
Heterozygosity
0-0.0001
0.0015
0.002
0.0006-0.0007
0.0007-0.0008
0.0008-0.0009
Transversions only
0.0009-0.001
0.0007
0.001
0.0006
0.0005
0.0004
0
1,000
2,000
3,000
Ancient Modern Ancient Modern Ancient Modern
4,000
Time (years ago)
C
D
All covered sites
All covered sites
no CpG dinucleotides
Transversions only
0.0025
0.0020
0.0015
0.0010
0.002
Heterozygosity
Heterozygosity
nono
CpG
dinucleotides
CpG
dinucleotides
0.0014
0.0012
0.0010
0.0008
Transversions
Transversions
only
only
0.001
0.0006
0.0005
0.0004
0
1,000
2,000
3,000
Ancient Modern Ancient Modern Ancient Modern
4,000
Time (years ago)
E
Autosomes
Y chromosome
Number of samples
per time window
0.00130
10
15
20
0.00120
25
0.00115
Nucleotide diversity
Nucleotide diversity
5
0.00125
0.0002
0.0001
0.00110
0
1,000
2,000
3,000
Time (years ago)
4,000
5,000
0
1,000
2,000
3,000
4,000
5,000
Time (years ago)
(legend on next page)
�Figure S2. Individual Heterozygosity Levels Estimated through Time for the 126 Horses in Dataset (b), Related to Figure 2
Heterozygosity levels were computed by summing the posterior probability of carrying a heterozygote per site and individual. Sites with missing data were
disregarded at the individual level.
(A) Individual heterozygosity levels. Color coding refers to the overall error rate per site using the corresponding filters, see section ‘Individual heterozygosity’ The
top panel shows individual heterozygosity over time, using all covered genomic sites, masking CpG dinucleotide sites according the reference (middle panel), and
excluding transitions (bottom panel).
(B) Distributions of the individual heterozygosity levels. Violin plots with integrated boxplots were traced in R and grouped into modern (0-400 years ago) and
ancient (R400 years ago).
(C) Individual error-corrected heterozygosity levels. Same as (A) but individual heterozygosity levels were corrected by subtracting the error rate per site. Panels
represent the same filtering approaches as in (A).
(D) Distributions of the individual error-corrected heterozygosity levels.
(E) Autosomal and Y chromosome nucleotide diversity p estimates through time. We stratified the samples in the Asian clade into four different time windows
(0-400, 400-900, 900-2200, 2200- 500 years ago) following (Wutke et al., 2018). Heterozygosity was calculated for the ‘‘All except CpG sites’’ dataset.
�A
7.5x10⁻⁸
Homozygous load
5.0x10⁻⁸
0
2.5 x10⁻⁸
B
0
0.00015
Heterozygous load
0.00010
0.00005
D
dN - dS
−0.006
−0.007
P100.I1
P100.I1
av Han
yW ov
arm eria
Sh bloon_02
etl d_ 35
a
IceYaku nd_0269A_0
l_0 tian 024 A_
14 _0 9A 0
4A 1
_
S J _P 63A 0
Du hetl eju_ 578 _0
elm and 027 2_
0
Araener__0255A_0
Th M bia 02 0A
oro org n_ 38 _0
0 A
u
M gh an 23 _0
FM ong bred_0097A_0
on olia _02 6A
tag n_ 90 _0
0
n
A
Y
1
Co aku es_ 53 _0
nn tia 00 A_
e n 6
0
Mamara_0175A_
0
Q rwa _00 1A_
Iceuarteri_0204A_0
StaMon landicr_0039A_0
nd golia _0 73A 0
ard n 24 _0
_
7
b
Th
oro Sorrred_0215A_0
ug a 00 A_
Tu
me Y hbreia_0 81A 0
s ak d 23 _0
Witki_C utian_0146A_
G
0
WitterP G1 _0175A_
la 0
0
WitterP ce_ 139 0A_
7 0
la
WitterP ce_UK1 _19
Be terPlace_UK16_212
au la U 5_ 7
Be Bea vais ce_UK18 217
lgh uva _G K1 _2
eis is_ VA 7_ 67
_
G 1 2
Ta NoyTrBW VA322_467
v
Ta anToon_GBX175_417
v
Ta anTolgoi_ VA116_467
va lg G 23 85
nT oi_ EP _7
olg G 21 1
7
E
Maoi_G P14_730
Zh
rve EP _7
an
M
atu arv le_ 13 30
rm e 21 _73
u le _ 0
Ye Mas_Iss_01_1087
nik rv yk 11
a e
1 3
Otepi_Tle_3 _11 8
pa ur1 2_1 43
4
a
1
Gre
_ 5 4
go M Nus Ote2_11 4
Bo revk arve tar_ _1156
zA a
le 5_ 84
Bo dyr_4_PA _18 118
Kh Y zAd KY VH2_11 7
oto en yr_ RH _1 89
nt_ ika KY 10 19
R _ 2
U p
Ye CIEi_Tur1H8_1267
nik 20 4 12
ap 12 0_ 67
Ye Ma i_Tur1x85_1289
n in
Ye ikap z_M 94_1291
n
Ye ikapi_Tur1zr1_1360
n
Ye ikapi_Tur142_1373
n
Ye ikapi_Tur141_1396
n
Ye ikapi_Tur176_1430
n
Ye ikapi_Tur181_1443
n
Ye ikapi_Tur175_1443
n
Ye ikapi_Tur170_1443
n
Ye ikapi_Tur273_1443
nik i_T 4 14
Sh Yen api_ ur1 3_1 43
arI ika Tu 50 44
Qu pi_ r2 _1 3
Sh Yen mis_ Tur129_1443
arI ika AM 93 44
Q p
_ 3
Ye umisi_Tur1115_1443
n
1
_
Bo ikap AM 71_ 557
Ye ves_i_Tur1181_1689
n
Ma ikap GVA 72_1694
Au
gu Ev con_i_Tur1191_1695
sta reu G
1
Fra
Ra x_ VA246_1717
nk
G
u
furt Ev ric VA 01_ 73
Fm Hed reux a_JG133 1760
on de _G 16 _18 7
tau rnh VA 0_ 17
Ch ban eim 140 181
_ _ _ 7
Chartre GVA Fr1 181
_1 7
s
a
1
_
rt
Ch re GV 26 86
_ 3
Chartres_GVA36 187
a s_ A _1 2
C rtre GV 26_ 917
Chhartres_GVA56 191
art s_ A8 _19 7
re G 1_ 1
Go Has_GVVA4 1917
_ 7
GolMod unsteA43 191
_ 7
GolModII_M tten 191
o _
GolModII_M n28 1977
o _ 9
GolModII_M n24 198
o _ 8
GolModII_M n26 199
Ac lModII_Mon23_1993
ti
Ac parc II_Mon2 _20 9
Sa tipa _G on27_2007
in rc VA 5 1
Ac tJus _GV 307_2011
tip t_ A _ 1
Be arc_GVA124_2127
Berel_BGVA242_2143
Berel_BER1 311_2250
0
Berel_BER0 _K_2253
1
re
Be l_BER0 _A_2300
re E 2
2
Be l_B R0 _B_ 300
B rel_ ER 5_E 230
Acerel_ BER06_F_2300
tip BE 09 _2 0
Kh arc R0 _I_ 30
Ac atuu_GV 8_H 2300
tip _K A3 _2 0
Olo Syrgarc_ ha2 09_ 300
nK al_ GV _t1 230
uri S A3 _2 2
nG yr1 08 31
E Arz ol_ t1c _23 2
Sa lsVilahanII OKG3_2 12
ya rs _R 2_ 317
ng _U u 2
ors E4 s9_ 36
7
Ridk_R 618 250
u _ 0
Arz
R ala s4 26
ArzhanI_idala_Rid1_2 72
Uu ha I− _ 2_ 677
R
UushgiinnI_I−K3_ id1_2717
A
UushgiinUvu K2_ rz2_2717
Arz 27
s
r_
U
h
Uu giin vu Mo 1_ 27
UushgiinUvur_Mon86_2727
UushgiinUvur_Mon45_3039
UushgiinUvur_Mon41_3080
UushgiinUvur_Mon39_3085
sh U r_ n 3
S giin vu Mo 44_ 085
Uu agza Uvur_Mon79_3085
Uushgiinbad_r_Mon37_3085
UushgiinUvu SAG n87_3085
sh U r_M S2 31
giin vu o 7_ 17
U r_M n4 31
Ba vur_ on83_3117
M
Bateni_ on44_3120
te R 2 2
Ha ni_ us1 _31 3
DuSinta lvai_Rus14_3330
na sh KS 6_ 18
ujv ta_ H 33
aro NB 4_ 50
s_ 46 401
Du _4 7
k2 02
_4 3
07
7
P100.I2
P100.I2
P100.I3
P100.I3
P100.I4
P100.I4
P100.I5
P100.I5
P200.I1
P200.I1
P200.I2
P200.I2
P200.I3
P200.I3
P200.I4
P200.I4
P200.I5
P200.I5
P500.I1
P500.I1
Individuals
P500.I2
P500.I2
P500.I3
P500.I3
P500.I4
P500.I4
P500.I5
P500.I5
PAnc.I1
PAnc.I1
PAnc.I2
PAnc.I2
PAnc.I3
PAnc.I3
PAnc.I4
PAnc.I4
PAnc.I5
PAnc.I5
1.0
Nearly neutral
Slightly deleterious
Mildly deleterious
Strongly deleterious
All
1.5
2.0
dN − dS
2.5
−0.006
3.0
Selection coefficient (s) x Generations of negative selection (t)
Categories:
0.009
0.006
0.003
0.0033
0.0032
0.0031
0.0030
C
Homozygous Load
E
Homozygous Load
−0.007
Figure S3. Mutational Loads: Estimator Assessment and Correlation to Purifying Selection, Related to Figure 2
(A) Evaluating the mutational load estimator at homozygous sites.
(B) Evaluating the mutational load estimator at heterozygous sites.
For panels (A) and (B), mutations were classified as nearly neutral (0 < Ne x s % 1), slightly (1 < Ne x s % 10), mildly (10 < Ne x s % 100) or strongly deleterious (1 < Ne
x s % 10), according to their simulated selection coefficient (s) and population size (Ne). The latter was determined in the ancestral population (referred to as PAnc),
prior to the corresponding demographic collapses to Ne = 100 (P100 population), Ne = 200 (P200) and Ne = 500 (P500). Five individuals were sampled from each
population, and labeled as I1-I5. The homozygous load increased with stronger population declines, especially due to the random fixation of deleterious mutations that, in PAnc, were slightly deleterious (ie. in PAnc, they were less likely to be fixed because the efficacy of negative selection Ne x s was higher). Despite
heterozygosity levels dropped following Ne reductions, the load per heterozygous site remained steady, indicating heterozygous load has limited power to identify
demographic collapses.
(C) Inverse correlation between mutational loads estimated at homozygous sites in modern horse genomes and the accumulated strength of purifying selection
over generations, estimated as described in STAR Methods.
(D) Individual differences between non-synonymous (dN) and synonymous (dS) substitutions in DOM2 horses.
(E) Positive correlation between mutational loads estimated at homozygous sites and the difference between non-synonymous (dN) and synonymous (dS)
substitutions.
He
�Figure S4. Distributions of PBS Scores, Related to Figure 4
We considered a 3-population tree consisting of 11 Bronze Age Deer Stone horses (representing the pre-C7th–C9th Asian group), 11 Gallo-Roman horses (preC7th–C9th European horses) and 17 Byzantine horses (post-C7th–C9th). All individual genomes showed above 1-fold depth-of-coverage (Tables S6 and S7; STAR
Methods). The genome-wide distributions of PBS scores in all three branches within 50kb sliding windows is shown in blue. Neutral distributions are calculated
from 50,000 bootstrap pseudo-replicates at four-fold degenerate sites (red) and intergenic positions defined to be located at least five kilobases away from gene
bodies (green). Conservative cut-offs retained to identify selection candidates are shown as horizontal lines.
�Dwa
rfis
Dwa m PRO
P
rf
Larg ism PR 1 (chr1
4:37
OP
er
612
Larg body s 1 (chr1
54)
ize
e
HM 4:3761
Larg r body
GA2
3
(chr3 er bo size L
(chr6 55)
AS
:1 dy
:814
Larg 05547 size LC P1 (ch
810
002
r1
er
) ORL/N 1:232 65)
With body
597
CAP
siz
er h
32)
G
eigh e ZFA
With
T
t ZF
er h
AT (c (chr9:7
e
ig
With
hr9:7 5550
ht Z
er h
0
FAT
4
5
eigh
(chr9 79501 9)
With
t ZF
3)
er
AT (c :7479
508
Opti height
hr9:7
9)
mum
ZFA
(chr1
47
T (c
ra
hr9:7 95236)
Patt 8:664 cing
479
(chr2ern of 93737 positio
814
)
nM
Rac 3:2299locomo
STN 3)
ti
ing
9
perf 655) on (alt
Rac
ered
orm
ing
a nc
g
ait)
p
eA
erfo
Rac
DM
CN9
rma
ing
RT3
nce
(chr4
perf
Rac
A
orm
:402
ing
anc CTN2
797
perf
(c
e
Rac
26)
h
C
orm
ing
anc KM (c r1:748
p
h
4
eC
erfo
Rac
OX4 r10:15 2283)
rma
ing
884
/1 (c
nce
perf
567
Rac
C
h
o
r3
rm
O
)
ing
X
:327
anc
perf
e P 4/2 (ch
728
Rac
orm
DK4
71)
r2
ing
anc
(chr4 2:2268
perf
eP
439
:38
orm
DK4
And
anc
roge
(chr4 96930 0)
(chrX
eP
n in
7
:3
)
ON
89
Auto :496 sens
1 (c
hr4:3 73231)
cho soma 35250 itivity s
86 9
ndro l rec )
ynd
Cere
714
e
rom
d
5)
b ysp ssiv
e (A
Con ellar a lasia Sely inh
IS)
b
e
AR
L
g
io
trop C26A rited
Equ enita
l
h
in
2
m
y
TOE (chr1
(chr1 e hyp yoto
n
e
1
4
ia
1
rk
:2
(chr2 79
Foa :15
ale
CL
(chr2l immu500439mic peCN1 (c :130791841
)
4
riod hr4
Here 6:30 nodefi )
ic p :963 277)
araly 755
asth ditary66022 ciency
sis 88)
syn
Incoenia equin4)
SCN
d
P
ro
n
e
P
me
Leth tinen IB (c derm
4A
S
ti
a
h
L
a
a
l
r1
C
EDN whit pigm :12 l iso
5A3
805 mera
Mali RB (c e foal enti IK
sy
h
g
B 6148) se B
Poly nant hr17:506ndrom KG (c
(chr1sacch yperthe24658 e (bothhrX:12
rmia )
0:18 aride
pres 2833
940 stora RYR
ent) 887)
Cha
324
mpa
) ge my 1 (chr1
opa
Che gne d
thy 0:9554
iluti
stn
GYS
699
Che ut coa on SLC
)
1
t co
3
Cre stnut
6
lor M
A1
am coa
(chr1
(chr2
C1
co t
Leo 1:30 at cocloolor M R (chr3 4:267
0
p
109
blin ard c66662 r SLCC1R (c :3625
2
dne omp 6)
)
4
9
5A2 hr3:3
5
Mac ss
(MA 625 52)
ch TRPlex sp
TP) 955
Sab iato, he M1 (c otting a
4)
arin hr1:1 nd
Silv ino sp
stati
g lo
0
8
o
e
ss M 249 ona
(chr6 r coa tting
KIT
ITF 293) ry nig
tc
:7
(ch
ht
Spla 36653olor PM (chr3
0
she
EL1 :777 r16:201
d w 4)
7 (S 3552
030
Tob
hite
ILV1 0)
81)
iano
coa
1)
spo
t PA
tting
X3
(chr6
patt
ern
:114
KIT
297
(chr3
53)
:777
401
61)
CaminoDeLasYeseras_CdY2_4678
Cantorella_UE2275x2_4791
ElAcequion_Spain39_3993
Batagai_5155
MerzlyYar_Rus45_23789
Taymyr_CGG10022_42758
Taymyr_CGG10023_16056
Marvele_01_1138
Marvele_18_1189
Marvele_21_1087
Marvele_32_1144
Borly4_PAVH11_5015
Borly4_PAVH4_4974
Borly4_PAVH6_5012
Borly4_PAVH8_4978
Borly4_PAVH9_4977
Botai_2_5500
Botai_4_5500
Botai_5_5500
Botai_6_5500
BozAdyr_KYRH10_1267
BozAdyr_KYRH8_1267
Yenikapi_Tur140_1289
Yenikapi_Tur141_1430
Yenikapi_Tur142_1396
Yenikapi_Tur145_1156
Yenikapi_Tur146_1730
Yenikapi_Tur150_1443
Yenikapi_Tur170_1443
Yenikapi_Tur171_1689
Yenikapi_Tur172_1695
Yenikapi_Tur173_1443
Yenikapi_Tur175_1443
Yenikapi_Tur176_1443
Yenikapi_Tur181_1443
Yenikapi_Tur193_1443
Yenikapi_Tur194_1360
Yenikapi_Tur229_1443
Yenikapi_Tur243_1443
UushgiinUvur_Mon37_3085
UushgiinUvur_Mon39_3085
UushgiinUvur_Mon41_3085
UushgiinUvur_Mon42_3130
UushgiinUvur_Mon43_3120
UushgiinUvur_Mon44_3085
UushgiinUvur_Mon45_3080
UushgiinUvur_Mon79_3085
UushgiinUvur_Mon84_3123
UushgiinUvur_Mon86_3039
UushgiinUvur_Mon87_3117
Associated Allele
1.00
0.75
0.50
0.25
Native Iberian
Archaic Russian
Aukstaiciai
Borly 4
Botai
Boz Adyr
Byzantine
Deer Stone
Boves_GVA191_1717
Chartres_GVA26_1917
Chartres_GVA36_1917
Chartres_GVA4_1917
Chartres_GVA43_1917
Chartres_GVA56_1917
Chartres_GVA81_1917
Evreux_GVA133_1817
Evreux_GVA140_1817
Fmontauban_GVA126_1872
Macon_GVA201_1767
TavanTolgoi_GEP13_730
TavanTolgoi_GEP14_730
TavanTolgoi_GEP21_730
Bateni_Rus14_3318
Bateni_Rus16_3350
Actiparc_GVA124_2143
Actiparc_GVA307_2127
Actiparc_GVA308_2312
Actiparc_GVA309_2302
Actiparc_GVA311_2253
SaintJust_GVA242_2250
Arab_0237A
Conn_0004A
Duel_0238A
Probability
FrMo_0065A
Hano_0235A
Heav_0269A
Icel_0144A
Icel_0247A
Jeju_0275A
Marw_0239A
Mong_0153A
Mong_0215A
Morg_0096A
Quar_0073A
Shet_0249A
Shet_0250A
Sorr_0236A
Stan_0081A
Thor_0145A
Thor_0290A
Yaku_0163A
Yaku_0170A
Yaku_0171A
Nustar_5_1187
OlonKurinGol_OKG2_2367
Beauvais_GVA122_417
Beauvais_GVA375_467
Belgheis_TrBWBX116_485
Dunaujvaros_Duk2_4077
ElsVilars_UE4618_2672
Garbovat_Gar3_3574
Gregorevka4_PAVH2_1192
Halvai_KSH4_4017
Khatuu_Kha2_t1_2312
Khotont_UCIE2012x85_1291
KoulianCave_MV178_1694
Mainz_Mzr1_1373
Noyon_GVA123_717
Oktyabrsky_Rus37_830
Otepaa_Ote2_1184
Saadjarve_Saa1_1117
Sagzabad_SAGS27_3117
Sayangorsk_Rus41_2677
Sintashta_NB46_4023
TachtiPerda_TP4_3604
Tumeski_CGG101397_192
Yerqorqan_YER28_2853
Zhanaturmus_Issyk1_1143
SharIQumis_AM115_1557
SharIQumis_AM181_1694
Przewalski_0150A
Przewalski_0151A
Przewalski_0157A
Przewalski_0158A
Przewalski_0159A
Przewalski_0160A
Przewalski_Paratype_118
Ridala_Rid1_2717
Ridala_Rid2_2717
AugustaRaurica_JG160_1817
FrankfurtHeddernheim_Fr1_1863
Haunstetten_1979
ArzhanI_I−K2_Arz1_2727
ArzhanI_I−K3_Arz2_2727
ArzhanII_Rus9_2500
Berel_BER01_A_2300
Berel_BER02_B_2300
Berel_BER04_D_2300
Berel_BER05_E_2300
Berel_BER06_F_2300
Berel_BER07_G_2300
Berel_BER08_H_2300
Berel_BER09_I_2300
Berel_BER10_K_2300
Berel_BER12_M_2300
Syrgal_Syr1t1c3_2317
Gallo-Roman
Great Mongolian
Empire
Karasuk
La Tène
Modern
Nustar
Olon Kurin Gol
Other ancient horses
Sassanid / Persian
Przewalski
Ridala
Roman
Pazyryk Scythian
WitterPlace_UK15_217
WitterPlace_UK16_217
WitterPlace_UK17_267
WitterPlace_UK18_267
GolModII_Mon23_2007
GolModII_Mon24_1993
GolModII_Mon25_2011
GolModII_Mon26_1999
GolModII_Mon27_2011
GolModII_Mon28_1988
Witter Place
Xiongnu
Coat
Diseases
Racing performances
Size
(legend on next page)
�Figure S5. Heatmap Summarizing the Genotypes of 159 Ancient and Modern Horses at 57 SNPs Associated with Key Phenotypic Traits,
Related to Figure 4
The 57 SNPs are grouped into coat-color variants, genetic diseases, racing and locomotion capabilities, and body size conformation. Similarly, horses are
grouped based on their population or cultural context. Grey and red tiles denote horses that were heterozygous and homozygous for the allele associated with the
phenotypic trait respectively. White cells indicate the horse carried two copies of the non-causative allele. Tiles with vertical crosses mark non-genotyped SNPs.
Causative alleles supported by a single read were conservatively assumed to be absent, to mitigate potential sequencing errors.
�Leopard complex spotting and stationary night blindness TRPM1 (chr1:108249293)
Chestnut coat color MC1R (chr3:36259552)
Chestnut coat color MC1R (chr3:36259554)
Sabino spotting KIT (chr3:77735520)
Tobiano spotting pattern KIT (chr3:77740161)
Splashed white coat PAX3 (chr6:11429753)
Silver coat color PMEL17 (SILV11) (chr6:73665304)
Champagne dilution SLC36A1 (chr14:26701092)
Macchiato, hearing loss MITF (chr16:20103081)
Cream coat color SLC45A2 (MATP) (chr21:30666626)
Hereditary equine dermal isomerase B asthenia PPIB (chr1:128056148)
Cerebellar abiotrophy TOE1 (chr2:13074277)
Congenital myotonia CLCN1 (chr4:96375588)
Malignant hyperthermia RYR1 (chr10:9554699)
Polysaccharide storage myopathy GYS1 (chr10:18940324)
Equine hyperkalemic periodic paralysis SCN4A (chr11:15500439)
Autosomal recessively inherited chondrodysplasia SLC26A2 (chr14:27991841)
Lethal white foal syndrome (both present) EDNRB (chr17:50624658)
Foal immunodeficiency syndrome SLC5A3 (chr26:30660224)
Androgen insensitivity syndrome (AIS) AR (chrX:49635250)
Incontinentia pigmenti IKBKG (chrX:122833887)
Racing performance ACTN2 (chr1:74842283)
Racing performance COX4/1 (chr3:32772871)
Racing performance PON1 (chr4:38697145)
Racing performance PDK4 (chr4:38969307)
Racing performance PDK4 (chr4:38973231)
Racing performance ACN9 (chr4:40279726)
Racing performance CKM (chr10:15884567)
Optimum racing position MSTN (chr18:66493737)
Racing performance COX4/2 (chr22:22684390)
Pattern of locomotion (altered gait) DMRT3 (chr23:22999655)
Larger body size LCORL/NCAPG (chr3:105547002)
Larger body size HMGA2 (chr6:81481065)
Wither height ZFAT (chr9:74795013)
Wither height ZFAT (chr9:74795089)
Wither height ZFAT (chr9:74795236)
Wither height ZFAT (chr9:74798143)
Larger body size ZFAT (chr9:75550059)
Larger body size LASP1 (chr11:23259732)
Dwarfism PROP1 (chr14:3761254)
Dwarfism PROP1 (chr14:3761355)
Short distance racing performance ADHFE1 (chr9:18802749)
Short distance racing performance GSN (chr25:25024464)
Short distance racing performance GSN (chr25:25028755)
Racing performance PDK4 (chr4:38968139)
Racing performance in males PTGS1 (chr25:25991437)
Racing performance in males PTGS1 (chr25:26007699)
Height LCORL/ECA3 (chr3:105163077)
Hydrocephaly B3GALNT2 (chr1:75907505)
Dwarfism ACAN (chr1:94370258)
Warmblood fragile foal syndrome typ 1 (WFFS) PLOD1 (chr2:39711930)
Naked foal syndrome ST14 (chr7:38673244)
Susceptibility to EAV infection (long−term carrier stallions) CXCL16 (chr11:49746951)
Dwarfism with joint laxity B4GALT7 (chr14:4535550)
Brindle 1 haircoat texture MBTPS2 (chrX:16391590)
Polycystic kidney disease PKHD1 (chr20:49630834)
Polycystic kidney disease PKHD1 (chr20:49597760)
1.00
0.75
0.50
0.25
0.00
1.00
0.75
0.50
0.25
0.00
1.00
0.75
0.50
0.25
0.00
1.00
0.75
0.50
0.25
0.00
1.00
0.75
0.50
0.25
0.00
Allele frequency
1.00
0.75
0.50
0.25
0.00
1.00
0.75
0.50
0.25
0.00
1.00
0.75
0.50
0.25
0.00
1.00
0.75
0.50
0.25
0.00
1.00
0.75
0.50
0.25
0.00
1.00
0.75
0.50
0.25
0.00
0
1000
2000
3000
0
1000
2000
3000
0
1000
2000
3000
1.00
0.75
0.50
0.25
0.00
0
1000
2000
3000
0
1000
2000
3000
Period
Figure S6. Temporal Allele Trajectories for 57 SNPs Underlying Traits Commonly Selected by Modern Breeders, Including Key Genomic Loci
Associated with or Causal for Locomotion, Conformation, Coat-Coloration Phenotypes, and Diseases, Related to Figure 4
�A
0.094
Colour key
0.096
Value
0.098
B
Extinct Russian (E. lenensis)
Native Iberian (IBE)
Somali 0226A 0
Borly4
Extinct Russian (E. lenensis)
Przewalski
Przewalski Paratype 118
Botai
Native Iberian (IBE)
Dunaujvaros Duk2 4077 (E)
ElsVilars UE4618 2672 (E)
Halvai KSH4 4017 (A)
Sintashta NB46 4023 (A)
Deer Stone (A)
Karasuk (A)
Xiongnu (A)
Boz Adyr (A)
Scythian (A)
Ridala (E)
Olon Kurin Gol (A)
Gallo-Roman (E)
Mainz Mzr1 1373 (E)
La Tène (E)
Roman (E)
Aukstaiciai (E)
Saadjarve Saa1 1117 (E)
Pictish and Viking (E)
Icelandic
Shetland
Sassanid/Persian (A)
Khotont UCIE2012x85 1291 (A)
Great Mongolian Empire (A)
Gregorevka4 PAVH2 1192 (A)
Zhanaturmus Issyk1 1143 (A)
Nustar (E)
Tumeski CGG101397 192 (A)
Yakutian
Mongolian
Jeju
Byzantine (E)
Witter Place (E)
Friesian
Duelmener
Sorraia
FMontagnes
Connemara
Heavy Warmblood
Morgan
Marwari
Belgheis TrBWBX116 485 (A)
Standardbred
Arabian
Przewalski
Thoroughbred
Hanoverian
Quarter
Botai, ~5,500 years ago
Ancient DOM2
Borly4, ~5,000 years ago
Modern DOM2
Figure S7. Outgroup-f3 Statistics and TreeMix Phylogenetic Inference, Assuming One Migration Edge, Related to Figures 3 and 5
(A) Outgroup-f3 statistics considering 160 horses included in dataset (d). The f3-outgroup statistics were calculated in the form (X, Y; Outgroup), where X and Y
represent pairwise combinations (n = 12,561). The f3-outgroup statistic was computed including the outgroup species (E. africanus somaliensis) and with
50,757,656 nucleotide transversions, using an in-house C++ script.
(B) TreeMix phylogenetic relationships assuming one migration edge (weight = 0.386). The tree topology was inferred using a total of �16.8 million transversion
sites. The name of each sample provides the archaeological site as a prefix, and the age of the specimen as a suffix (years ago). Name suffixes (E) and (A) denote
European and Asian ancient horses, respectively. See Table S5 for further information on the datasets used in each analysis.
Przewalski_Paratype_118
ElAcequion_Spain39_3993
Cantorella_UE2275x2_4791
CaminoDeLasYeseras_CdY2_4678
Batagai_5155
Taymyr_CGG10022_42758
Dunaujvaros_Duk2_4077
MerzlyYar_Rus45_23789
Taymyr_CGG10023_16056
Przewalski_0151A_0
Przewalski_0160A_0
Przewalski_0158A_0
Przewalski_0159A_0
Przewalski_0150A_0
Przewalski_0157A_0
Goyet_Vert311_35870
Tumeski_CGG101397_192
Garbovat_Gar3_3574
Bateni_Rus14_3318
Yerqorqan_YER28_2853
ArzhanII_Rus9_2500
Sayangorsk_Rus41_2677
ArzhanI_I−K2_Arz1_2727
ArzhanI_I−K3_Arz2_2727
Borly4_PAVH9_4977
Botai_6_5500
Botai_2_5500
Borly4_PAVH4_4974
Botai_4_5500
Borly4_PAVH6_5012
Borly4_PAVH8_4978
Borly4_PAVH11_5015
Botai_5_5500
Thoroughbred_0145A_0
Thoroughbred_0290A_0
Hanoverian_0235A_0
Quarter_0073A_0
Friesian_0296A_0
Shetland_0250A_0
Shetland_0249A_0
Icelandic_0144A_0
Icelandic_0247A_0
Sorraia_0236A_0
Duelmener_0238A_0
FMontagnes_0065A_0
Jeju_0275A_0
Mongolian_0215A_0
Mongolian_0153A_0
Yakutian_0163A_0
Yakutian_0171A_0
Yakutian_0170A_0
HeavyWarmblood_0269A_0
Connemara_0004A_0
Marwari_0239A_0
Morgan_0096A_0
Arabian_0237A_0
Standardbred_0081A_0
Belgheis_TrBWBX116_485
Actiparc_GVA309_2302
Halvai_KSH4_4017
WitterPlace_UK18_267
Syrgal_Syr1t1c3_2317
Marvele_01_1138
Yenikapi_Tur145_1156
Yenikapi_Tur146_1730
Yenikapi_Tur170_1443
Actiparc_GVA311_2253
UushgiinUvur_Mon79_3085
Zhanaturmus_Issyk1_1143
GolModII_Mon25_2011
Yenikapi_Tur181_1443
Yenikapi_Tur243_1443
Yenikapi_Tur173_1443
Yenikapi_Tur176_1443
WitterPlace_UK15_217
WitterPlace_UK16_217
WitterPlace_UK17_267
Actiparc_GVA307_2127
Evreux_GVA133_1817
AugustaRaurica_JG160_1817
Berel_BER11_L_2300
Berel_BER10_K_2300
ElsVilars_UE4618_2672
Oktyabrsky_Rus37_830
Berel_BER08_H_2300
Haunstetten_1979
Saadjarve_Saa1_1117
Sagzabad_SAGS27_3117
UushgiinUvur_Mon44_3085
UushgiinUvur_Mon87_3117
Chartres_GVA26_1917
Macon_GVA201_1767
Beauvais_GVA122_417
Berel_BER07_G_2300
Khatuu_Kha2_t1_2312
Actiparc_GVA308_2312
UushgiinUvur_Mon43_3120
GolModII_Mon28_1988
UushgiinUvur_Mon45_3080
UushgiinUvur_Mon41_3085
Berel_BER02_B_2300
Berel_BER04_D_2300
Berel_BER12_M_2300
GolModII_Mon23_2007
Berel_BER05_E_2300
Berel_BER06_F_2300
Berel_BER01_A_2300
Berel_BER09_I_2300
Yenikapi_Tur150_1443
Yenikapi_Tur193_1443
Yenikapi_Tur140_1289
Evreux_GVA140_1817
Mainz_Mzr1_1373
Marvele_21_1087
Yenikapi_Tur175_1443
Marvele_32_1144
GolModII_Mon24_1993
SharIQumis_AM115_1557
Khotont_UCIE2012x85_1291
TachtiPerda_TP4_3604
Chartres_GVA36_1917
Chartres_GVA43_1917
Chartres_GVA4_1917
Chartres_GVA81_1917
Actiparc_GVA124_2143
Boves_GVA191_1717
Fmontauban_GVA126_1872
SaintJust_GVA242_2250
UushgiinUvur_Mon39_3085
UushgiinUvur_Mon84_3123
Sintashta_NB46_4023
GolModII_Mon27_2011
UushgiinUvur_Mon86_3039
Otepaa_Ote2_1184
Chartres_GVA56_1917
Ridala_Rid1_2717
Ridala_Rid2_2717
Noyon_GVA123_717
Marvele_18_1189
Beauvais_GVA375_467
TavanTolgoi_GEP13_730
TavanTolgoi_GEP14_730
UushgiinUvur_Mon37_3085
UushgiinUvur_Mon42_3130
Yenikapi_Tur171_1689
Yenikapi_Tur172_1695
Yenikapi_Tur194_1360
Yenikapi_Tur229_1443
Nustar_5_1187
TavanTolgoi_GEP21_730
Yenikapi_Tur142_1396
Yenikapi_Tur141_1430
BozAdyr_KYRH10_1267
GolModII_Mon26_1999
OlonKurinGol_OKG2_2367
SharIQumis_AM181_1694
FrankfurtHeddernheim_Fr1_1863
BozAdyr_KYRH8_1267
Bateni_Rus16_3350
Gregorevka4_PAVH2_1192
�
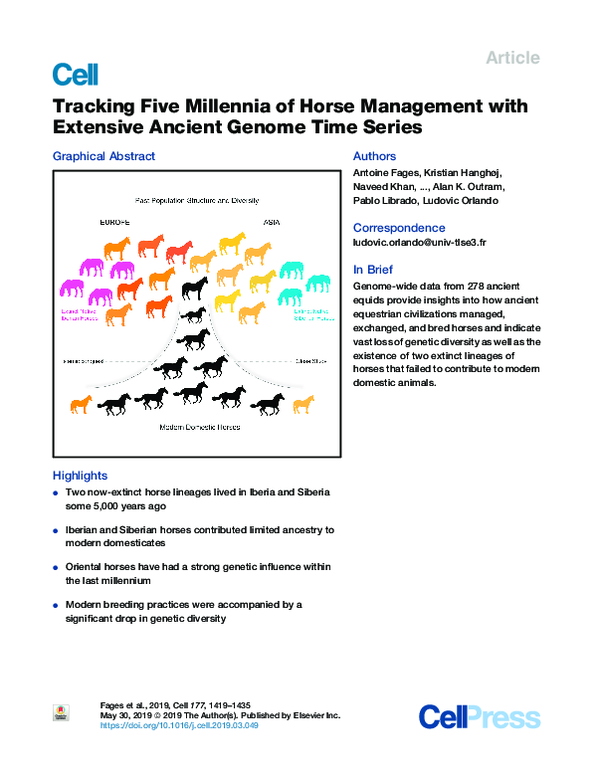
 Cleia Detry