ARTICLE
Received 3 Sep 2015 | Accepted 11 Jan 2016 | Published 19 Feb 2016
DOI: 10.1038/ncomms10678
OPEN
Functional dissociation in sweet taste receptor
neurons between and within taste organs of
Drosophila
Vladimiros Thoma1,2, Stephan Knapek2, Shogo Arai3, Marion Hartl2,w, Hiroshi Kohsaka4, Pudith
Sirigrivatanawong3, Ayako Abe1, Koichi Hashimoto3 & Hiromu Tanimoto1,2
Finding food sources is essential for survival. Insects detect nutrients with external taste
receptor neurons. Drosophila possesses multiple taste organs that are distributed throughout
its body. However, the role of different taste organs in feeding remains poorly understood. By
blocking subsets of sweet taste receptor neurons, we show that receptor neurons in the legs
are required for immediate sugar choice. Furthermore, we identify two anatomically distinct
classes of sweet taste receptor neurons in the leg. The axonal projections of one class
terminate in the thoracic ganglia, whereas the other projects directly to the brain. These two
classes are functionally distinct: the brain-projecting neurons are involved in feeding initiation,
whereas the thoracic ganglia-projecting neurons play a role in sugar-dependent suppression
of locomotion. Distinct receptor neurons for the same taste quality may coordinate early
appetitive responses, taking advantage of the legs as the first appendages to contact food.
1 Graduate School of Life Sciences, Tohoku University, Katahira 2-1-1, Miyagi, Sendai 980-8577, Japan. 2 Max-Planck Institut für Neurobiologie, D-82152
Martinsried, Germany. 3 Graduate School of Information Sciences, Tohoku University, Aramaki Aza Aoba 6-6-01, Aoba-Ku, Sendai 980-8579, Japan.
4 Department of Complexity Science and Engineering, Graduate School of Frontier Sciences, The University of Tokyo, 5-1-5 Kashiwanoha, Kashiwa-shi, Chibaken 277-8561, Japan. w Present address: Gut Signalling and Metabolism Group, MRC Clinical Sciences Centre, Imperial College London, Du Cane Road,
London W12 0NN, UK. Correspondence and requests for materials should be addressed to H.T. (email: hiromut@m.tohoku.ac.jp).
NATURE COMMUNICATIONS | 7:10678 | DOI: 10.1038/ncomms10678 | www.nature.com/naturecommunications
1
�ARTICLE
NATURE COMMUNICATIONS | DOI: 10.1038/ncomms10678
A
b
Camera
Sugar
Filter
Paper
Water
Filter
Paper
Transilluminator
c
d
e
f
g
h
i
Sugar
Ring
Results
Hungry flies show rapid and robust sugar preference. We
developed a simple behavioural paradigm, the sugar preference
assay, to quantify early appetitive responses of fruit flies (Fig. 1).
In the sugar preference assay, we introduced freely walking flies
into a circular arena, where they were allowed to choose between
two sides: one with sugar and one without (Fig. 1a). Fly behaviour
was video-recorded from above, allowing subsequent quantification of position and locomotion. We used the wild-type Canton S
strain to characterize the assay. Starved flies showed quick and
robust responses to sucrose (Fig. 1b–e). We calculated preference
indices (PIs) by automatically counting and subtracting the fly
numbers on the sugar and non-sugar sides in a given video frame
(Fig. 1f–i). Plotting PI over time revealed that wild-type flies
chose the sugar side within the first 20–30 s, with PIs reaching a
plateau thereafter (Supplementary Fig. 1). We therefore pooled
Sugar
Transparent
lid
exclusive. However, the contribution of taste receptor neurons in
deciding between these two behaviours remains unclear.
To better understand the role of different taste organs in
appetitive behaviour, we targeted subsets of GRNs with the
GAL4/upstream activating sequence (UAS) system20. We selected
Drosophila lines8 expressing GAL4 under the control of various
gustatory receptor promoters (Gr-GAL4) that have overlapping
but distinct expression patterns in sweet taste receptor neurons.
These lines differentially label the major Drosophila taste organs.
To characterize the function of these different sets of GRNs, we
developed an assay that allows the quantification of multiple
feeding behaviours under conditions that resemble natural
foraging. We then independently silenced subsets of GRNs and
measured sugar preference in our assay. Our results show that
sweet taste receptor neurons in the tarsi are essential for sugar
choice. In the tarsi, we identified two anatomically distinct
populations of sweet taste receptor neurons that are involved in
different appetitive behaviours. Taken together, our results
highlight a functional dissociation between and within taste
organs of Drosophila.
Water
a
Water
nimals rely on sensory systems for survival and
reproduction. The gustatory system is important for
finding and evaluating food sources, but can also have
other roles. For Drosophila in particular, gustation is critical for
mate and food selection. Mate selection requires specialized
pheromone receptors in the legs of male flies1–3. Food selection is
thought to involve the perception of multiple taste qualities,
including bitter, sweet and salty tastants4–9, which promote or
inhibit feeding.
In Drosophila, tastants are detected by taste hairs and taste pegs,
most of which house multiple gustatory receptor neurons
(GRNs)10, with each neuron tuned to a specific taste quality.
Unlike mammals, where the tongue is the primary taste organ,
insect taste hairs are distributed throughout the body. In particular,
Drosophila GRNs can be found in the labellum, pharynx, tarsi,
wing margins and female ovipositor10. So far, the functional
significance of different taste organs is unclear. Notably, even
though Drosophila GRNs are broadly distributed in the body, their
central nervous system (CNS) projections are grouped according to
taste organ. Projections from the pharyngeal, labellar and tarsal
GRNs are located in the anterior, medial and posterior gnathal
ganglia (GNG), respectively7,11–13. This implies that flies are able to
differentially process gustatory information depending on stimulus
location, and thus produce different behavioural outputs for the
same stimulus7,14. In line with this, different sets of bitter taste
receptor neurons in Drosophila are necessary for positional
aversion and egg-laying preference15.
Feeding is a complex sequence of behaviours. In Drosophila,
feeding is initiated by food detection and followed by locomotion
arrest, extension of the proboscis and ingestion16. In addition, a
recent study reported that sweet taste receptors in the pharynx
promote ingestion prolongation17. It is therefore reasonable to
assume that external taste organs are involved in earlier stages of
appetitive behaviour. Once the decision to feed is made, the
inhibition of other behaviours, such as locomotion, should occur.
The recent identification of interneurons that influence the
decision between feeding and moving in the Drosophila larva18
and adult19 helps to explain why these behaviours are mutually
5s
j
10 s
k
1
30 s
60 s
1
0.6
PI
PI
0.6
0.2
0.2
–0.2
0
8
16
24
32
40
Starvation time (h)
48
–0.2
0
0.5
1.5
1
[Sucrose] (M)
2
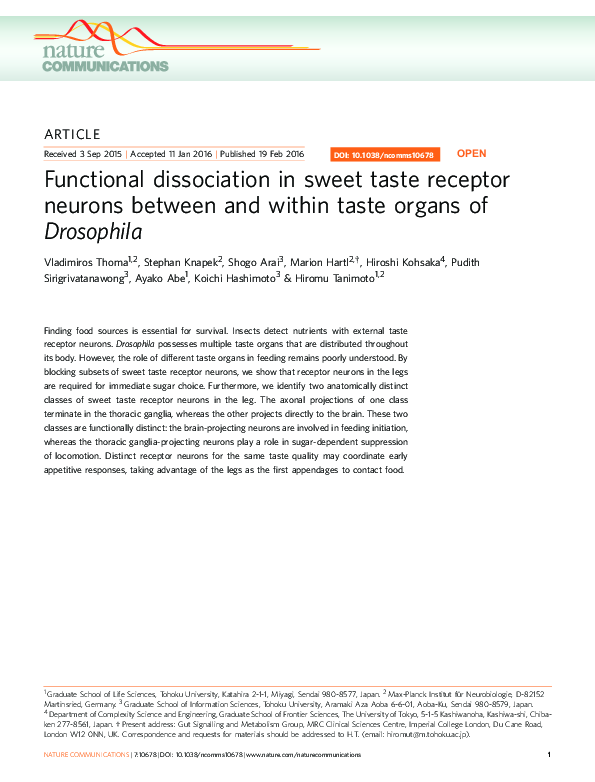
Figure 1 | The sugar preference assay. (a) Schematic of the experimental set-up used to measure sucrose preference. (b–e) Examples of the distribution
of starved (36 h) Canton S flies in the circular arena at various time points (5–60 s) after introduction. A 2-M sucrose solution was used for the sucrose
side (lower semicircle). (f–i) Same images as in b–e after applying a suitable threshold with the Fiji software. Identified particles are in black. (j) Starvation
dependency of sucrose PI of Canton S flies. A 2-M sucrose solution was used. n ¼ 8–12 per starvation interval. (k) Concentration dependency of sucrose PI
of Canton S flies. Flies were starved to 20% mortality (average starvation time 40 h). n ¼ 11–15 per concentration. Results are means±s.e.m.
2
NATURE COMMUNICATIONS | 7:10678 | DOI: 10.1038/ncomms10678 | www.nature.com/naturecommunications
�ARTICLE
NATURE COMMUNICATIONS | DOI: 10.1038/ncomms10678
line with a recent study17. Therefore, these LSO GRNs are
not critical for sugar choice. Third, only Gr61a-GAL4 and
Gr64f-GAL4, which labelled the maximum number of GRNs in
the legs (12 cells, Fig. 2n,o) showed abolished sugar preference on
blockade. Taken together, our results suggest that sweet taste
receptor neurons in the legs, but not the labellum or LSO, are
critical for sugar preference in Drosophila.
the data between 30 and 60 s for each experiment, and simply
refer to them as preference or PIs. PIs were strongly dependent on
the degree of starvation and sugar concentration. In particular,
the average PI increased steadily between 2 and 8 h of starvation,
and reached a plateau between 24 and 48 h (Fig. 1j and
Supplementary Fig. 1a). Similarly, the PI rose with increasing
sucrose concentration for long-starved flies (B20% mortality;
Fig. 1k and Supplementary Fig. 1b). Given the high signal-tonoise ratio, we chose the long starvation/high sugar concentration
conditions for the following experiments.
Two anatomically distinct classes of tarsal sweet GRNs.
Strikingly, blocking with Gr5a-GAL4 resulted in a modest PI
decrease, despite its broad expression pattern (Fig. 2). Gr5a-GAL4
labels all sweet taste receptor neurons in labellar taste hairs8 and
most sweet taste receptor neurons in the legs. In contrast,
Gr64f-GAL4, which labels only a few additional cells in the legs,
showed no sugar preference (Fig. 2a) on blockade. To understand
this difference, we examined the differences in Gr5a-GAL4 and
Gr64f-GAL4 expression in greater detail (Fig. 3). Both lines
labelled inputs from the labellum and legs (Fig. 3a,b). However,
only Gr64f-GAL4 marked ascending fibres from the ventral nerve
cord (VNC) to the cervical connective and the posterior GNG
(Fig. 3a,b).
To better contrast differentially labelled cells, we used
Gr5a-LexA and Gr64f-GAL4 to drive different reporters in the
same fly. Overall, both drivers showed highly overlapping
expression (Fig. 3c–e; yellow). The GRNs labelled in both
Gr5a-GAL4 and Gr64f-GAL4 terminate in a given thoracic
neuromere, while a few additional GRNs in the fifth tarsal
segment of Gr64f-GAL4 project directly to the GNG through the
cervical connective (Fig. 3c–e). Despite the lesser requirement of
Gr5a-GAL4-labelled cells for sugar preference (Fig. 2), the
number of common tarsal GRNs is more than twice as many
as the ascending cells (9–10 versus 2–4 cells). Single-cell
analysis24 with Gr64f-GAL4 revealed both cell populations in
the CNS (Fig. 3f,g). Interestingly, the ascending cells displayed
axon collaterals in the VNC (Fig. 3f), which intermingled with the
Sweet GRNs in the legs are required for sugar preference. To
examine the role of different taste organs in appetitive behaviour,
we next chose to silence subsets of sweet taste receptor neurons.
We selected seven Gr-GAL4 lines labelling GRNs that express
sets of homologous sweet taste receptors (Fig. 2a)21. We drove
expression of Kir2.1, an inward-rectifying potassium channel22,
to electrically silence sweet taste receptor neurons by the specific
Gr-driven GAL4. We then tested flies for sugar preference
(Fig. 2a). We found that sugar preference was highly variable
among the drivers, ranging from normal preference to complete
impairment of sugar preference. The blockades with Gr61a-GAL4
and Gr64f-GAL4 abolished sucrose preference, and blocking with
Gr64e-GAL4 caused a statistically significant decrease. To better
understand the observed differences, we examined the expression
patterns of all GAL4 lines in the GNG and forelegs (Fig. 2b–o).
Our detailed anatomical analyses are consistent with a recent
study23 and highlight three key findings. First, expression in the
labellar nerve did not always yield strong sugar preference
impairment (Gr64c-GAL4 and Gr5a-GAL4 in Fig. 2). Second,
Gr64a-GAL4 specifically labelled pharyngeal GRN terminals
(Fig. 2d,k) but showed normal preference. Detailed anatomical
analysis revealed that Gr64a-GAL4 and Gr64f-LexA co-labelled
four cells in the labral sense organ (LSO), but did not label the
ventral or dorsal cibarial sense organs (Supplementary Fig. 2), in
a
UAS-Kir2.1/+
Gr-GAL4/+
Gr-GAL4/UAS-Kir2.1
1
0.8
PI
0.6
0.4
***
0.2
***
***
0
Gr64d
–0.2
Gr64c
c
b
Gr64a
Gr5a
e
d
Gr64e
Gr61a
g
f
Gr64f
h
GNG
0.3 cells
(n = 8)
j
4.8 cells
(n = 6)
k
0 cells
(n = 9)
l
8.7 cells
(n = 11)
m
6.6 cells
(n = 9)
n
12 cells
(n = 10)
o
11.6 cells
(n = 9)
GFP
i
Figure 2 | Blocking specific subsets of sweet taste receptor neurons differentially affects sucrose preference. (a) Requirement of different sweet taste
receptor neurons for sucrose preference. Electrically silencing sweet taste receptor neurons in Gr61a-GAL4, Gr64e-GAL4 and Gr64f-GAL4 with constitutively
active UAS-Kir2.1 impaired 2-M sucrose PI compared with genetic controls (Kruskal–Wallis test; Dunn’s post test; ***Po0.001). Driving UAS-Kir2.1 by all
other tested Gr-GAL4 lines did not significantly impair sucrose preference (P40.05). Sucrose preference of flies with silenced sweet taste receptor neurons
using Gr61a-GAL4 and Gr64f-GAL4 was indistinguishable from zero (Wilcoxon signed-rank test, P40.05). n ¼ 12–23 per group. Results are medians, error
bars indicate the first/third quartile. (b–h) Expression patterns of Gr-GAL4 lines in the GNG (UAS-mCD8::GFP, orange; Synapsin (ubiquitous synaptic
marker), blue). Partial projections, scale bars, 40 mm. Note inputs from the VNC via the cervical connective (arrows) only in the three Gr-GAL4 lines with
impaired sucrose preference. (i–o) Expression patterns of Gr-GAL4 lines in foreleg tarsi (UAS-mCD8::GFP, orange). Total cell numbers (mean) of all tarsal
segments are reported. Strong signals in the joints are autofluorescence. Scale bars, 40 mm, n ¼ 6–11.
NATURE COMMUNICATIONS | 7:10678 | DOI: 10.1038/ncomms10678 | www.nature.com/naturecommunications
3
�ARTICLE
a
NATURE COMMUNICATIONS | DOI: 10.1038/ncomms10678
a
c
b
b
GFP
GNG
Gr64f
Gr5a
MtN
d
AC
MN
Gr5a-LexA
Gr64f-GAL4
PN
LexAop-GAL80
PN
PN
Gr5a
Gr64f
Gr5a
Gr64f
e
UAS-effector
c
d
e
f
PN
f
MN
Gr64f flp-out
g
Gr64f
Gr5a
Gr64f flp-out
Figure 3 | Two classes of anatomically distinct sweet taste receptor
neurons in the legs of Drosophila. (a,b) Expression patterns of Gr5a-GAL4
(a) and Gr64f-GAL4 (b). (c–e) Double labelling of Gr64f-GAL4 with UASmCD8::RFP (red) and Gr5a-LexA with LexAop-mCD8::GFP (green) in the GNG
(c), pro-, meso-, metathoracic ganglia (PN, MN and MtN) and abdominal
centre (AC) of the VNC (d) and fifth tarsal segment of the foreleg (e).
Expression in the GNG and VNC is widely overlapping (yellow). Note nonoverlapping expression in atGRNs (arrowheads in c and e; red) and
projections from the wings (arrow in d; green). (f,g) Single GRN flp-outs in
the VNC (f) and GNG (g) (red). Note the distinct projections from a stGRN
(f, arrow) and an atGRN (f,g arrowheads). Synapsin (ubiquitous synaptic
marker) staining shown in blue. Partial projections, scale bars, 20 mm (e) or
40 mm (a–d,f,g).
VNC terminals of the other tarsal GRNs. These results show that
sweet taste receptor neurons in the legs are classified into
two anatomically distinct groups: the ascending tarsal GRNs
(atGRNs) and the segmental tarsal GRNs (stGRNs).
atGRNs are required for feeding initiation. Because atGRNs
were labelled in all Gr-GAL4s that caused significant sugar
preference impairments (Fig. 2), we hypothesized that they are
crucial for sugar detection, and sought to manipulate them more
specifically. We used Gr5a-LexA to express GAL80, which binds
to GAL4 and suppresses its ability to activate transcription, to
silence Gr64f-GAL4 in cells that co-express Gr5a-LexA. This
approach genetically ‘subtracted’ labellar and stGRN expression
in Gr64f-GAL4 (Fig. 4a), allowing visualization of cells that
express Gr64f-GAL4 alone. For brevity, we refer to this genetic
subtraction approach as Gr(64f–5a) hereafter. Gr(64f–5a)
specifically marked the atGRNs (Fig. 4b–f) and four cells in the
LSO (Supplementary Fig. 3), and revealed that the atGRNs
innervate a pair of short, distal-most ventral taste hairs beneath
the claws (Fig. 4c,d). These are likely the taste hairs recently
termed 5V1 (ref. 25) or f5v (ref. 4).
We next used Gr(64f–5a) to drive Kir2.1 expression, and
addressed the requirement for the atGRNs in sugar preference.
4
Figure 4 | Anatomy of atGRNs in the periphery and CNS. (a) Subtraction
of Gr5a-LexA expression from Gr64f-GAL4 with LexAop-GAL80 restricts
UAS-effector expression to non-overlapping GRNs. (b–f) Expression
pattern of Gr(64f–5a) in the foreleg (b), the fifth tarsal segment (c,d), the
GNG (e) and the VNC (f). UAS-mCD8::GFP, orange; Synapsin, blue; scale
bars, 40 mm. (b–d) Only 1–2 pairs of atGRNs were labelled in the forelegs.
atGRNs have cell bodies in the fifth tarsal segment (arrowheads) and
innervate a distinct pair of ventral sensilla in the distal part of the foreleg
(arrows). (e) Input to the GNG in Gr(64f–5a) flies derives from the VNC
(arrowhead). GFP was not detected in fibres projecting from the labellum.
(f) Tarsal fibres project to the VNC and ascend via the cervical connective
to the GNG (atGRNs, arrowheads).
We found a strong, albeit incomplete, reduction in sucrose
preference across the concentration range (Fig. 5a), suggesting
that atGRNs are not tuned to specific sugar concentrations. In
contrast, blocking the labellar and stGRNs with Gr5a-GAL4
yielded a more modest effect (Fig. 5b). The requirement for
Gr(64f–5a) cells is consistent with the strong preference
impairments with Gr61a-GAL4, Gr64e-GAL4 and Gr64f-GAL4,
which all label the atGRNs (Fig. 2). Furthermore, subtracting
Gr5a-LexA from Gr61a-GAL4 and blocking the Gr(61a–5a) cells
impaired preference to the same extent as the Gr(64f–5a)
blockade (Supplementary Fig. 4). Gr43a-GAL4 also labels
atGRNs, but blocking with this line did not alter sucrose
preference (Supplementary Fig. 5). However, Gr43a-GAL4 also
labels multiple cells outside the three main taste organs, which are
NATURE COMMUNICATIONS | 7:10678 | DOI: 10.1038/ncomms10678 | www.nature.com/naturecommunications
�ARTICLE
NATURE COMMUNICATIONS | DOI: 10.1038/ncomms10678
***
0.25
**
***
0
0.5
1
1.5
[Sucrose] (M)
Driver line control
2
0.25
0.1
Gr(64f-5a) block
PER probability
0.5
0.25
0
0
0.5
1
1.5
[Sucrose] (M)
Driver line control
2
10
0
1,000
e
e
a)
in
in
r l trol 4f–5 ock
r l ol
e
to ntr
iv on r(6 bl
c
o
r
fe c
D c
G
Ef
Effector line control
f
1
0.5
0.3
0.2
0.25
0.1
0.1
10
1,000
[Sucrose] (mM)
Gr5a-GAL4 block
0.5
0.4
0.75
0
0.001
**
0.1
d
1
0.3
0.2
**
[Sucrose] (mM)
0.75
PI
***
0.5
0
0.001
0
0.5
0.4
0.75
LI
0.5
1
LI
PI
0.75
b
e
c
1
PER probability
a
Effector line control
0
e
4
e
in
in
AL k
r l trol
r l trol
G loc
e
o
t
–
v
n
n
i o
c
a b
fe co
Dr c
r5
Ef
G
Figure 5 | atGRNs are involved in multiple appetitive behaviours. (a) Sucrose PI was significantly impaired at 0.5, 1 and 2 M on blocking Gr(64f–5a)
cells (Kruskal–Wallis test; Dunn’s post test; **Po0.01; ***Po0.001). n ¼ 9–21 per group. Driver line control Gr64f-GAL4/ þ , Gr(64f–5a) block Gr5aLexA/ þ ; Gr64f-GAL4/LexAop-GAL80; UAS-Kir2.1/ þ , effector line control Gr5a-LexA/ þ ; LexAop-GAL80/ þ ; UAS-Kir2.1/ þ . (b) Sucrose preference
was not significantly impaired on blocking Gr5a-GAL4 cells (Kruskal–Wallis test; Dunn’s post test; P40.05). n ¼ 11–21 per group. Driver line control
Gr5a-GAL4/ þ , Gr5a-GAL4 block Gr5a-GAL4/UAS-Kir2.1, effector line control UAS-Kir2.1/ þ . (c) Tarsal PER was significantly impaired at 1 and
10 mM on blocking Gr(64f–5a) cells (Kruskal–Wallis test; Dunn’s post test; **Po0.01; ***Po0.001). n ¼ 20–50 flies per group. (d) PER after tarsal
stimulation was not significantly impaired on blocking Gr5a-GAL4 cells (Kruskal–Wallis test; Dunn’s post test; P40.05). n ¼ 35–58 flies per group.
(e) Short-term appetitive olfactory memory was abolished on blocking subtraction cells (LI, learning index; one-way analysis of variance (ANOVA);
Bonferroni’s multiple comparison test; **Po0.01). n ¼ 11–12 per group. (f) Short-term appetitive olfactory memory was unaffected on blocking
Gr5a-GAL4 cells (one-way ANOVA; Bonferroni’s multiple comparison test; P40.05). n ¼ 9–10 per group. Results are medians, with the error bars
indicating the first/third quartile (a,b) or means±s.e.m. (c–f).
not labelled by Gr64f-LexA (Supplementary Fig. 5), and these
off-target cells can improve appetitive performance26.
To segregate the contribution of tarsal GRNs from that of the
other organs, we used the proboscis extension reflex (PER)
assay with tarsal stimulation7,27. In accordance with the sugar
preference results, PER in response to sucrose solutions of
varying concentrations was significantly impaired when atGRNs
were blocked with Gr(64f–5a) (Fig. 5c). In contrast, blocking
stGRNs with Gr5a-GAL4 caused a smaller but statistically not
significant decrease of PER (Fig. 5d). Interestingly, PER was
abolished when the labellum of the Gr5a-GAL4/UAS-Kir2.1 fly
was stimulated with a 200-mM sucrose solution (Supplementary
Fig. 6a), whereas the blockade with Gr(64f–5a) did not
significantly alter PER on stimulation of the labellum with
sucrose (Supplementary Fig. 6b). Taken together, these results
support the idea that atGRNs are important for initiating feeding
after encountering food.
Apart from driving early appetitive responses, sugar ingestion
acts as a reward and induces appetitive memory28. Given the
important role of atGRNs in feeding initiation, we next
considered the significance of different subsets of sweet taste
receptor neurons for sugar reward. We used sucrose as a reward,
and blocked distinct sweet taste GRNs with Gr(64f–5a) and Gr5aGAL4. Blocking the atGRNs greatly reduced short-term olfactory
memory (Fig. 5e), while blocking the labellar GRNs and the
stGRNs had no significant effect (Fig. 5f). We excluded defects in
olfactory perception and/or choice by testing the same flies in
aversive memory with the same odours (Supplementary Fig. 7).
These results suggest that the early appetitive responses
controlled by atGRNs are important for sugar reward. The
stGRNs should contribute to other aspects of the sugar response.
stGRNs are required for locomotion suppression. When we
blocked stGRNs and tested for sugar preference (Figs 2 and 5),
we noted that the flies tended to be restless even on sugar in
contrast to control flies that exhibited very little movement. We
therefore decided to quantify fly locomotion in response to sugar.
To avoid the complication of a binary choice, the entire arena was
covered with either water or sugar for locomotion measurements
(Fig. 6a–d).
To quantify locomotor activity, we developed software to detect
flies in each video frame and to calculate the linear and absolute
angular velocity of each fly between consecutive frame pairs
(Fig. 6e,f; Methods). These two behavioural variables represent
sugar-induced arrest of walking and turning, respectively. We
evaluated the accuracy in assigning fly identity in two frames by
examining more than 1,000 fly pairs from random frame pairs
and videos. Identity was correctly assigned in the majority of the
cases (error rate 0.7%). The orientation and position of the flies
were also accurately estimated, with the average errors in body
axis and centroid position being 2.2±0.2° and 0.108±0.006 mm
(B5% of body length).
Locomotion of wild-type (Canton S) flies was greatly reduced
in the presence of 2 M sucrose (Fig. 6a–d). On water, the average
walking and turning velocity were initially high, dropped
gradually and stabilized after 20–30 s (Fig. 6g,h). The high
locomotor activity was presumably because of a startle response
NATURE COMMUNICATIONS | 7:10678 | DOI: 10.1038/ncomms10678 | www.nature.com/naturecommunications
5
�ARTICLE
NATURE COMMUNICATIONS | DOI: 10.1038/ncomms10678
a
c
b
Water
d
Sugar
x + 1 (s)
∆x
t1
t0
Linear velocity
(mm s–1)
g
e
i
40
Linear velocity
(mm s–1)
x
Water
30
Sugar
20
10
0
0
10
20
30
40
Times (s)
50
∆�
6
3
***
0
Water Sugar
j
240
Water
180
Absolute angular
velocity (o s–1)
t0
Absolute angular
velocity (o s–1)
t1
9
60
h
f
12
Sugar
120
60
0
0
10
20
30
40
50
60
100
75
***
50
25
0
Water Sugar
Times (s)
Figure 6 | Sugar suppresses the locomotor activity of hungry flies. (a–d) Locomotion behaviour of starved wild-type flies in the absence (a,b) or
presence (c,d) of 2 M sucrose during a 1-s interval (x ¼ 55 s in a and 57 s in b). Flies are colour-coded according to time. Blow-up panels show locomotion
of selected flies in the absence (b) and presence (d) of sugar. Scale bars, 3 mm. (e,f) The linear (e) and angular (f) velocity of flies were calculated by fitting
ellipses to flies and computing the changes in the centroid position (Dx) and the major axis’ angle (Dy), respectively. (g,h) Time series of the average linear
velocity (g) and the average absolute angular velocity (h) of all flies in the absence (grey; n ¼ 12) or presence (black; n ¼ 11) of 2 M sucrose. (i,j) Average
linear velocity (i) and average absolute angular velocity (j) of all flies between 30 and 60 s of the experiment in the absence (light grey; n ¼ 12) or presence
(dark grey; n ¼ 11) of 2 M sucrose. Sucrose significantly reduced both linear and angular velocity (Mann–Whitney U-tests; ***Po0.001). Results are
medians, with the error bars indicating the first/third quartile.
caused by fly introduction into the arena. In the presence of
sugar, flies showed significantly lower activity throughout the
experiment (Fig. 6g,h). To quantify the sugar-induced suppression in locomotion at the steady state, we pooled the average
linear velocity and the average absolute angular velocity from
30 to 60 s (Fig. 6i,j). Both of these behavioural variables were
significantly reduced in the presence of sugar.
Strikingly, blocking the cells in Gr5a-GAL4 abolished the
sugar-induced suppression of turning (Fig. 7d). The same cells
were also required for sugar-induced walking suppression
(Supplementary Fig. 8a). As Gr5a-GAL4 labels both the labellum
and stGRNs, we introduced otd-nls-FLPo (ref. 29), which is
expressed only in the head30, and tub4GAL804 to limit
transgene expression to the labellum. In contrast to the
Gr5a-GAL4/UAS-Kir2.1 flies, flies with silenced labellar neurons
reduced their locomotion on sugar (Fig. 7h and Supplementary
Fig. 8b), suggesting that stGRNs are required for locomotion
inhibition upon sugar detection. In contrast, flies with blocked
atGRNs showed sugar-induced suppression of walking and
turning (Fig. 7l and Supplementary Fig. 8c), despite their
critical role in feeding initiation (Fig. 5). Taken together, our
results highlight a functional dissociation of sweet taste receptor
neurons in the tarsus. Both atGRNs and stGRNs are required for
early appetitive responses, but the atGRNs are critical for feeding
initiation, whereas the stGRNs are involved in the locomotion
suppression upon food encounter.
6
Sugar preference integrates both early appetitive responses. To
mechanistically understand how different sensory inputs are
integrated to drive choice in the sugar preference assay (Fig. 1),
we devised a dynamic-state transition model to mathematically
predict PIs. We assigned flies to the mutually exclusive ‘free to
walk’ and ‘feeding’ states on the sugar and water sides, for a total
of four states (Fig. 8a). By definition, only ‘free to walk’ flies can
cross the border between sugar and water (FS and FW in Fig. 8a).
‘Free to walk’ flies can also transition to a ‘feeding’ state on the
same side (S and W in Fig. 8a). Transitions between states are
controlled by certain rates (constants k in Fig. 8a).We equated the
transition rates between the two ‘free to walk’ states to the linear
velocities on sugar and water (Supplementary Fig. 8) and refer to
their sugar/water ratio as ‘speed ratio’. We also reasoned that
the ratio of the two transition rates for the ‘feeding’ and the
corresponding ‘free to walk’ state (kin/kout in Fig. 8a) depends on
stimulus affinity. Therefore, we derived the transition ratios from
the PER data (Fig. 5c,d). For brevity, we will refer to the ratio of
sugar/water affinities as ‘affinity ratio’.
We first examined how the affinity and speed ratios influence
PI in the sugar preference assay by simulating it for different
values of the two parameters (Fig. 8b). In line with our neuronal
silencing results (Fig. 5a,b), sugar preference depended on both
parameters, but the dependence on affinity was greater. For
quantitative predictions, we first determined the free parameters
of the model with data from genetic controls. Consequently, we
NATURE COMMUNICATIONS | 7:10678 | DOI: 10.1038/ncomms10678 | www.nature.com/naturecommunications
�ARTICLE
NATURE COMMUNICATIONS | DOI: 10.1038/ncomms10678
inputted experimental data of PER and sugar-dependent
locomotion suppression (from Fig. 5c,d and Supplementary
Fig. 8) into our model to predict the dose–response curves of
preference for the Gr5a-GAL4 and Gr(64f–5a) blockades
(Fig. 8c,d). The outputs of the model showed good agreement
with the experimental data, demonstrating that the model can
make good quantitative predictions. Finally, we investigated how
wild-type sugar preference is affected when sugar affinity and/or
x
a
x+0.5 (s)
c
Sugar
b
Driver line
control
d
Gr5a-GAL4
block
Absolute angular
velocity (o s–1)
100
Effector line
control
ns
80
***
60
***
40
20
0
Sugar
Water
x
e
x+0.5 (s)
g
Sugar
f
Labellum
block
Driver line
control
h
Effector line
control
Absolute angular
velocity (o s–1)
**
60
*
***
40
20
Sugar
Water
x
x+0.5 (s)
k
j
Sugar
i
Driver line
control
Absolute angular
velocity (o s–1)
Discussion
Insects have multiple taste organs distributed throughout the
body, but the functional significance of this organization has been
unclear. We therefore utilized sweet taste receptor neurons in
Drosophila melanogaster as a model to study this question and
showed that GRNs in different taste organs, or even within the
same organ, have functional specialization. Sweet taste receptor
neurons in the legs, but not the labellum or LSO, are necessary for
the early appetitive response to sugar (Fig. 2). Using a genetic
subtraction approach (Fig. 4) and three different paradigms of
appetitive behaviour (Fig. 5), we showed that the atGRNs, a small
subset of tarsal GRNs, are critical for feeding initiation. The other
subset of tarsal sweet receptors that terminate in the VNC,
stGRNs, control locomotion arrest on encountering sugar (Figs 6
and 7). We devised a model of sugar preference, which predicts
that both appetitive responses influence sugar preference and that
loss of both is required to generate ‘sugar-blind’ flies (Fig. 8).
Taken together, our data demonstrate that the atGRNs and
stGRNs are preferentially tuned to distinct facets of the early
appetitive response. However, more detailed characterization of
the receptor–ligand relationships in the legs with regards to sugar
choice should await further experimentation.
The roles of atGRNs and stGRNs are unlikely to be mutually
exclusive. For example, the atGRNs may affect locomotion
directly with collaterals in the VNC (for example, Figs 3f and 4f)
and/or indirectly through PER, as proboscis extension was
recently shown to negatively regulate walking19. On the other
80
0
l
locomotion suppression are lost (affinity and/or speed rations of
one, Fig. 8e). Again, loss of affinity had a greater effect than lack
of locomotion suppression. Intriguingly, sugar preference was
abolished only if both responses were lost. This correctly predicts
the lack of sugar preference observed with Gr61a-GAL4 and
Gr64f-GAL4 silencing (Fig. 2) and highlights the nonlinear
interaction between atGRNs and stGRNs. In conclusion, our
model makes accurate predictions based on few assumptions and
therefore captures key aspects of choice behaviour.
Gr(64f–5a)
block
Effector line
control
100
**
80
60
***
***
40
20
0
Water
Sugar
Figure 7 | stGRNs are required for sugar-dependent turning suppression.
(a–c) Examples of locomotion of (a) Gr5a-GAL4/ þ , (b) Gr5a-GAL4/UASKir2.1 and (c) UAS-Kir2.1/ þ flies during half-second intervals (x ¼ 46.4 s in
a, 55.5 s in b and 50 s in c). Flies are colour-coded according to time. Scale
bars, 3 mm. (d) Average absolute angular velocity of all flies between 30
and 60 s of the experiment in the absence (light grey, n ¼ 15–16) or
presence (dark grey; n ¼ 16–17) of 2 M sucrose. Sucrose significantly
reduced angular velocity for genetic controls, but not for the experimental
group (Mann–Whitney U-tests; ***Po0.001; not significant P40.05).
(e–g) Examples of locomotion of (e) Gr5a-GAL4/ þ ; tub4GAL804/ þ ,
(f) Gr5a-GAL4/otd-nls-FLPo; tub4GAL804/UAS-Kir2.1 and (g) otd-nlsFLPo/ þ ; UAS-Kir2.1/ þ flies during half-second intervals (x ¼ 56 s in e,
51.8 s in f and 31.6 s in g). Flies are colour-coded according to time. Scale
bars, 3 mm. (h) Average absolute angular velocity of all flies between 30
and 60 s of the experiment in the absence (light grey, n ¼ 13–14) or
presence (dark grey; n ¼ 13–14) of 2 M sucrose. Sucrose significantly
reduced angular velocity for all groups (Mann–Whitney U-tests;
***Po0.001; **Po0.01; *Po0.05). (i–k) Examples of locomotion of
(e) Gr64f-GAL4/ þ , (f) Gr(64f–5a) block and (g) the associated effector
line control flies during half-second intervals (x ¼ 49.5 s in i, 47.6 s in j and
51.7 s in k). Flies are colour-coded according to time. Scale bars, 3 mm.
(l) Average absolute angular velocity of all flies between 30 and 60 s of the
experiment in the absence (light grey, n ¼ 8–11) or presence (dark grey;
n ¼ 9–11) of 2 M sucrose. Sucrose significantly reduced angular velocity for
all groups (Mann–Whitney U-tests; ***Po0.001; **Po0.01). Results are
medians, with the error bars indicating the first/third quartile.
NATURE COMMUNICATIONS | 7:10678 | DOI: 10.1038/ncomms10678 | www.nature.com/naturecommunications
7
�ARTICLE
NATURE COMMUNICATIONS | DOI: 10.1038/ncomms10678
a
c
1
0.8
PI
kSW
FW
FS
kSin
S
Experimental
Predicted
0.6
0.4
kSW
kSout
Gr5a-GAL4 blocking
0.2
kWout
kWin
0
–4
W
d
1
0.8
–3 –2 –1 0
1
Log[sucrose]
2
3
2
3
2
3
Gr(64f-5a) blocking
Experimental
Predicted
Water
PI
Sugar
0.6
0.4
0.2
6
0
–4 –3 –2 –1 0
1
Log[sucrose]
4
e
2
0
1
0.8
0.6
0.4
0.2
Speed ratio
0
PI
1
0.8
0.6
0.4
0.2
0
PI
Log [affinity ratio]
b
1 Control
Speed ratio =1
0.8 Affinity ratio =1
Speed ratio =1
0.6 Affinity ratio =1
0.4
0.2
0
–4 –3 –2 –1 0
1
Log[sucrose]
Figure 8 | Mathematical model of sugar preference. (a) Schematic of the model. Flies can transition between ‘free to walk’ states (FS and FW) and
‘feeding’ states (S and W) on the sugar and water sides of the sugar preference assay. All transitions are reversible (bidirectional arrows) and controlled by
constant transition rates k. (b) Effect of the sugar/water speed ratio and sugar/water affinity ratio on sugar PI. (c,d) Quantitative predictions of the model
for the Gr5a-GAL4 (c) and Gr(64f–5a) (d) blockades and comparison with the corresponding experimental data (open circles). (e) Effect of loss of sugarinduced locomotion suppression (blue), loss of sugar affinity (red) and both (magenta) on the PIs of control flies (black).
hand, blocking stGRNs with Gr5a-GAL4 gave trends of impairment in sugar preference and PER (Figs 2 and 5). The
involvement of stGRNs in these behaviours is consistent with
previous studies using activation and inhibition with Gr5a-GAL4
(refs 7,31), suggesting that stGRNs can indirectly relay sweet taste
information to the GNG. Remarkably, sugar-induced suppression
of walking is controlled by the stGRNs (Fig. 7 and Supplementary
Fig. 8). The projection of the stGRNs terminates exclusively in
the VNC (Fig. 3), and may have better access to the VNC circuits
that directly control locomotion. As we did not find direct
connections between stGRN terminals and leg motor neurons,
the stGRNs may suppress locomotion using unidentified local
circuits. Because detection of food promotes multiple behaviours,
functional specialization in tarsal GRNs is an effective way to
coordinate the initial responses. We propose that stGRNs are
tuned to suppressing competing behaviours such as locomotion,
while atGRNs promote the change to the feeding state through
PER (Fig. 8).
The importance of tarsal GRNs in sugar choice (Fig. 2) fits well
with the fact that legs are typically the first appendage to contact
food. Recent physiology studies identified hypersensitive sweet
taste GRNs in the fifth tarsal segment4,25. According to their
innervation of taste hairs, these are likely the atGRNs (Fig. 4c,d).
Arrangement of GRNs that are sensitive and important for
appetitive behaviour in the ventral tip of the tarsus is an
appropriate cellular configuration, given the maximal accessibility
to food. The direct projection of the atGRNs to the GNG may
8
further ensure rapid and efficient feeding initiation. Bees also
have taste hairs with very high sugar sensitivity in their tarsi32
and antennae33, which are presumably the first organs to detect
nectar. Another taste-driven behaviour, tapping of the female
abdomen by male flies during courtship, involves GRNs
specifically on the dorsal area of the forelegs34. Taken together,
these examples suggest that optimization of taste hair position
with respect to function is a general principle in insect gustation.
Tarsal GRNs are stimulated as soon as a fly steps on tastants
and may therefore be important for early gustatory responses
across taste qualities. In accordance, bitter GRNs in the legs, but
not the proboscis, are required for aversion to a bitter chemical15.
On the other hand, GRNs in the labellum and pharynx come into
play in later stages of feeding and may have distinct functions. In
line with this idea, sweet taste receptor neurons in the LSO and
ventral cibarial sense organ drive food choice in a longer-lasting
(2 h) assay, presumably by prolonging ingestion17. Similarly, the
GRNs in the labellum might be necessary to guide the mouth part
to a food source more accurately or to open the labial palps with
greater efficiency than that observed after tarsal stimulation.
Because taste organs are differentially represented in the brain35
and send projections to discrete clusters in the CNS7,14, they most
likely contribute to distinct aspects of feeding behaviour.
Future studies focusing on fine neuronal manipulations,
detailed characterization of appetitive behaviours and a
mechanistic view of their interplay will promote understanding
of the neuroethology of feeding.
NATURE COMMUNICATIONS | 7:10678 | DOI: 10.1038/ncomms10678 | www.nature.com/naturecommunications
�ARTICLE
NATURE COMMUNICATIONS | DOI: 10.1038/ncomms10678
Methods
Fly strains.
The following transgenic strains of D. melanogaster in a w1118 background were used for crosses: y w hsp70-flp; Sp/CyO; TM2/TM6b (ref. 36);
UAS4CD2 y þ 4CD8-GFP (ref. 24; original donor Gary Struhl); w Gr5a-LexA;
Bl/CyO; TM2/TM6b (ref. 37); w; LexAop-GAL80 in attP40 (gift from B. Pfeiffer and
G. Rubin, Bloomington #32214); w; Pin/CyO; UAS-mCD8::GFP (ref. 38); w;;
UAS-Kir2.1::eGFP (ref. 22), y w LexAop-mCD8::GFP UAS-mCD8::RFP (ref. 39;
gift from B. Pfeiffer and G. Rubin, Bloomington #32229); w; UAS-mCD8::RFP
(gift from Ilona Kadow); w;; LexAop-rCD2::GFP (ref. 26); w; otd-nls-FLPo (ref. 29);
w; Bl/CyO; tub4GAL804 (Bloomington #38881); w; Gr5a-GAL4/CyO; Dr/TM3
(ref. 8); w; Sp/CyO; Gr43a-GAL4/TM3 (ref. 8); w; Gr43a-GAL4 (ref. 26);
w; Gr61a-GAL4/CyO; Dr/TM3 (ref. 8); w; Sp/CyO; Gr64a-GAL4/TM3 (ref. 8);
w; Sp/CyO; Gr64c-GAL4/TM3 (ref. 8); w; Sp/CyO; Gr64d-GAL4/TM3 (ref. 8);
w; Gr64e-GAL4/CyO; Dr/TM3 (ref. 8); w; Gr64f-GAL4/CyO; MKRS/TM2 (ref. 8);
w;; Gr64f-LexA (ref. 26); and white (w1118). We used Canton S flies as the wild-type
strain, but the appropriate generic controls (in w1118 background) for comparisons.
All flies were kept at 25 °C and 60% relative humidity on standard cornmeal
medium under a 14 h/10 h light/dark cycle.
Immunohistochemistry. Brains, VNCs, proventriculi, uteri and proboscises of
2- to 8-day-old adult female Drosophila were dissected as previously described40,
fixed for 45 min at room temperature in 4% formaldehyde in phosphate-buffered
saline (PBS) with 0.1% Triton X-100 (PBS-Tx), washed with 0.1% PBS-Tx and
stained using antiserum to green fluorescent protein (GFP; rabbit, 1:1,000,
Invitrogen; or rat monoclonal 3H9, 1:100, Chromotek) and red fluorescent protein
(RFP; rabbit 1:100, Clontech). Fixation and immunostaining was avoided for
forelegs and some proboscis samples (Supplementary Figs 2 and 5); these were
imaged immediately after dissection. To visualize synaptic neuropil regions, mouse
monoclonal antibody for Synapsin41 (1:100, Developmental Studies Hybridoma
Bank; Iowa City, IA) or rat monoclonal antibody for N-Cad (1:100, Developmental
Studies Hybridoma Bank; Iowa City, IA) were used. For detection of primary
antisera, Alexa 488-tagged goat anti-rabbit (1:1,000, Invitrogen), Alexa 488-tagged
goat anti-rat (1:200, Invitrogen), Cy3-tagged goat anti-mouse (1:250, Jackson
Immunoresearch), Cy3-tagged goat anti-rabbit (1:250, Jackson Immunoresearch),
Cy3-tagged goat anti-rat (1:200, Jackson Immunoresearch) and Alexa 633-tagged
goat anti-mouse antisera (1:250, Invitrogen) were used. Preparations were mounted
in Vectashield (Vector; Burlingame, CA), 70% glycerol (Sigma-Aldrich) in PBS or
70% 2, 2-thiodiethanol (Sigma-Aldrich) in PBS, and imaged with either an
Olympus FV-1000 (brains and VNCs) or a Zeiss LSM 780 confocal microscope
including a T-PMT device (transmitted light detector for bright field images, for
some tarsi and proboscises). To generate single-cell flp-outs, freshly eclosed flies
carrying hsp70-flp, UAS4CD2 y þ 4CD8-GFP and Gr64f-GAL4 were heat-shocked
in a 37 °C water bath for 30 min and dissected 4–5 days later. All images were
processed using Fiji software42.
Behavioural experiments. Genetic crosses were raised at 25 °C. F1 progeny were
transferred to fresh food vials and were allowed to feed for at least 24 h before
starvation. Flies were subsequently starved in moistened vials until a mortality rate
of roughly 20% was achieved. As different genotypes vary in starvation resistance,
average starvation times ranged between 31 and 49 h. All flies were 3–7 days old at
the time of the experiment. Testing times were distributed throughout the day to
minimize effects of circadian rhythm on performance. Behavioural experiments
were performed at 25.0±0.3 °C and 60–70% relative humidity.
Sugar preference assay. Mixed populations of males and females were tested for
sucrose preference (Calbiochem) in a circular arena (| 76 mm). Each half of the
arena was covered with a semicircular piece of filter paper that had previously been
soaked with either 350 ml of water or 350 ml of a 0-, 0.1-, 0.5-, 1- or 2-M sucrose
solution; filter papers were subsequently allowed to dry. The walls of the arena were
covered with Fluon (Fluon GP1, Whitford Plastics Ltd., UK) to prevent flies from
climbing. After introduction, flies were allowed to choose between the two sides for
1 min. Fly behaviour was video-recorded from above (Canon EOS 500D). The
videos were processed using Matlab and Fiji softwares. Automatic fly counting was
done as previously described43, and the PI was calculated as:
PI ¼
triplicate, from lowest to highest concentration. Water was given after each
presentation to wash the tarsi and ensure that flies remained water-satiated
throughout. PER was scored as 0 or 1 (0: no extension; 1: extension). To
approximate the dose–response curve, we fitted the same equation as above.
Labellar PER was performed as described elsewhere27.
Olfactory learning. Flies were trained and tested for immediate appetitive
olfactory memory as previously described28,44. Odours (4-methylcyclohexanol and
3-octanol, diluted 1:80 and 1:100 in paraffin oil; Fluka, Germany) were presented in
odour cups with a diameter of 14 mm. A learning index was calculated as the mean
preference of two separate groups of reciprocally trained flies. In half of the
experiments the first presented odour was rewarded and in the other half, the
second presented odour was rewarded45. Aversive memory45 of starved flies
using the same odours served as controls for intact locomotion and odour
responses.
Quantification of fly locomotion. Videos were acquired as described above and
analysed in Matlab. First, the region of interest (circular arena) was selected and
coloured images were converted to greyscale. To distinguish flies from the
background, images were binarized by applying a user-defined threshold. The
binarized background (empty arena) was subtracted from all binarized images.
Resulting images were eroded and dilated to remove noise46. A cluster of
contacting pixels was labelled as one particle. For each particle, we computed its
area, its centroid, the diagonal length of its bounding box and the eccentricity of an
ellipse with the same second moments as the particle.
We calculated the likelihood for each particle representing a fly based on the
diagonal lengths of the bounding box and eccentricity. Particles with low
likelihood represented either flies for which the selected threshold was not
appropriate, or multiple flies that were merged because of close proximity. We
estimated the number of flies in low-likelihood particles by dividing their area
with the average area of the high-likelihood particles. Then, we re-adjusted the
threshold using an iterative process, until the number of particles in the region
matched the estimated number of flies. If this did not occur after forty iterations,
we excluded those low-likelihood particles. Ellipses were fitted to all particles as
described elsewhere47.
We then used a closest-neighbour approach to identify individual flies in every
pair of consecutive frames. First, we defined a pair set as all the possible pairs of
ellipses between the two frames and computed the distances between the
centroids of all ellipse pairs. Second, we determined the smallest distance and
identified the corresponding ellipses as a pair. Third, we eliminated that ellipse
pair from the pair set. We repeated the second and third steps until the pair set
was emptied. We set the maximum changes in position and angle of paired
ellipses in consecutive frames to B7 mm and 90°, respectively. Using this
information, the change in position, angle, linear velocity, angular velocity and
absolute angular velocity of each ellipse was computed. The Matlab script is
available on request.
All computations were carried out on a parallel computer LX406Re-2,
which consists of 68 nodes. Each node is equipped with a main storage of 128 GB
and two groups of 12-core Intel Xeon processors E5-2695v2. The Matlab
script outlined above was run on one node. In each node, parallel processing
with automatic parallelization, Open Multi-Processing or Message Passing
Interface can be operated up to 24 parallels. The maximum computing
performance per node becomes 460.8 GFLOPS (Giga Floating-point Operations
Per Second).
Mathematical model of sugar preference. We assigned flies in the sugar preference assay (Fig. 1) to four states: free to walk on the sugar side (FS); free to walk
on the water side (FW); feeding on the sugar side (S); and feeding on the water side
(W) (Fig. 8a). Transitions between states were reversible and controlled by certain
rates (constants k). The PI was obtained using:
PI ¼
½S� þ ½FS� � ½FW� � ½W�
½S� þ ½FS� þ ½FW� þ ½W�
The number of flies in each state was obtained by solving the differential equations
describing the transitions:
d½S�
¼ � kSout ½S� þ kSin ½FS�
dt
ð # flies on sugar � # flies on waterÞ
ð # flies on sugar þ # flies on waterÞ
Pooled PI values (30–60 s) are presented for most experiments. To approximate the
dependence of the sugar preference on starvation time and/or sucrose
concentration, we fitted the following equation to the corresponding data:
d½FS�
¼ kSout ½S� � ðkSin þ kSW Þ½FS� þ kWS ½FW�
dt
axb
c þ xb
In this equation, x represents starvation time or sucrose concentration and
y represents PI.
Proboscis extension reflex. Flies were briefly anesthetized under CO2. Female
flies were selected and glued on their back on a coverslide with nail polish. Flies
were allowed to recover in a humidified chamber for at least 1 h before the
experiment. After recovery, flies were presented with water on their tarsi and were
allowed to drink ad libitum. Unresponsive flies were discarded. After the flies
stopped responding to water, sucrose solutions were presented on the tarsi in
d½FW�
¼ kSW ½FS� � ðkWS þ kWin Þ½FS� þ kWout ½W�
dt
y¼
d½W�
¼ kWin ½FW� � kWout ½W�
dt
We assumed an equilibrium, solved the differential equations and substituted into
the PI formula, thereby obtaining:
NATURE COMMUNICATIONS | 7:10678 | DOI: 10.1038/ncomms10678 | www.nature.com/naturecommunications
PI ¼
A þ 1 � ð1 þ DÞB
A þ 1 þ ð1 þ DÞB
9
�ARTICLE
NATURE COMMUNICATIONS | DOI: 10.1038/ncomms10678
Here ‘sugar affinity’ A ¼ kSin/kSout, ‘speed ratio’ B ¼ kSW/kWS and ‘water affinity’
D ¼ kWin/kWout. Because we never observed flies feeding on the water side, we set
the water affinity at an arbitrarily low level (D ¼ 0.001). We consequently examined
the relative contributions of sugar affinity and sugar-induced locomotion
suppression on PIs by varying parameters A and B (Fig. 8b).
To predict PIs for the Gr5a-GAL4 and Gr(64f–5a) blockades (Fig. 8c,d), we first
used data from genetic control experiments to determine values of A and B as
functions of sucrose concentration. We reasoned that PER on stimulation of the
tarsi with sucrose solutions recapitulated sugar affinity A. Therefore, A was derived
as a function of sucrose concentration from the PER data as follows. First, a
sigmoidal curve was fitted to the PER data using the equation:
PERðlog½sucrose�Þ ¼
1
1 þ expð � slopeðlog½sucrose� � thrdPER ÞÞ
where ‘slope’ and ‘thrdPER’ are the parameters of the sigmoid function. Second,
PER data were transformed to affinity using:
A¼c
PERðlog½sucrose� � thrdshift Þ
1 � PERðlog½sucrose� � thrdshift Þ
Here ‘thrdshift’ and c are correction factors that account for the different conditions
between the PER and sugar preference experiments (we acquired c ¼ 0.83 and
thrdshift ¼ 3.1). The transformation produced a sugar affinity A between zero and
infinity that is more appropriate for our model (A ¼ 0 when kSin ¼ 0 and A ¼ N
when kSout ¼ 0). The speed ratio B was calculated from the linear velocity data of
genetic controls in the presence or absence of 2 M sucrose. Like sugar affinity,
linear velocity was assumed to be a sigmoidal function of sucrose concentration. In
addition, contributions of sugar affinity A and speed ratio B to sugar preference
were quantified by simulating PIs of a theoretical sugar affinity mutant
(A ¼ D ¼ 0.001) and locomotion suppression mutant (B ¼ 1; Fig. 8e).
Statistics. Data were evaluated using Prism software (GraphPad, San Diego, CA)
as previously described48, employing Shapiro–Wilk and Bartlett’s test. Data are
presented as means±s.e.m. if they are normally distributed and have equal
variances, and were tested with one-way analysis of variance and Bonferronicorrected pairwise comparisons. Data are presented as medians, with the lower and
upper error bars representing the first and third quartiles, respectively, if they are
not normally distributed and/or variances are not equal. In that case, we
applied the Kruskal–Wallis test and Dunn-corrected pairwise comparisons, the
Mann–Whitney U-test or the Wilcoxon signed-rank test to check for statistically
significant differences. An exception was made for PER data, which are presented
as means±s.e.m. for ease of visualization, even though they are not normally
distributed. However, we applied nonparametric statistics to check differences in
the PER data as described above. Significance levels are indicated as follows: NS
P40.05; *Po0.05; **Po0.01; ***Po0.001.
References
1. Lu, B., LaMora, A., Sun, Y., Welsh, M. J. & Ben-Shahar, Y. ppk23-Dependent
chemosensory functions contribute to courtship behavior in Drosophila
melanogaster. PLoS Genet. 8, e1002587 (2012).
2. Thistle, R., Cameron, P., Ghorayshi, A., Dennison, L. & Scott, K. Contact
chemoreceptors mediate male-male repulsion and male-female attraction
during Drosophila courtship. Cell 149, 1140–1151 (2012).
3. Toda, H., Zhao, X. & Dickson, B. J. The Drosophila female aphrodisiac
pheromone activates ppk23( þ ) sensory neurons to elicit male courtship
behavior. Cell Rep. 1, 599–607 (2012).
4. Ling, F., Dahanukar, A., Weiss, L. A., Kwon, J. Y. & Carlson, J. R. The
molecular and cellular basis of taste coding in the legs of Drosophila.
J. Neurosci. 34, 7148–7164 (2014).
5. Marella, S. et al. Imaging taste responses in the fly brain reveals a functional
map of taste category and behavior. Neuron 49, 285–295 (2006).
6. Thorne, N., Chromey, C., Bray, S. & Amrein, H. Taste perception and coding in
Drosophila. Curr. Biol. 14, 1065–1079 (2004).
7. Wang, Z., Singhvi, A., Kong, P. & Scott, K. Taste representations in the
Drosophila brain. Cell 117, 981–991 (2004).
8. Weiss, L. A., Dahanukar, A., Kwon, J. Y., Banerjee, D. & Carlson, J. R. The
molecular and cellular basis of bitter taste in Drosophila. Neuron 69, 258–272
(2011).
9. Zhang, Y. V., Ni, J. & Montell, C. The molecular basis for attractive salt-taste
coding in Drosophila. Science 340, 1334–1338 (2013).
10. Stocker, R. F. The organization of the chemosensory system in Drosophila
melanogaster: a review. Cell Tissue Res. 275, 3–26 (1994).
11. Dahanukar, A., Lei, Y. T., Kwon, J. Y. & Carlson, J. R. Two Gr genes underlie
sugar reception in Drosophila. Neuron 56, 503–516 (2007).
12. Miyazaki, T. & Ito, K. Neural architecture of the primary gustatory center of
Drosophila melanogaster visualized with GAL4 and LexA enhancer-trap
systems. J. Comp. Neurol. 518, 4147–4181 (2010).
13. Ito, K. et al. A systematic nomenclature for the insect brain. Neuron 81,
755–765 (2014).
10
14. Isono, K. & Morita, H. Molecular and cellular designs of insect taste receptor
system. Front. Cell. Neurosci. 4, 20 (2010).
15. Joseph, R. M. & Heberlein, U. Tissue-specific activation of a single gustatory
receptor produces opposing behavioral responses in Drosophila. Genetics 192,
521–532 (2012).
16. Pool, A. H. & Scott, K. Feeding regulation in Drosophila. Curr. Opin. Neurobiol.
29C, 57–63 (2014).
17. LeDue, E. E., Chen, Y. C., Jung, A. Y., Dahanukar, A. & Gordon, M. D.
Pharyngeal sense organs drive robust sugar consumption in Drosophila. Nat.
Commun. 6, 6667 (2015).
18. Schoofs, A. et al. Selection of motor programs for suppressing food intake
and inducing locomotion in the Drosophila brain. PLoS Biol. 12, e1001893
(2014).
19. Mann, K., Gordon, M. D. & Scott, K. A pair of interneurons influences the
choice between feeding and locomotion in Drosophila. Neuron 79, 754–765
(2013).
20. Brand, A. H. & Perrimon, N. Targeted gene expression as a means of altering
cell fates and generating dominant phenotypes. Development 118, 401–415
(1993).
21. Robertson, H. M., Warr, C. G. & Carlson, J. R. Molecular evolution of the insect
chemoreceptor gene superfamily in Drosophila melanogaster. Proc. Natl Acad.
Sci. USA 100(Suppl 2): 14537–14542 (2003).
22. Baines, R. A., Uhler, J. P., Thompson, A., Sweeney, S. T. & Bate, M. Altered
electrical properties in Drosophila neurons developing without synaptic
transmission. J. Neurosci. 21, 1523–1531 (2001).
23. Kwon, J. Y., Dahanukar, A., Weiss, L. A. & Carlson, J. R. A map of taste neuron
projections in the Drosophila CNS. J. Biosci. 39, 565–574 (2014).
24. Wong, A. M., Wang, J. W. & Axel, R. Spatial representation of the glomerular
map in the Drosophila protocerebrum. Cell 109, 229–241 (2002).
25. Miyamoto, T., Chen, Y., Slone, J. & Amrein, H. Identification of a Drosophila
glucose receptor using Ca2 þ imaging of single chemosensory neurons. PLoS
ONE 8, e56304 (2013).
26. Miyamoto, T., Slone, J., Song, X. & Amrein, H. A fructose receptor functions as
a nutrient sensor in the Drosophila brain. Cell 151, 1113–1125 (2012).
27. Shiraiwa, T. & Carlson, J. R. Proboscis extension response (PER) assay in
Drosophila. J. Vis. Exp. 193 (2007).
28. Tempel, B. L., Bonini, N., Dawson, D. R. & Quinn, W. G. Reward learning in
normal and mutant Drosophila. Proc. Natl Acad. Sci. USA 80, 1482–1486
(1983).
29. Asahina, K. et al. Tachykinin-expressing neurons control male-specific
aggressive arousal in Drosophila. Cell 156, 221–235 (2014).
30. Gao, Q. & Finkelstein, R. Targeting gene expression to the head: the Drosophila
orthodenticle gene is a direct target of the Bicoid morphogen. Development 125,
4185–4193 (1998).
31. Keene, A. C. & Masek, P. Optogenetic induction of aversive taste memory.
Neuroscience 222, 173–180 (2012).
32. de Brito Sanchez, M. G. et al. The tarsal taste of honey bees: behavioral and
electrophysiological analyses. Front. Behav. Neurosci. 8, 25 (2014).
33. de Brito Sanchez, M. G. Taste perception in honey bees. Chem. Senses 36,
675–692 (2011).
34. Koh, T. W. et al. The Drosophila IR20a clade of ionotropic
receptors are candidate taste and pheromone receptors. Neuron 83, 850–865
(2014).
35. Kirkhart, C. & Scott, K. Gustatory learning and processing in the Drosophila
mushroom bodies. J. Neurosci. 35, 5950–5958 (2015).
36. Xu, T. & Rubin, G. M. Analysis of genetic mosaics in developing and adult
Drosophila tissues. Development 117, 1223–1237 (1993).
37. Gordon, M. D. & Scott, K. Motor control in a Drosophila taste circuit. Neuron
61, 373–384 (2009).
38. Lee, T. & Luo, L. Mosaic analysis with a repressible cell marker
for studies of gene function in neuronal morphogenesis. Neuron 22, 451–461
(1999).
39. Pfeiffer, B. D. et al. Refinement of tools for targeted gene expression in
Drosophila. Genetics 186, 735–755 (2010).
40. Wu, J. S. & Luo, L. A protocol for dissecting Drosophila melanogaster brains for
live imaging or immunostaining. Nat. Protoc. 1, 2110–2115 (2006).
41. Klagges, B. R. et al. Invertebrate synapsins: a single gene codes for several
isoforms in Drosophila. J. Neurosci. 16, 3154–3165 (1996).
42. Schindelin, J. et al. Fiji: an open-source platform for biological-image analysis.
Nat. Methods 9, 676–682 (2012).
43. Schnaitmann, C., Vogt, K., Triphan, T. & Tanimoto, H. Appetitive and
aversive visual learning in freely moving Drosophila. Front. Behav. Neurosci. 4,
10 (2010).
44. Thum, A. S., Jenett, A., Ito, K., Heisenberg, M. & Tanimoto, H. Multiple
memory traces for olfactory reward learning in Drosophila. J. Neurosci. 27,
11132–11138 (2007).
45. Knapek, S., Gerber, B. & Tanimoto, H. Synapsin is selectively required for
anesthesia-sensitive memory. Learn. Mem. 17, 76–79 (2010).
NATURE COMMUNICATIONS | 7:10678 | DOI: 10.1038/ncomms10678 | www.nature.com/naturecommunications
�ARTICLE
NATURE COMMUNICATIONS | DOI: 10.1038/ncomms10678
46. Burger, W. & Burge, M. J. Digital Image Processing 177–178 (Springer, 2008).
47. Mulchrone, K. F. & Choudhury, K. R. Fitting an ellipse to an arbitrary shape:
implications for strain analysis. J. Struct. Geol. 26, 143–153 (2004).
48. Knapek, S., Sigrist, S. & Tanimoto, H. Bruchpilot, a synaptic active zone protein
for anesthesia-resistant memory. J. Neurosci. 31, 3453–3458 (2011).
S.A., P.S. and K.H. developed software for locomotion quantification; H.K. devised the
sugar preference model with contributions from H.T. and V.T.; H.T. and V.T. wrote the
paper with contributions from S.K., M.H., H.K. and S.A.
Acknowledgements
Supplementary Information accompanies this paper at http://www.nature.com/
naturecommunications
We thank Hubert Amrein, John Carlson, Barret Pfeiffer, Gerald M. Rubin, Kristin Scott,
Ilona Kadow, David Anderson and the Bloomington Stock Centre for fly stocks. We are
grateful to Shoh Asano for help in Matlab programming, and Jessika Binder and
Christian Garbers for developing preliminary software to estimate fly locomotion. We
thank Christine Damrau for setting up the sugar preference assay and Pavel Mašek for
sharing his expertise in the PER assay. This work was supported by the Bernstein Focus
Neurobiology of Learning from Bundesministerium für Bildung und Forschung
(01GQ0931/01GQ0932 to H.T.), Max-Planck-Gesellschaft (to H.T.), Deutsche
Forschungsgemeinschaft (TA 552/5-1 to H.T.), MEXT/JSPS KAKENHI (25890003,
26120705, 26119503 and 26250001 to H.T.) and Naito Foundation (to H.T.). V.T. is a
member of the International Max Planck Research School for Molecular and Cellular Life
Sciences.
Author contributions
H.T. designed and supervised the study; V.T. and S.K. acquired and analysed the
behavioural data; S.K., M.H., V.T. and A.A. acquired and analysed the anatomical data;
Additional information
Competing financial interests: The authors declare no competing financial interests.
Reprints and permission information is available online at http://npg.nature.com/
reprintsandpermissions/
How to cite this article: Thoma, V. et al. Functional dissociation in sweet taste receptor
neurons between and within taste organs of Drosophila. Nat. Commun. 7:10678
doi: 10.1038/ncomms10678 (2016).
This work is licensed under a Creative Commons Attribution 4.0
International License. The images or other third party material in this
article are included in the article’s Creative Commons license, unless indicated otherwise
in the credit line; if the material is not included under the Creative Commons license,
users will need to obtain permission from the license holder to reproduce the material.
To view a copy of this license, visit http://creativecommons.org/licenses/by/4.0/
NATURE COMMUNICATIONS | 7:10678 | DOI: 10.1038/ncomms10678 | www.nature.com/naturecommunications
11
�
 S. Knapek