2290
IEEE TRANSACTIONS ON MICROWAVE THEORY AND TECHNIQUES, VOL. 55, NO. 11, NOVEMBER 2007
Behavioral Thermal Modeling for
Microwave Power Amplifier Design
Julie Mazeau, Raphaël Sommet, Daniel Caban-Chastas, Emmanuel Gatard,
Raymond Quéré, Senior Member, IEEE, and Yves Mancuso
Abstract—System-level models simplify the analysis of complex RF systems, such as transmission-reception modules, by
expressing global input–output relationships. However, the development of high RF power models for nonlinear subsystems
requires the prediction of the distortion induced by low-frequency
memory effects such as self-heating effects. In this framework,
we present a new electrothermal behavioral model for power
amplifiers. This global model is based on the coupling between
a behavioral electrical model derived from the transistor-level
description of the amplifier and a thermal reduced model. This
model, implemented into a circuit simulator, allows to predict the
impact of the thermal effects in pulsed RF mode thanks to an
envelope transient analysis. This approach has also been validated
by measurements.
Index Terms—Behavioral electrothermal (BET) model, power
amplifier, reduced thermal model, Ritz vector approach, systemlevel model, Volterra series.
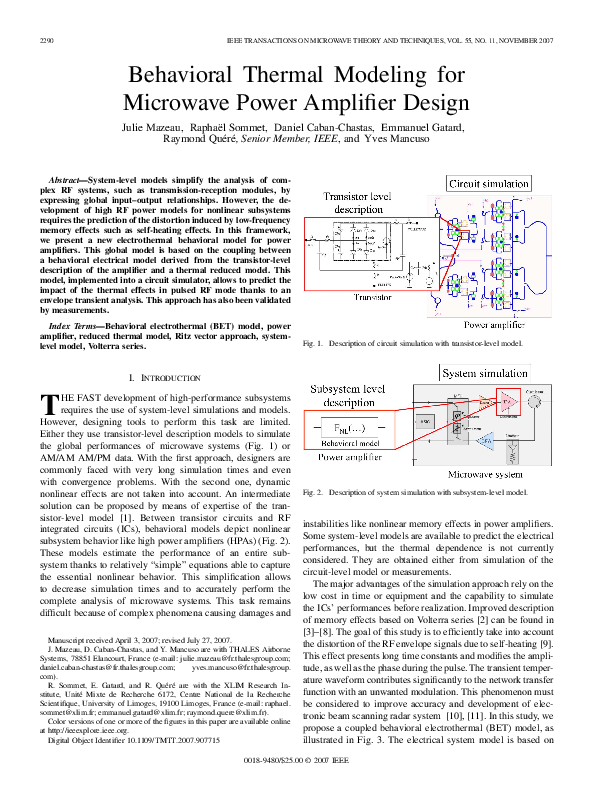
Fig. 1. Description of circuit simulation with transistor-level model.
I. INTRODUCTION
HE FAST development of high-performance subsystems
requires the use of system-level simulations and models.
However, designing tools to perform this task are limited.
Either they use transistor-level description models to simulate
the global performances of microwave systems (Fig. 1) or
AM/AM AM/PM data. With the first approach, designers are
commonly faced with very long simulation times and even
with convergence problems. With the second one, dynamic
nonlinear effects are not taken into account. An intermediate
solution can be proposed by means of expertise of the transistor-level model [1]. Between transistor circuits and RF
integrated circuits (ICs), behavioral models depict nonlinear
subsystem behavior like high power amplifiers (HPAs) (Fig. 2).
These models estimate the performance of an entire subsystem thanks to relatively “simple” equations able to capture
the essential nonlinear behavior. This simplification allows
to decrease simulation times and to accurately perform the
complete analysis of microwave systems. This task remains
difficult because of complex phenomena causing damages and
T
Manuscript received April 3, 2007; revised July 27, 2007.
J. Mazeau, D. Caban-Chastas, and Y. Mancuso are with THALES Airborne
Systems, 78851 Elancourt, France (e-mail: julie.mazeau@fr.thalesgroup.com;
daniel.caban-chastas@fr.thalesgroup.com;
yves.mancuso@fr.thalesgroup.
com).
R. Sommet, E. Gatard, and R. Quéré are with the XLIM Research Institute, Unité Mixte de Recherche 6172, Centre National de la Recherche
Scientifique, University of Limoges, 19100 Limoges, France (e-mail: raphael.
sommet@xlim.fr; emmanuel.gatard@xlim.fr; raymond.quere@xlim.fr).
Color versions of one or more of the figures in this paper are available online
at http://ieeexplore.ieee.org.
Digital Object Identifier 10.1109/TMTT.2007.907715
Fig. 2. Description of system simulation with subsystem-level model.
instabilities like nonlinear memory effects in power amplifiers.
Some system-level models are available to predict the electrical
performances, but the thermal dependence is not currently
considered. They are obtained either from simulation of the
circuit-level model or measurements.
The major advantages of the simulation approach rely on the
low cost in time or equipment and the capability to simulate
the ICs’ performances before realization. Improved description
of memory effects based on Volterra series [2] can be found in
[3]–[8]. The goal of this study is to efficiently take into account
the distortion of the RF envelope signals due to self-heating [9].
This effect presents long time constants and modifies the amplitude, as well as the phase during the pulse. The transient temperature waveform contributes significantly to the network transfer
function with an unwanted modulation. This phenomenon must
be considered to improve accuracy and development of electronic beam scanning radar system [10], [11]. In this study, we
propose a coupled behavioral electrothermal (BET) model, as
illustrated in Fig. 3. The electrical system model is based on
0018-9480/$25.00 © 2007 IEEE
�MAZEAU et al.: BEHAVIORAL THERMAL MODELING FOR MICROWAVE POWER AMPLIFIER DESIGN
2291
crease of the bandwidth and the convergence property. The extraction process requires only one-tone measurements or simulation providing the input signal is quasi-constant. Inconvenient
is the weak long-term memory effects prediction. The nonlinear
network is represented by a two-port circuit loaded by a
resistor. The reflected waves are neglected. Thus, only the
transmission parameter is considered [18] and is given by
Fig. 3. BET model.
(1)
Fig. 4. Complex envelope behavioral model.
a modified form of Volterra series to determine the isothermal
and the instantaneous
large-signal transmission parameter
. In order to deduce a precise transient
dissipated power
thermal model of the amplifier, a 3-D thermal finite-element
(FE) description has been performed. A reduced model based
on the Ritz vector approach is then applied to extract the thermal
[12]–[15]. A SPICE thermal equivalent subcirimpedance
cuit describes the exact analysis of the operating temperature
during an envelope transient simulation.
The first part of this paper is dedicated to the modified form
of the dynamic Volterra-series model equations [3], [16]–[18].
The development of the reduced thermal circuit is then applied
to a power amplifier. Finally, the results of the BET model implemented into the Agilent Advanced Design System (ADS)
circuit simulator are compared with measurement results. The
monolithic microwave integrated circuit (MMIC) power amplifier used in our example is based on an InGaP/GaAs HBT technology delivering 8 W for -band radar applications. However,
the described method is generic for any power amplifier and
pulsed RF operating modes.
is the input power wave and
is the static transmission parameter at central frequency of the modulation band.
is the first-order dynamic kernel at frequency.
width
is the
phase.
In this paper, we use the good prediction of the nonlinear
short-term memory effects and the easy characterization process
of this model. The thermal modulation is a long-term memory
effect and will be modeled out of the electrical model by the
reduced impedance model. Thus, the electrical system-level
model must be able to supply the average dissipated power
generated by the instantaneous self-heating to the thermal
model. Moreover, the thermal dependence will be explained in
.
the transmission parameter
B. Isothermal Static Model [19]
The increase of the operating temperature of the amplifier
generates a fall of the static current within the transistors. It is
the dominating thermal effect. Thus, at first, the thermal effects
are supposed to be independent of the spectral dispersion. Only
the static term of the dynamic Volterra series depends on the
is expressed by
temperature. The thermal variation of
as follows:
a differential term
(2)
II. ISOTHERMAL ELECTRICAL SYSTEM-LEVEL MODEL
The aim of such an approach is to provide an analytical function, which links subsystem input and output signals without
describing in detail all the elements of the circuit. System
modeling needs accurate formalism, particularly for nonlinear
memory effects. Classical Volterra series show convergence
problems when modeling strong nonlinearities. The dynamic
Volterra-series approach is more suited.
A. Dynamic Volterra Series
This formalism is based on a limited modulation band around
the carrier frequency [4], [16]–[18]. The convergence property
of the dynamic series is enhanced and allows to work only with
the input
and output
complex envelope signals. From
and
are real input–output signals and
is the
Fig. 4,
carrier frequency.
The first-order modified Volterra series model [3], [4] is applied to large -parameters signal description for radar application [18]. The main advantages of this description are the in-
(3)
is the ambient temperature.
is the uniform temperature
applied to the circuit without self-heating effects.
term allows to perform an easier extraction of the
The
model by separating the thermal dependence of the nonlinear
effect prediction. The static function interpolation is then more
precise and the errors can be easily detected. Moreover, this implementation offers the possibility to remove the influence of
self-heating effects if designers want to simulate only nonlinear
or short memory behaviors.
Likewise, the average dissipated power of HBT transistors
can be obtained by
(4)
�2292
IEEE TRANSACTIONS ON MICROWAVE THEORY AND TECHNIQUES, VOL. 55, NO. 11, NOVEMBER 2007
Fig. 5. Characterization of the thermal static term and the bias current.
Fig. 7. Neural-network structure with a single hidden layer of wavelet.
D. Neural-Network Approach
Several approaches allow to fit nonlinear functions [20], [21],
but the high performance of neural-network methods are particularly suited to approximate all discontinuities [22]–[25]. These
, to feed a
methods require the databases , the input vector
neural network training process, as illustrated in Fig. 7.
One hidden layer of wavelets captures the nonlinear behavior. A wavelet is a nonlinear processing unit with the “sigmoid” transfer function (6).
In this study, the radial wavelet function is given by
Fig. 6. Characterization of dynamic kernels.
(6)
The
collector bias current depends both on the input magtemperature.
, the collector bias
nitude signal and the
voltage, is fixed and the base bias is neglected. The bias power
. The second term is calculated thanks
is only a function of
to the static transmission parameter.
The characterization process of
and
requires isothermal
single-tone harmonic-balance simulations of the circuit model
at central carrier frequency, as shown in Fig. 5. Indeed, an
isothermal measurement is difficult to obtain.
These databases are representative of the behavior of the network and set the validity domain for each parameter, carrier fre, bias point, and
quency, magnitude of input power wave
temperature within the device.
The input vector is connected to the hidden layer through a
set of linear weight. Each kind of connection is defined by a
and an offset . This topology is associated with
vector
defined in (7) as follows:
an analytic function
(7)
and
are, respectively, the translation and dilatation vectors of the wavelet base functions. In order to obtain an accurate function
with reasonable CPU time, the number
of wavelets and, consequently, linear weights, are minimized.
Equation (7) is evaluated by optimizing the average mean square
error (MSE) (8). The error between the neural-network
output and the target is given by
(8)
C. Dynamic Kernels of the BET Model
The first-order dynamic kernel of (1) allows predicting the
short-memory effect and is characterized by the approach described in [17] and [18]. Thanks to the same characterization
process, to take into account the frequency dependence of the
, a dynamic kernel
is added as follows:
current
is the amount of data available in the target .
is then translated by a simple C
program into the circuit
simulator [23].
III. THERMAL REDUCED MODEL
(5)
This one is extracted at ambient temperature on all the bandwidth either from one-tone signal harmonic-balance simulation
or pulse measurements (short duration with regard to the thermal
constant, no self-heating effects), as shown in Fig. 6.
The thermal behavior of a device can be predicted by a circuit
using the following electrothermal analogy. A
impedance
temperature corresponds to a voltage and a dissipated power to
a current. Thus, the coupling of a thermal model to an electrical
model is possible in a circuit simulator. Moreover, the knowlprecisely leads to the operating temperature. Meaedge of
surement techniques are difficult to set up because the hot area
�MAZEAU et al.: BEHAVIORAL THERMAL MODELING FOR MICROWAVE POWER AMPLIFIER DESIGN
2293
is small and not on the top surface of the device. 3-D FE simulation is easier to perform and has proven to be reliable [15], [26].
The thermal system is governed by the following heat equation:
(9)
is the thermal conductivity, is the temperature, is the volumetric heat generation, is the mass density, and
is the
specific heat. The FE formulation of (9) leads to the semidiscrete equation defined as
Fig. 8. Equivalent volume of the power bar computing process.
(10)
where the mass matrix
and the stiffness matrix
are
-by- symmetric and positive-definite matrices,
is the
-by- temperature vector at mesh nodes, and is the -byload vector, which takes into account the power generation and
boundary conditions. , the number of nodes, is the order of
the FE system.
can be represented by an -by- thermal impedance
matrix deduced from (10) expressed in the frequency domain
(11)
For an amplifier, the dimension is large, in the order of
several ten thousands, which makes the direct integration of the
impedance into a circuit simulator prohibitive. Moreover, it is
not useful to keep temperature information for all nodes. Also,
once the 3-D model is achieved, a reduction technique of the
matrix system must be applied.
A. Ritz Vector Approach [15]
The Ritz vector approach is powerful for linear problems
and assumes the thermal conductivity to be constant. The
mean response mode and yield approximations are enhanced
of Ritz vecwith the generation of an orthogonal basis
tors
. Thanks to this new projection basis, the initial problem is transformed into a smaller one. The next step
consists of doing an eigendecomposition. The eigenvectors
make up the new set of axes corresponding to the diagonal matrix constructed from the corresponding eigenvalues . In the
frequency domain, the system becomes
..
(12)
.
allows to pick up temperaAn -by- selection matrix
ture nodes among to represent the system. Thus, the reduced
thermal impedance is expressed as follows:
..
.
(13)
Fig. 9. Thermal model of the power amplifier.
B. Reduced Thermal Model of the HBT Power Amplifier
The MMIC power amplifier used in this study is based on
an InGaP/GaAs HBT technology with Au thermal drain, and is
composed on two amplification stages. In order to apply the reduction order technique with common computation capacity, the
order of the 3-D model must be minimized at the beginning of
the design. Epitaxial layers and their geometries can be approximated without a significant degradation of the thermal behavior.
The second stage of the amplifier mainly influences the transient thermal response. Moreover, if the distance between the
amplifier stages is large enough, the thermal coupling between
the first and second stage can be neglected in a first approach.
Therefore, only the second stage is considered. The dissipated
power is supposed to be uniform and localized under the InGaP
m volume. An equivalent power
emitter finger in a
dissipation volume, a “power bar,” is defined for each transistor
depending on the finger length , the width , and the length
of an equivalent surface, as shown in Fig. 8.
is the number of emitter “fingers” in the transistor.
Once transistor topology is simplified, the thermal model of
the amplifier is computed using symmetrical properties. These
power bars lay on a GaAs substrate and a baseplate with volumes, as illustrated in Fig. 9. Many epitaxial layers are neglected. Indeed, their small volume and/or conductivity close
to the GaAs value allow this approximation. On the one hand,
this model takes into account the InGaP volume of the transistors because its thermal conductivity is ten times smaller than
GaAs conductivity and slows down the heat transfer. On the
other hand, the Au thermal drain conductivity is ten times bigger
than GaAs and makes the heat evacuation easier. In order to
solve the heat equation during the FE simulation, two boundary
conditions must be given: the dissipated power in the power bar
and the baseplate temperature.
To apply the reduced-order method, a constant conductivity
for the material must be considered. However, for a given baseplate temperature, it is possible to minimize this error thanks
to an FE simulation in which thermal conductivities are function of temperature. The solution consists of first computing
the average temperature for the main volumes of the amplifier
�2294
IEEE TRANSACTIONS ON MICROWAVE THEORY AND TECHNIQUES, VOL. 55, NO. 11, NOVEMBER 2007
Fig. 10. Reduced impedance circuit model.
TABLE I
COMPOSITION OF DATASETS, NUMBER OF WAVELETS, AND
MSE FOR EACH FUNCTION OF THE BET MODEL
Fig. 11. Dissipated power during a 96-�s long pulse.
using a nonlinear FE approach. Second, these temperatures are
taken as reference temperatures for thermal conductivities and
matrices of the linear problem can be extracted.
the
Generally an interpolation process is more suited for nonlinear
reduced models [27].
Once the thermal matrices of the model are extracted, the Ritz
vector method is applied. In this study, the reduced impedance
model is defined for a baseplate temperature equal to the ambient temperature and only the maximum amplifier operating
, only one output temperature).
temperature is considered (
The reduced impedance circuit model is integrated in the Agilent ADS circuit simulator through a SPICE netlist (Fig. 10).
is the baseplate temperature and
is the increase of
operating temperature
resulting of the self-heating effects.
Fig. 12. Operating temperature T during a 96-�s-long pulse.
IV. INTEGRATION AND RESULTS OF THE BET MODEL
The first-order dynamic Volterra series have been interpolated
by neural networks according to a description of each kernel in
real-imaginary parts. The static kernels are generated from simulation datasets. The dynamic kernels are computed from simple
measurements with pulse duration short enough to neglect the
self-heating effect (2- s RF pulse). The number of wavelets attributed to these terms, as well as the MSE, is listed in Table I.
The BET model has been implemented as a compiled circuit
model. The program uses global and local functions to manage
the neural model files, the thermal feedback during the envelope
transient simulation, and the conversion of the power waves
to the electrical voltage and current I/V parameters. A time-domain pulse generator is used as the RF source for the BET
model.
A. Static Results and Validation
As shown in Figs. 11 and 12, the BET model allows to predict
during a pulse envelope the evolution of the average dissipated
, the maximal temperature
, and the RF output
power
Fig. 13. Output RF power of the power amplifier during a 96-�s-long pulse.
power
(Fig. 13). This information is essential to foresee
the size of the cooling system, as well as the performances of
the power amplifier.
In order to validate the BET model results, measurements of
the HBT amplifier have been performed in pulse mode. A long
pulse (96 s) is applied for a carrier frequency . Data have
been measured during the pulse in three input windows: at the
of the pulse.
beginning , at the middle , and at the end
and
Thus, instantaneous modeling performances at time
are compared to the measurements, as illustrated by Fig. 14.
�MAZEAU et al.: BEHAVIORAL THERMAL MODELING FOR MICROWAVE POWER AMPLIFIER DESIGN
Fig. 14. Input voltage during a 96-�s-long pulse, measurement windows
(F 1; F 2; F 3), and reading time (t1; t2; t3) for simulation results.
2295
Fig. 17. Phase drift: comparison between measurements and model
phase S 21(F 1) ; F 3 = phase S 21(F 3)
F = phase S 21(F 2)
phase S 21(F 1) ; modelt2 = phase S 21stat(t2)
phase S21stat(t1)
and model t3 = phase S 21stat(t3)
phase S 21stat(t1) .
f
f
g
g0
f
f
f
g0
g
g0
f
f
f
g
g0
g
Fig. 15. Amplifier gain: comparison between measurement (F 1; F 2; F 3) and
simulation of BET model (t1; t2; t3, respectively).
Fig. 18. Comparison between amplifier gain measurements (dashed lines) and
simulation of BET model (continuous lines), P in = 0 dBm (triangle), 10 dBm
(circle), 21 dBm (square), Dfreq = freq f .
0
Fig. 16. Amplitude drift: comparison between measurements and model
F 2 = S 21(F ) S 21(F 1); F 3 = S 21(F 3) S 21(F 1) and model
t2 = S 21stat(t2) S 21stat(t1); t3 = S 21stat(t3) S 21stat(t1).
0
0
0
0
A comparison for the amplitude gain, amplitude drift, and phase
drift is presented, respectively, in Figs. 15–17. We can observe
a good agreement between the measurements and the transient
envelope simulation using the BET model. These results validate the performances of the model.
Other long-term memory effects such as the modulation of the
bias point can influence the measurement, but the application
of a pulse length with regard to the duration of thermal effect
establishment supposes that their influence is dominating. As a
is considered
matter of fact, if the beginning of the pulse
without thermal effects, the amplitude drift (Fig. 16) and the
phase drift (Fig. 17) can be attributed to transient self-heating. It
is important to notice that it is well rendered by the BET model.
Fig. 19. Comparison between bias collector current measurements (dashed
lines) and simulation of BET model (continuous lines), P in = 0 dBm
(triangle), 10 dBm (circle), 21 dBm (square), D freq = freq f .
0
Moreover, the BET model is robust and requires small computational resources: 40 s for three input powers and 11 points
in the time domain.
B. Dynamic Results and Validation
A comparison of the amplitude gain and bias collector current is shown in Figs. 18 and 19 for several carrier frequencies.
�2296
IEEE TRANSACTIONS ON MICROWAVE THEORY AND TECHNIQUES, VOL. 55, NO. 11, NOVEMBER 2007
A good agreement between measurements and the transient envelope simulation using the BET model can be observed. These
results validate the frequency modeling performances. The amplitude difference is mainly due to the static dataset generated
from the circuit-level model.
Moreover, the BET model is robust and makes use of small
computational resources: 90 s for three input powers, five frequencies, and 11 points in the time domain.
V. CONCLUSION
A BET system-level model for power amplifiers has been
presented. The coupling behavioral electrical neural network
model with reduced thermal impedances has been implemented
into a common circuit simulator (ADS). An envelope transient
simulation including the thermal transient feedback has been
performed with good numerical convergence and only small
computational resources. The method to obtain the BET model
is simple because the extraction of the thermal static model only
needs simulation datasets. This model includes the dynamic
term of the dynamic modified Volterra series and allows to
predict the long-term memory effects. The convergence of the
BET model is obtained if the characterization of the isothermal
. Good
behavioral model allows to reach the maximum of
agreement between simulations and pulsed measurements at
ambient temperature validates this approach and its use for
radar applications. Further studies will be dedicated to the
baseplate temperature dependency [27] and intermodulation
study. The BET approach has been illustrated with an HBT
MMIC, but this approach can be applied to any other amplifier
technology.
ACKNOWLEDGMENT
The authors wish to acknowledge AMCAD Engineering,
Limoges, France, for measuring the circuit and Agilent Technologies, Massy, France, for providing technical support.
REFERENCES
[1] O. Jardel, R. Quéré, S. Heckmann, H. Bousbia, D. Barataud, E.
Chartier, and D. Floriot, “An electrothermal model for GaInP/GaAs
power HBTs with enhanced convergence capabilities,” in 1st Eur.
Microw. Integrated Circuits Conf., Manchester, U.K., Sep. 2006, pp.
296–299.
[2] M. Schetzen, The Volterra and Wiener Theories of Nonlinear Systems,
reprint ed. Melbourne, FL: Krieger, 1989.
[3] D. Mirri, F. Filicori, G. Iuculano, and G. Pasini, “A new linear dynamic
model for performance analysis of large signal amplifiers in communication systems,” in IEEE Instrum. Meas. Conf. Tech. Dig., Venice,
Italy, May 1999, pp. 193–197.
[4] E. Ngoya, N. Le Gallou, J. M. Nebus, H. Buret, and P. Reig, “Accurate RF and microwave system level modeling of wideband nonlinear
circuits,” in IEEE MTT-S Int. Microw. Symp. Dig., Boston, MA, Jun.
2000, vol. 1, pp. 79–82.
[5] C. Maziere, T. Reveyrand, S. Mons, D. Barataud, J. M. Nebus, R.
Quéré, A. Mallet, L. Lapierre, and J. Sombrin, “A novel behavioral
model of power amplifier based on a dynamic envelope gain approach for the system level simulation and design,” in IEEE MTT-S
Int. Microw. Symp. Dig., Philadelphia, PA, Jun. 2003, vol. 2, pp.
769–772.
[6] C. Florian, F. Filicori, D. Mirri, T. Brazil, and M. Wren, “CAD
identification and validation of a non-linear dynamic model for
performance analysis of large-signal amplifiers,” in IEEE MTT-S
Int. Microw. Symp. Dig., Philadelphia, PA, Jun. 2003, vol. 3, no.
8–13, pp. 2125–2128.
[7] A. Zhu, J. C. Pedro, and T. J. Brazil, “Dynamic deviation reductionbased Volterra behavioral modeling of RF power amplifiers,” IEEE
Trans. Microw. Theory Tech., vol. 54, no. 12, pp. 4323–4332, Dec.
2006.
[8] G. Orengo, P. Colantonio, A. Serino, F. Giannini, G. Ghione, M. Pirola,
and G. Stegmayer, “Time-Domain neural network characterization for
dynamic behavioural models of power amplifiers,” in Proc. 13th GaAs
Symp. Dig, Paris, France, Oct. 2005, pp. 189–192.
[9] V. Rizzoli, D. Masotti, and F. Mastri, “Behavioural modeling of thermally induced distortion in RF microwave nonlinear subsystems,” in
Proc. 34th Eur. Microw. Conf., Amsterdam, The Netherlands, Oct.
2004, pp. 845–848.
[10] J. Darricau, Physique Et Théorie Du Radar, Tome 1 ed. Paris, France:
Sodipe, 1981.
[11] H. Wilden, “Microwave tests on prototype-T/R-modules,” in Proc.
Radar Syst., Edinburgh, U.K., Oct. 1997, pp. 517–521, Pub. 449.
[12] K. J. Joo, E. L. Wilson, and P. Leger, “Ritz vectors and generation
criteria for mode superposition analysis,” Earthquake Eng. Struct.
Dynam., vol. 18, pp. 149–167, 1989.
[13] E. L. Wilson and M. W. Yuan, “Dynamic analysis by direct superposition of Ritz vectors,” Earthquake Eng. Struct. Dynam., vol. 10, no. 6,
pp. 813–821, Nov. 1982.
[14] J. T. Hsu and L. Vu-Quoc, “A rational formulation of thermal circuit
models for electrothermal simulation—Part I: Finite element method,”
IEEE Trans. Circuits Syst., vol. 43, no. 9, pp. 721–732, Sep. 1996.
[15] R. Sommet, D. Lopez, and R. Quéré, “From 3-D thermal simulation of
HBT devices to their thermal model integration into circuit simulators
via Ritz vectors reduction technique,” in 8th Intersoc. Thermal Thermomech. Phenomena Electron. Syst. Conf., San Diego, CA, Jun. 2002,
pp. 22–28.
[16] F. Filicori and G. Vannini, “Mathematical approach to large-signal
modelling of electron devices,” Electron. Lett., vol. 27, no. 4, pp.
357–359, Feb. 1991.
[17] N. Le Gallou, D. Barataud, H. Buret, J. M. Nebus, and E. Ngoya,
“An improved behavioral modeling technique for high power amplifiers with memory,” in IEEE MTT-S Int. Microw. Symp. Dig., Phoenix,
AZ, May 2001, vol. 2, pp. 983–986.
[18] C. Dominique, Y. Mancuso, P. Duéme, and J. L. Gautier, “High power
amplifier dynamic modeling by modified Volterra series and neural network tool,” in Proc. 33rd Eur. Microw. Conf., Munich, Germany, Oct.
2003, pp. 1–4.
[19] J. Mazeau, R. Sommet, D. Caban-Chastas, E. Gatard, R. Quéré, and
Y. Mancuso, “New electrothermal system level model for RF power
amplifier,” in Proc. 37th Eur. Microw. Conf., Munich, Germany, Oct.
2007, pp. 1–4.
[20] J. J. Raoux, “Modélisation non linéaire des composants électroniques:
Du modéle analytique au modéle tabulaire paramétrique,” Ph.D. dissertation, XLIM Res. Inst., Limoges Univ., Limoges, France, 1995.
[21] A. Zine, G. Maury, F. Ndagijimana, and C. Arnaud, “A simple RF
power behavior model for system level parameters estimation,” in
IEEE Int. Behavioral Modeling Simulation Conf., San José, CA, Sep.
2005. [Online]. Available: http://www.bmas-conf.org/2005/web-onlypubs/BMAS2005_30.pdf
[22] E. R. Srinidhi, A. Ahmed, and G. Kompa, “Power amplifier
behavioral modeling strategies using neural network and memory
polynomial models,” Microw. Rev. J., vol. 12, no. 1, pp. 15–20,
Jun. 2006.
[23] Y. Harkouss, E. Ngoya, J. Rousset, and D. Argollo, “Accurate radial
wavelet neural-network model for efficient CAD modelling of microstrip discontinuities,” Proc. Inst. Elect. Eng.—Microw., Antennas,
Propag., vol. 147, no. 4, pp. 277–283, Aug. 2000.
[24] J. Xu, M. C. E. Yagoub, R. Ding, and Q.-J. Zhang, “Neural-based dynamic modeling of nonlinear microwave circuits,” IEEE Trans. Microw. Theory Tech., vol. 50, no. 12, pp. 2769–2780, Dec. 2002.
[25] B. O’Brien, J. Dooley, and J. Brazil, “RF power amplifier behavioral modeling using a globally recurrent neural network,” in
IEEE MTT-S Int. Microw. Symp. Dig., San Francisco, CA, Jun.
2006, pp. 1089–1092. [Online]. Available: http:hertz.ucd.ie/publications/IMS2006_OBrien.pdf
[26] R. Sommet, C. Chang, P. Duéme, and R. Quéré, “Electrothermal
models of transistors based on finite element analysis for radar applications,” in 9th Intersoc. Thermal Thermomech. Phenomena Electron.
Syst. Conf., Las Vegas, NV, Jun. 2004, pp. 515–522.
[27] E. Gatard, R. Sommet, and R. Quéré, “Nonlinear thermal reduced
model for power semiconductor devices,” in Proc. 10th Intersoc.
Thermal Thermomech. Phenomena Electron. Syst. Conf., San Diego,
CA, May 2006, pp. 638–644.
�MAZEAU et al.: BEHAVIORAL THERMAL MODELING FOR MICROWAVE POWER AMPLIFIER DESIGN
Julie Mazeau received the Master’s degree in
high-frequency and optical telecommunications
from the University of Limoges, Limoges, France,
in 2003, and is currently working toward the Ph.D.
degree at the Research Institute XLIM, University of
Limoges (in collaboration with THALES Airborne
Systems, Elancourt, France).
Her research interests are dedicated to electrothermal system-level models of power amplifiers
for radar applications.
Raphaeël Sommet received the French Aggregation
in Applied Physics degree and Ph.D. degree from the
University of Limoges, Limoges, France, in 1991 and
1996, respectively.
Since 1997, he has been a Permanent Researcher
with the C2S2 team “Nonlinear Microwave Circuits
and Subsystems,” XLIM Research Institute, Centre
National de la Recherche Scientifique (CNRS), University of Limoges. His research interests concern
HBT device simulation, 3-D thermal FE simulation,
model-order reduction, microwave circuit simulation, and generally the coupling of all physics-based simulation with circuit
simulation.
Daniel Caban-Chastas received the Diploma degree in engineering of electronics and microwaves
systems from the University of Pierre and Marie
Curie, Paris, France, in 2001.
In 2002, he joined the Advanced Technologies
Team, THALES Airborne Systems, Elancourt,
France, where he is an Electromagnetic Simulation
Expert currently in charge of microwave design for
active antenna transmit/receive (T/R) modules. He
is also involved in microwave packaging and new
microwave development.
View publication stats
2297
Emmanuel Gatard received the Electronics and
Telecommunications Engineering degree from Ecole
Nationale Supérieure d’Ingénieurs de Limoges
(ENSIL), Limoges, France, in 2003, and the Ph.D.
degree in electrical engineering from the University
of Limoges, Limoges, France, in 2006.
He is currently with the XLIM Research Institute, Centre National de la Recherche Scientifique
(CNRS), University of Limoges. His research interests concern electrothermal modeling of power
semiconductor devices dedicated to circuit simulations, physics-based electron device simulations, and nonlinear thermal
modeling.
Raymond Quéré (M’88–SM’99) received the
Electrical Engineering degree and French Aggregation degree in physics from ENSEEIHT–Toulouse,
Toulouse, France, in 1976 and 1978, respectively,
and the Ph.D. degree in electrical engineering from
the University of Limoges, Limoges, France in 1989.
In 1992, he became a Full Professor with the
University of Limoges, where he currently heads
the research group on high-frequency nonlinear
circuits and systems with the XLIM Research Institute, Centre National de la Recherche Scientifique
(CNRS), University of Limoges. He is mainly involved in nonlinear stability
analysis of microwave circuits.
Prof. Quéré is a member of Technical Program Committee for several conferences. He was the chairman of European Microwave Week, Paris, France, 2005.
Yves Mancuso received the Diploma of engineer degree from the Ecole Nationale Supérieure de Génie
Physique, Grenoble, France, in 1979.
In 1981, he joined THALES, where he was in
charge of different technological developments for
T/R modules, MMICs, packaging, and test benches.
From 1993 to 1997, he was mainly in charge of the
T/R module for two major phased-array programs:
a European one, AMSAR, and a French space
program. He is currently involved with phased-array
antennas and T/R modules design authority for
THALES Airborne Systems, Elancourt, France, including airborne and space,
radar and electronic warfare applications and new microwave developments
including microwave components, circuits, and technology.
�
 Raphael SOMMET