International Journal of Education and Practice
2016 Vol. 4, No. 9, pp. 234-242
ISSN(e): 2310-3868
ISSN(p): 2311-6897
DOI: 10.18488/journal.61/2016.4.9/61.9.234.242
© 2016 Conscientia Beam. All Rights Reserved.
TECHNOLOGICAL SKILLS IN THE ACADEMIC PERFORMANCE OF STUDENTS
Urbano Luna-Maldonado1 --- Héctor Flores-Breceda2 --- Juan Antonio Vidales-Contreras3 --- Humberto
Rodríguez-Fuentes4 --- Alejandro Isabel Luna-Maldonado5†
1,2,3,,4,5
Department of Agricultural and Food Engineering, Faculty of Agriculture, Autonomous University of Nuevo Leon , Mexico
ABSTRACT
The objective of this research was to analyze the effect of technological competence (teacher, Internet, smart classroom), to obtain
academic performance of students of higher level of the Colleges of Agriculture and Veterinary Medicine at the Autonomous
University of Nuevo Leon. We applied qualitative and quantitative methods, and simultaneously, a statistical design allowed us
to make more reliable calculations. We also used two instruments: surveys and assessment test the research question.
Keywords: Feasibility, Teacher, Student, Technological skills, Internet, Smart classroom, Academic performance.
Received: 13 October 2016/ Revised: 28 October 2016/ Accepted: 5 November 2016/ Published: 12 November 2016
Contribution/ Originality
This study shows how much academic performance is generated from the use of technological competence in
the classroom, and how the financing institutions to provide results in a benefit to the student. There is a needed to
develop technical competence to opens up new educational possibilities in the classroom and critical thinking.
1. INTRODUCTION
In Mexico, the expansion of technological competence (teacher, Internet, smart classroom) has reached a large
number of institutions of all levels of education: primary, secondary, and vocational school. This has created the
need for updating of teachers and students in developing these skills to improve school academic performance.
Therefore, research was needed on the benefits of technological skills (teaching, internet, smart classroom) applied
in the teaching and learning of higher level students, and observe the surveys and assessments applied to certain
samples of students to investigate and verify their perception of academic performance (Martinez-Olivé, 2006). The
case studies on OECD schools deal with potential changes in education, and that lead to the introduction of
technological competence (González, 1999). This study concludes that "the technological skills not usually act as a
catalyst for school change by themselves, but can be a trigger vigorous educational innovations planned" (Venezky
and Davis, 2002). Internet is currently used technological competence in teaching, used to connect to the global
knowledge (Raposo et al., 2006; González and Vidaud, 2009). The teacher is a determining factor in the
transmission of technological competence and must be updated constantly, the student becomes the center of the
teaching-learning process, and it must receive the full support of the teacher. The smart classroom is another factor
in this process (Lozano-Diaz, 2003; Jaramillo et al., 2009). All these elements can be feasible to achieve academic
excellence in the education of our country. According to the OECD (Organization for Economic Cooperation and
Development), responsible for conducting the evaluation every three years to the national education system,
† Corresponding author
© 2016 Conscientia Beam. All Rights Reserved.
234
�International Journal of Education and Practice, 2016, 4(9): 234-242
internationally, by the PISA (Programme for International Student Assessment , LLECE (Laboratory for
Assessment of the Quality of Education) and the test EXCALE (Assessment of the National Institute for the
Evaluation of Education for students between 15 and 16 years), our country is among the lowest in education is
concerned (Naresh, 2004). It is critical professional preparation, updating the knowledge and skills of each teacher,
to communicate what they know, because of the emergence of the powers in the international context in which the
student becomes the center of teaching and learning in the classroom (Tornimbeni et al., 1998). In addition,
technology is a determining factor in their education. Therefore, education must ensure student learning, through a
constant process of updating by the teacher to address the changes in education. The approach must express three
criteria problem statement either: a) the relationship between two or more variables, b) be stated clearly and
unambiguously as question, c) the problem must meet possibility of being subjected to an empirical test (Wills and
Garcia-Cabrera, 2005).
Are the technological competencies affect / improve the academic performance of a student population? The
technical competence: teachers, Internet, smart classrooms, improve student academic performance through the use
thereof by the teachers in class, learning to pass and also that students are responsible to use these skills in relation
the learning process (Karsienti and Lira, 2010).
Thus, the importance of the proper use of technological competence, by the teacher and the student in the
classroom, improve education of new professionals in society (Cuevas et al., 2011).
Also, the use of these in the classroom opens up new possibilities for development of skills that generate new
knowledge in education, skills and retrain teachers and students have (Mirador University, 2012). As technologies
in general and media in particular have broken into homes, is necessary for students to become more technological
competence, to the extent that critics and viewers are active against technological messages.
This study is to propose new lines of research in the area of technological competence, to show high academic
performance of those in education.
Our country is in 51st place in human development, according to the survey provided by the OECD (SerranoSantoyo and Martínez-Martínez, 2003) in regard to broadband connections. In this area, in 2001 was relatively low.
Hence, the need for greater investment in technologies applied costs in education.
One of the definitions of technological competence: that students develop skills in real time by the teacher, to be
evaluated efficiently. Possessing the technological skills of primary school teachers must be designed to enhance
curricular integration of information technology (Quintana-Albalat, 2000).
The importance of technological competence has affected all areas of knowledge, observing that knowledge
itself is a source of development in industrialized and developing countries. Another important aspect of the
technological skills is to visualize if they affect the learning process of college students, and if the impact is minimal,
seek effective mechanisms for use in the process of improving higher education (Suárez et al., 2010).
The objective of this study is to make an assessment of the use of technological skills by the teacher and the
student, using two research instruments, the survey and evaluation for obtaining academic performance of students.
Ahumada (2005) says: "The assessment is a systematic process for gathering information about student learning
and performance, based on various sources of evidence."
The specific objectives are:
1) The purpose of this section is to analyze and discuss the theory and research used as part of the explanation of
technological skills. We studied the concepts competence, technological competence, teachers, Internet, smart
classroom, academic performance, for the research project.
2) Analysis of data from two groups of Veterinary vs Agronomy, through the Student t test statistic.
3) Determine the equality between two variances assessment of two groups of Agronomy, of different generations.
4) Determine the level of awareness of technological skills by students, from the application of a survey.
235
© 2016 Conscientia Beam. All Rights Reserved.
�International Journal of Education and Practice, 2016, 4(9): 234-242
2. MATERIALS AND METHODS
Among the research questions were handled the dependent variable and the independent. Hernandez et al.
(1998) defined the independent variable as the supposed cause or history of the dependent variable, or consequential
effect. They also say that by the dependent variable is the prediction, while independent from the predicted. The
independent and dependent variables are symbolized as x and y, respectively. The independent variables are the
technological skills: teachers, students, smart classrooms, Internet, to support teaching.
2.1. Among the Questions in the Questionnaire Are
1. Does it affect the development of technological competence in the academic performance of college students?
2. What is the role of the school in the Knowledge Society?
3. What new knowledge require new generations of students?
4. What skills teachers need to develop XXI century?
5. How to deal with rapid changes in education as?
6. Can all students in a classroom to develop technology skills?
7. What is the school in the New Millennium?
8. What role should meet the teacher for their students to develop technology skills?
9. What is the purpose or goal of technological competence in higher education?
10. Do the students require technological skills to better their participation in the knowledge society?
The research design was formulated for this study is defined as "non-experimental or ex post facto", as there is
no active manipulation of some variable, but observed situations that have already happened. It also lists as
transactional or cross design (Hernandez et al., 1998) because it involves the observation of phenomena in a single
point in the process. This design is also cross explanatory (Behling, 1984) it aims to make statements about the
population studied. With this research design, are tested the hypothesis and the relationship between the dependent
and independent variables.
The population consisted of 97 students from the Colleges of Agriculture and Veterinary Medicine of the
Autonomous University of Nuevo Leon, who attend the course on Probability and Statistics. Three groups were
selected from the College of Agriculture and two groups of the Veterinary School, enrolled in first, second and fifth
semester who participated in the study. Another characteristic of the sample of 97 students, 50 are female and 47
male.
The variables were:
Academic performance: Variable quantitative, performance characterized as high, medium, low, and poor, based
on the table prepared by Reyes-Murillo (1998). The indicator for this variable is the weighted average of each
student, after the end of the semester.
Technological competence: Those skills necessary to manage and use all the resources necessary technology for
the design and development of e-learning, from a technical standpoint (Internet tools, synchronous and
asynchronous communication, and authoring tools: graphic design, page web, etc.). It also involves the knowledge
and use of the platform on which to develop the training activity in order for it to be adapted to the type of student
and course, in each case assessing the adequacy of the same.
2.2. Data Collection Techniques
The surveys were applied to students, and the survey was presented in three sections: 1) use information and
knowledge of technological competence, 2) general skills to use the technologies, 3) use of technological competence
in teaching (in classrooms). The survey consisted of 51 closed questions, which should be answered with: Yes, and
sometimes not.
236
© 2016 Conscientia Beam. All Rights Reserved.
�International Journal of Education and Practice, 2016, 4(9): 234-242
Panel surveys lasted 15-25 minutes. The purpose of these is to visualize the degree of knowledge of the
technological skills aimed at efficient academic performance by students.
Statistical Analysis: According to Luna-Maldonado (2012) for statistical analysis can be used the following
statistical variables:
Arithmetic Mean: A measure of central tendency known as a center of gravity and the obtained value (score) in a
distribution that corresponds to the sum of all values (scores) divided by the total number of values or subjects.
̅
∑
(1)
Variance: is a measure of variation of the data set. The variance is calculated as the average squared deviation of
each value (score) of their mean.
∑
̅)
(
(2)
Standard deviation: This corresponds to the square root of the standard deviation. Dispersion is far more commonly
used
√
∑
(
̅)
(3)
Coefficient of variation: is a normalized measure of dispersion of the probability distribution. Also known as unit
risk. Is the standard deviation divided by the mean. The lower the coefficient of variation, the lower the risk
prediction.
(4)
̅
Student's test: Best and Kahn (1995) define it as a probability distribution that is used when comparing two
samples and engage small and variances are equal or nearly equal. In the comparison of two means with the Student
t supposed to exist: a) a normal (Gaussian) populations of random errors, b) there is no significant difference
between the standard deviations of the two population samples (Efstathiou, 2012). 2/2 and the corresponding
standard deviations are calculated using the following equations (nA and nB is the number of measurements in the
data set and the data set B, respectively):
X A Xi
S A i 1
nA 1
nA
2
X B Xi
i 1
SB
nB 1
nB
2
Then, the pooled estimate of the standard deviation is calculated SAB:
S AB
n A 1S A2 nB 1S B2
n A nB 1
Finally, the calculated statistic t (experimental value of t) is calculated as:
237
© 2016 Conscientia Beam. All Rights Reserved.
�International Journal of Education and Practice, 2016, 4(9): 234-242
[̅̅̅̅ ̅̅̅̅]
(5)
√
F Test. Pham (2006) says that Fisher or F test is used primarily for testing the equality between two variances.
Unlike the Student t distributions, where each of them has only one parameter, the F distribution has two
parameters: the number of degrees of freedom (df) usually denoted gl1 and gl2. A specific distribution F, or the
specific shape of the curve F, is completely determined when known GL1 and GL2. The Fisher test is used when
you have two nominal variables.
Analysis of variance: inferential method is used for testing the equality of means of populations. The analysis of
variance is an extension of the Student t test for independent samples.
H0: μ1 = μ2
3. RESULTS
H1: μ1 ∦ μ2
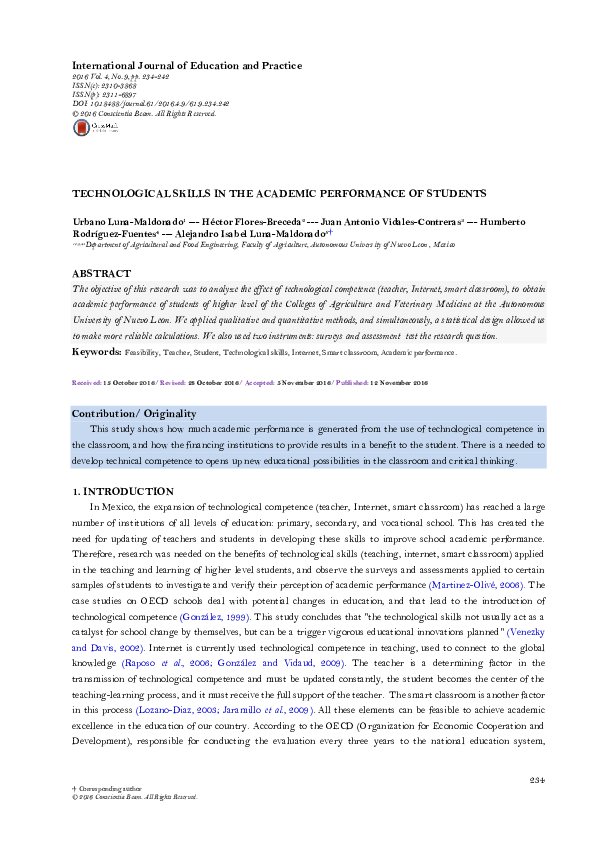
In Table 1 are grouped students by level of degree studies. Figure 1 shows the scatter plots for groups of
students who answered Yes, No or Sometimes to the survey questions, we found a greater number of responses
Yes.
Table-1. Undergraduate level of the students
Study level
1st. Semester
2nd. Semester
5th . Semester
Undergraduate
97
37
32
28
Percentage
100
38.1443299
32.9896907
28.8659794
Source: Department of Student Records and Transcripts in Faculty of Agriculture and Faculty of Veterinary, Autonomous
University of Nuevo Leon.
Fig-1. Poll results: a) 12 students of the fifth semester of the College of Agriculture, b) 15 students in the second semester of the College of
Agriculture, c) 21 students in the first semester of the College of Agriculture, d) 16 students in fifth half of the Veterinary Faculty, e) 32 students
in the second semester of the Faculty of Veterinary Medicine of Autonomous University of Nuevo Leon.
238
© 2016 Conscientia Beam. All Rights Reserved.
�International Journal of Education and Practice, 2016, 4(9): 234-242
Source: Department of Student Records and Transcripts in Faculty of Agriculture and Faculty of Veterinary, Autonomous University of Nuevo Leon.
The results, after performing the surveys that were applied to students of the Faculties: Agriculture and
Veterinary in Autonomous University of Nuevo Leon, seen in Figures 3, 4, and 5, which are presented according to
the most representative aspects evaluated.
Fig-2. In the survey, 62% of students answered yes to work with ICT in the classroom helps the teachinglearning process, 38% said no, 0% answered sometimes. Resulted in more than half opine that ICTs enable
teaching and learning process.
Source: Department of Student Records and Transcripts in Faculty of Agriculture and Faculty of Veterinary, Autonomous
University of Nuevo Leon.
Fig-3. Asked 10 Which method is more suited to the interests and needs of each student: the
traditional or ICT? 62% of respondents answered yes to the use of ICT, 30% replied that the
traditional 8% of respondents answered that the two.
Source: Department of Student Records and Transcripts in Faculty of Agriculture and Faculty of Veterinary,
Autonomous University of Nuevo Leon.
Fig-4. 56% of respondents answered yes to question 44: Do the teachers have implemented
technological competence in your teaching and learning in the classroom? 36% of respondents
said no to the implementation of technological competence in the classroom, and 8% said that
once implemented ICT in the classroom.
Source: Department of Student Records and Transcripts in Faculty of Agriculture and Faculty of
Veterinary, Autonomous University of Nuevo Leon.
239
© 2016 Conscientia Beam. All Rights Reserved.
�International Journal of Education and Practice, 2016, 4(9): 234-242
Table 2 shows the measures of central tendency and measures of variation in the statistical analysis of the
survey data used for students of Autonomous University of Nuevo Leon who responded Yes, No, or Sometimes the
questions. It was found that in the answers with a Yes, the means were 9.3 ± 2.6, 9058 ± 2.59, 13.53 ± 4.49, 12.08 ±
2.59, 23.63 ± 5.33 for groups of students fifth semester, second semester and first semester of the Faculty of
Agriculture, and fifth semester and second semester at the School of Veterinary Medicine of the Autonomous
University of Nuevo Leon.
Table-2. Mean, standard deviation and coefficient of variation of students groups the Colleges of Agriculture and Veterinary of Autonomous
University of Nuevo Leon, who responded Yes, No, or Sometimes to survey questions.
Estimator
Mean
Standard
Devation
Coefficient
of Variation
Class
of
5th
Semester
of
Agronomy
School
Ye No Somes
times
9.3 0.9 1.78
2
2.6 1.2 1.75
Class of 1st Semester
of
Agronomy
School
Class
of
1th
Semester
of
Agronomy School
yes
No
Yes
No
9.06
2.3
13.5
3
4.49
0.3
0.29
0.8
2
1.0
5
1.2
8
0.45
0.33
2.7
2
3.0
2
1.1
1
0.9
0.9
2.59
Sometimes
5.12
Sometimes
5.59
3.27
0.58
Class of 5th
Semester
of
Veterinary
Medicine School
Yes N
Someo
times
12.0 1.
2.84
8
08
2.59 1.
2.05
47
0.21 1.
0.72
36
Class
of
2nd
Semester
of
Veterinary
Medicine School
Yes
No Sometimes
23.6
1.7 6.59
3
8
5.83
1.8 4.5
3
0.23
1.0 0.68
2
Source: Department of Student Records and Transcripts in Faculty of Agriculture and Faculty of Veterinary, Autonomous University of Nuevo Leon.
The result between the means of the response if the groups fifth semester of the College of Agriculture and the
fifth semester of the Veterinary Faculty Student t was calculated (Table 3) of 2.108. It is known that if the value of
the Student t calculated (2.108) is greater than the value of the Student t table, we conclude that there is a
statistically significant difference between the two treatment means at 5% or 1% significance level. In this study
there were significant differences, since the value of Student's t tables (for degrees of freedom (df) = 51-1 +51-1 =
100) was 1660 for a significance level of 5%, as there were 1984 worth of tables Student's t with 100 degrees of
freedom and 2.5% level. Furthermore, to determine equality between two sampled of final grades of two groups of
the Faculty of Agronomy of different generations, the result shown in Table 3.
Table-3. Analysis of variance between two variances sampled of final grades of two groups of Agronomy.
Source
Between Groups
Whitin Groups
Total
Sum of Squares
0.1
442.4
442.5
Analysis of Variance
Degree of Freedom Mean of Squares
1
0.1
8
55.3
9
Probablity
0.967
F
0.0018
F (Table)
5.317
Source: Department of Student Records and Transcripts in Faculty of Agriculture and Faculty of Veterinary, Autonomous University of Nuevo Leon.
4. DISCUSSION
The theory proposed was accepted as the table value was 0.0018 (for degrees of freedom (DDL) = 5-1 +5-1 =
8) is 5.317655 for a significance level of 5%. The difference is not significant between the two groups, because F is
less than the critical F tables.
Analysis was performed with the statistical program of Microsoft Office Excel 2007, to validate the results, and
a survey was developed in which 51 questions related to the students' knowledge about the technological skills. The
survey chose the three most important questions, and the predominant response was Yes Another way to validate
the study was the application of statistical analysis Students t, for the analysis of the assessment of two groups of
students of the Faculty of Agronomy, comparing their final grades.
240
© 2016 Conscientia Beam. All Rights Reserved.
�International Journal of Education and Practice, 2016, 4(9): 234-242
5. CONCLUSIONS
We obtained a high academic performance with a minimum difference in scores on assessments of students for
semesters of 1985 and 2011. The responses to the survey questions with Yes, the means were 9.3 ± 2.6, 9058 ±
2.59, 13.53 ± 4.49, 12.08 ± 2.59, 23.63 ± 5.33 for groups of students fifth semester, second semester and first half of
the Faculty of Agriculture, and fifth semester and second semester of the Faculty of Veterinary and Medicine of the
Autonomous University of Nuevo Leon, respectively. Final grades of two groups of different generations from
Faculty of Agronomy (1985 and 2011) showed no significant difference in relation to academic performance
obtained.
Study limitations are that it applies only to students in two Faculties: Agriculture and Veterinary (Autonomous
University of Nuevo Leon). They looked only two survey instruments (survey and evaluation) to solve the research
problem. In addition, the study was limited to only part of the technological skills: teachers, students, smart
classrooms, Internet, and the sample used for analysis was minimal: 97 students of the Faculties of Agriculture and
Veterinary (Autonomous University of Nuevo Leon). Other limitations were that it had to apply for approval of
educational institutions and the time required for research (six months). We conclude that the study found no
significant variation in the academic performance of students from the Faculties of Agriculture and Veterinary.
Funding: This study received no specific financial support.
Competing Interests: The authors declare that they have no competing interests.
Contributors/Acknowledgement: We want to express our sincere gratitude to Zacarías Jimenez for his technical support.
REFERENCES
Ahumada, P.A., 2005. Towards an authentic assessment of learning. Paidós: Mexico, DF.
Behling, J., 1984. Guidelines for preparing the research proposal. Revised Edn., Columbus: University Press of America.
Best, J.W. and V. Kahn, 1995. Research in education. States USA: Butler University.
Cuevas, L.G., C.D.M.R. Guillen and V.E. Rocha, 2011. The research skills as cognitive bridges for meaningful learning. Reason
and word. No. 77, August-October 2011. Instituto Tecnológico y de Estudios Superiores de Monterrey. State of
Mexico, Mexico.
Efstathiou,
C.E.,
2012.
Student's
t-test:
Comparison
of
two
means.
Retrieved
from
http://www.chem.uoa.gr/applets/AppletTtest/Appl_Ttest2.html [Accessed 5 April 2001].
González, D.L. and Q.I. Vidaud, 2009. Factors to evaluate the feasibility of building conservation projects. Mexico: Autonomous
University of Yucatan.
González, J.A., 1999. Technology and social perception. Assess the competition. Studies on contemporary cultures. Colima,
Mexico: University of Colima.
Hernandez, R., C. Fernandez and P. Baptista, 1998. Research methodology. Mexico, D.F.: Mc Graw-Hill.
Jaramillo, P., P. Castañeda and M. Pepper, 2009. What to do with technology in the classroom. Inventory uses of ICT for
learning and teaching. Education and educators. Colombia: Sabana University. pp: 161.162.
Karsienti, T. and M.L. Lira, 2010. Are you ready for prospective teachers to integrate ICT in the school? The case of teachers in
Quebec. Canada: University of Montreal.
Lozano-Diaz, A., 2003. The intelligent classroom: Towards a new educational paradigm? , Almería, Spain: University of
Almería.
Luna-Maldonado, A.I., 2012. Course notes of probability and statistics. Faculty of Agronomy of the Universidad Autonoma de
Nuevo Leon. Monterrey, NL.
Martinez-Olivé, A., 2006. Maestros y escuelas en el siglo XXI en Educare. Nueva época, México. Retrieved from
http://documents.mx/documents/ [Accessed 2015].
241
© 2016 Conscientia Beam. All Rights Reserved.
�International Journal of Education and Practice, 2016, 4(9): 234-242
Mirador University, 2012. Habilidades tecnológicas de profesores y estudiantes (2010-2011). Programa Universidad. Mirador
Universitario, UNAM, México. Retrieved from http://mirador.cuaed.unam.mx/ [Accessed 2015].
Naresh, M., 2004. Market research. An applied approach. 4th Edn., Pearson Education Mexico, SA de CV. pp:115-168.
Pham, H., 2006. Springer handbook of engineering statistics. NY, USA: Springer Science & Business Media. pp: 1120.
Quintana-Albalat, J., 2000. Competencias en tecnologías de información del profesorado de educación infantil y primaria. Revista
Inter
Universitaria
de
Tecnología
Educativa,
España:
166-161.
Retrieved
from
http://www.ub.edu/ntae/jquintana/articles/competicformprof.pdf [Accessed 2015].
Raposo, M., E. Fuentes and M. Gonzalez, 2006. Technological competence development in teacher education. Latin American
Journal of Educational Technology: 525-537.
Reyes-Murillo, E., 1998. Influencia del programa curricular y del trabajo docente en el aprovechamiento escolar en historia del
Perú de alumnos del 3.er grado de educación secundaria. Tesis para optar el Grado Académicode Doctoraen Educación.
Universidad Nacional Mayorde San Marcos, Lima,Perú.
Serrano-Santoyo, A. and E. Martínez-Martínez, 2003. Brecha digital: Mitos y realidades. México: Universidad Autónoma de Baja
California, México. pp:175.
Suárez, J.M., G. Almerich, B. Gargallo and F. Aliaga, 2010. Las competencias en TIC del profesorado y su relación con el uso de
los
recursos
tecnológicos.
Archivos
Analíticos
de
Políticas
Educativas,
18(10).
Retrieved
from
https://dialnet.unirioja.es/servlet/revista?codigo=12280 [Accessed 2015].
Tornimbeni, S., C. Gonzalez, M. Salvetti and M. Barreto, 1998. Attitude toward research with psychology students. Proceedings
of the First Conference of the School of Psychology. National University of Cordoba. Argentina.
Venezky, R. and C. Davis, 2002. Quo vademus? The transformation of schooling in a networked world. Preliminary research
report. Paris: OECD/CERI.
Wills,
M.-S.
and
M.M.
Garcia-Cabrera,
2005.
Skills
training.
University.
REIFOP,
8(1).
Retrieved
from
http://www.aufop.com/aufop/revistas/indice/digital/114.
Views and opinions expressed in this article are the views and opinions of the author(s), International Journal of Education and Practice shall not be
responsible or answerable for any loss, damage or liability etc. caused in relation to/arising out of the use of the content.
242
© 2016 Conscientia Beam. All Rights Reserved.
�
 urbano luna maldonado