Conservation ecology of rare plants within complex
local habitat networks
BENJAMIN J. CRAIN, ANA MARÍA SÁNCHEZ-CUERVO, JEFFREY W. WHITE
and S T E V E N J . S T E I N B E R G
Abstract Effective conservation of rare plant species
requires a detailed understanding of their unique distributions and habitat requirements to identify conservation
targets. Research suggests that local conservation efforts
may be one of the best means for accomplishing this task.
We conducted a geographical analysis of the local distributions of rare plants in Napa County, California, to identify
spatial relationships with individual habitat types. We
measured the potential contribution of individual habitats
to rare plant conservation by integrating analyses on overall
diversity, species per area, specificity-weighted richness,
presence of hotspots, and the composition of the rare plant
community in each habitat type. This combination of
analyses allowed us to determine which habitats are most
significant for rare plant conservation at a local scale. Our
analyses indicated that several habitat types were consistently associated with rare plant species. In broad terms,
grasslands, oak forests, coniferous forests, wetlands, serpentines, chaparral, and rock outcrops were most consistently highlighted. No single habitat stood out in every
analysis however, and therefore we conclude that careful
selection of an assemblage of habitats that best represents
diverse, restricted and unique rare plant communities will
be the most efficient approach to protecting rare plant
habitat at local scales. Accordingly we present a means of
identifying conservation targets and protecting global
biodiversity through local efforts.
Keywords California, conservation targets, environmental
planning, geographical distributions, habitat conservation,
Napa County, species-area models, threatened species
This paper contains supplementary material that can be
found online at http://journals.cambridge.org
BENJAMIN J. CRAIN (Corresponding author) and JEFFREY W. WHITE Department
of Biological Sciences, Humboldt State University, 1 Harpst Street, Arcata, CA,
95521, USA. E-mail bcrainium@yahoo.com
ANA MARÍA SÁNCHEZ-CUERVO Department of Biology, University of Puerto Rico
—Río Piedras, San Juan, Puerto Rico
STEVEN J. STEINBERG Department of Environmental Science and Management,
Humboldt State University, Arcata, USA
Received 19 June 2013. Revision requested 6 August 2013.
Accepted 4 September 2013.
© 2014 Fauna & Flora International, Oryx, Page 1 of 8
http://journals.cambridge.org
Introduction
P
lant taxa dominate lists of rare and threatened species
and should be prioritized for conservation (Dixon &
Cook, 1989; Campbell, 1991; Ellstrand & Elam, 1993;
Sharrock, 2011). Habitat specificity is often used as a primary
criterion for classifying rare species (Rabinowitz, 1981) and a
detailed understanding of the distribution and habitats of
rare plants is critical for proactive conservation planning
and for identifying areas of interest for preservation (Griggs,
1940; Wiser et al., 1998; Wu & Smeins, 2000; Peterson, 2006;
Fiedler et al., 2007). The first stage of systematic conservation planning, which is a structured framework for
identifying and maintaining priority areas for biodiversity
preservation, prioritizes the compilation of distribution
data for rare and threatened species as they are usually
underrepresented when establishing new protected areas
(Margules & Pressey, 2000). Some countries (e.g. USA,
Mexico, Colombia, Italy, Spain and France) have initiated
broad conservation strategies that focus on the preservation
of rare plants and their habitats at national scales (Planta
Europa, 2003; CONABIO, 2008; García et al., 2010; CNHP,
2011; Sharrock, 2011). These large-scale conservation strategies are important for raising public awareness and
prompting political action but smaller scale studies are
also needed for local conservation practitioners.
The scale at which geographical analyses are conducted
is an important consideration for conservation biologists
and government stakeholders (Abbitt et al., 2000; Wu &
Smeins, 2000). Although global efforts are valuable for
providing general focus and support (Myers, 2003), studies
have found that rare plants often occur in small patches
of habitat that are manageable at local scales (Kelly &
Fletcher, 1994; Gillespie, 2005; Safford et al., 2005; Fiedler
et al., 2007) and therefore county, municipality or parishlevel conservation managers may be able to preserve them
(Press et al., 1996; Wiser et al., 1998). With information on
the distributions and habitat requirements of rare plants,
local governments, researchers and private stakeholders
can acquire, regulate and manage land to sustain existing
populations and to facilitate range expansion or migration
(Press et al., 1996; Fiedler et al., 2007; Kelly & Goulden,
2008). Consequently, documenting the local distribution of
rare plants and their key vegetation associations provides an
opportunity for local conservation planners to influence
biodiversity globally.
doi:10.1017/S0030605313001245
Downloaded: 20 Mar 2014
IP address: 166.4.81.227
�2
B. J. Crain et al.
& McQuaid, 1981; Crain & White, 2013) and a disproportionately large number of rare and endemic plants exist there
(Stebbins & Major, 1965; Parisi, 2003; Crain & White, 2011,
2013; CNDDB, 2013a,b) and consequently Napa County is
an ideal study area for testing methods aimed at protecting
global plant diversity within a local jurisdiction. The
distributions of many of these plant species have been
documented by geographical analyses (CNDDB, 2006;
Viers et al., 2006; Crain et al., 2011).
Methods
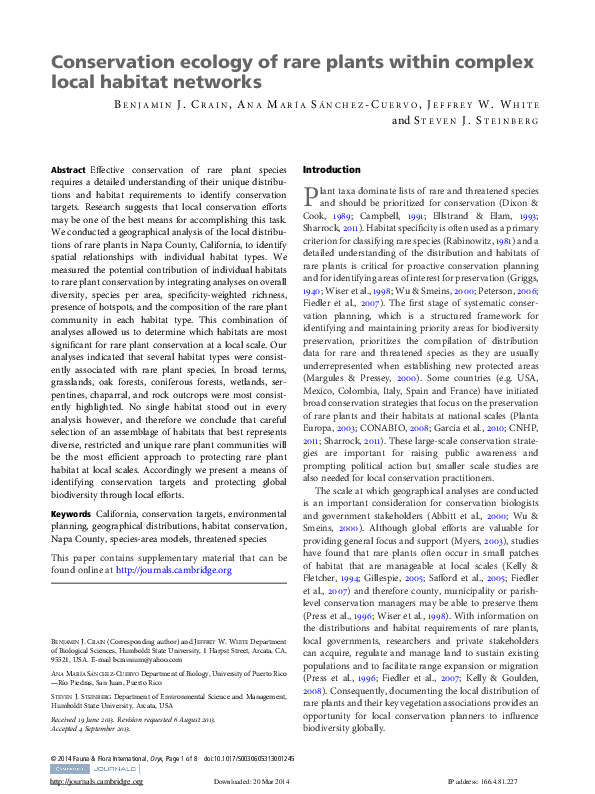
FIG. 1 Napa County, California. The rectangle on the inset
shows the location of the main map in California.
For these reasons our overall objective was to combine
data on rare plant distribution and land cover (i.e. habitat
types) to decipher which habitats are most important for
local conservation of rare plant diversity. We had five
specific aims: (1) determine which types of habitat rare
plants occupy, to identify important habitats at a local scale,
(2) determine if hotspots of rare plant richness correspond
with particular habitat types, (3) determine if rare plants
show signs of habitat specificity at a local scale, (4)
determine if habitat-specific species correspond with
particular habitat types, and (5) analyse the composition
of rare plant communities in different habitat types to
identify assemblages of habitats that would jointly support
the greatest level of diversity. Our methodology is intended
to demonstrate how local management groups can highlight
specific habitats that merit special attention in conservation
and land-acquisition plans.
Study area
This analysis was conducted in Napa County, California
(Fig. 1), which constitutes an important biological component of the California Floristic Province (Skinner & Pavlik,
1994; Chaplin et al., 2000; Parisi, 2003). The floristic
diversity of Napa County is unique (Major, 1963; Neilson
To determine the extent of overlap between the local
distribution of rare plants and land-cover types (i.e. habitat
types) we overlaid two geographical data layers comprising
multiple polygons. The first layer consisted of polygons
showing the distribution of 55 rare plants in Napa County
(Supplementary Table 1); i.e. plants categorized as critically
imperilled, imperilled, or vulnerable to extirpation at global
or state levels according to criteria outlined by NatureServe
(CNDDB, 2006). These species have restricted distributions
or low population numbers or they are experiencing steep
declines (Bittman, 2001; Master et al., 2009). The second
polygon layer was a high-resolution land-cover map of
Napa County (Thorne et al., 2004; Supplementary Table 2).
We excluded human-dominated land use (e.g. urban and
agriculture) because our analysis focused on conservation of
natural habitats.
Using the spatial join tool in the geographical information system (GIS) ArcGIS v. 9.3.1 (ESRI, Redlands, USA)
we were able to overlay and fuse these two geographical
layers and subsequently identify correspondence between
the distribution of rare plants and the various habitats in
Napa County. To produce a rare-plant richness or hotspots
layer the distributions of individual rare species (CNDDB,
2006) were coded for presence and absence, overlaid and
summed. The resulting layer showed polygons coded for the
number of rare plants within them. The richest 5% of the
polygons occupied by multiple rare plants were considered
hotspots. Lastly we used the spatial join tool to create a
spatially explicit layer that identified the habitat type(s) in
which each hotspot occurred.
To identify important habitats in Napa County we used
data from our initial spatial join to calculate the number of
rare plant species per habitat type. We also calculated the
percentage of each habitat type that was occupied by rare
plants. The tendency for larger patches of habitat to contain
greater numbers of species is well established (Connor &
McCoy, 2001), therefore to identify important habitats,
accounting for the differences in the overall area covered by
each habitat type, we generated a species-richness–area
model with log transformed data and the linear form of
the power function (Veech, 2000). Following established
© 2014 Fauna & Flora International, Oryx, 1–8
http://journals.cambridge.org
Downloaded: 20 Mar 2014
IP address: 166.4.81.227
�Conservation ecology of rare plants
protocols (Pomeroy, 1993; Ceballos & Brown, 1995; Estill &
Cruzan, 2001) we identified points that were furthest from
the expected species richness values predicted by the model
to identify habitat types that supported a greater or lesser
number of rare species than would be expected because of
the effects of area alone.
To determine if hotspots of rare plant richness
correspond with particular habitat types we calculated the
overall area of rare plant hotspots within each habitat type.
Next, we calculated the percentage of each habitat type that
was occupied by hotspots to account for the differences in
the overall area covered by each habitat type. This process
allowed us to determine if habitat types occupied by
hotspots were distinct from those occupied by individual
rare plants.
To determine if individual rare plant species were
restricted to a few habitat types, as noted by Press et al.
(1996) for example, or if they were more cosmopolitan,
we calculated the number of habitats in which each rare
plant occurred. We used these data to create a frequency
histogram of the number of occupied habitats per species.
We calculated the skewness of the histogram as the third
central moment (g1) of the distribution and the significance
of the skewness statistic was tested using a two-tailed t-test
(Estill & Cruzan, 2001; Sokal & Rohlf, 2012). Positive values
of g1 signify right-skewed data or a tendency for species to
occupy a small number of habitat types, negative g1 values
indicate that species generally occupy several habitat types,
and a value of zero would suggest no skew in the data.
To assess which habitat types were associated with high
richness levels, considering habitat specificity, we calculated
a specificity-weighted richness index for each habitat type,
using methods similar to those outlined by Estill & Cruzan
(2001). We calculated a habitat specificity value for each rare
plant species by taking the inverse of the number of habitat
types in which it occurred. We then summed the habitat
specificity values of the species occurring within each
habitat type:
SWRIhabitat type =
n
�
1
i=1
vi
(1)
where vi is the number of habitat types that species i occurs
in and n is the number of rare species within the habitat
type. This analysis enabled us to identify habitats that
supported a diversity of rare plants while giving weight to
specialized species.
To detect differences in the composition of rare species
among habitat types we performed a non-metric multidimensional scaling ordination analysis. We developed a
main matrix containing data on the presence or absence of
rare species per habitat. We selected a Jaccard distance
measure and the autopilot mode in PC-Ord v. 5.0 (McCune
& Mefford, 2002) to find the dimension of our data (we used
a step down in dimensionality). The final analysis included
50 runs with real data, stability criterion 5 0.00001, 200
iterations to assess stability, 250 maximum iterations, initial
step length 5 0.20, and random starting coordinates. The
percentage correlation with the distance matrix (r) was
calculated to evaluate the efficiency of the ordination
distance. With this analysis we elucidated which habitats
were the most unique in terms of rare plant composition,
allowing us to identify those that could collectively support
the greatest overall diversity of rare plants in Napa County.
Results
The rare plants of Napa County overlapped with 50 local
habitat types (Supplementary Table 2). The mean number of
species per habitat was 15.64 ± SD 8.55. Overall, California
Annual Grasslands (3) had the greatest number of rare plant
species (n 5 40), Upland Annual Grasslands (14) had the
second highest number (n 5 33) and Mixed Oak (6) ranked
third (n 5 30). There were 27 rare plant species in each of
Blue Oak (2) and Chamise (4). An additional 12 habitat
types had . 20 rare species and 17 habitat types had > 10
rare species. Only five habitat types were not occupied by
rare species: Sparse California Juniper Steep Rock Outcrops
(44), Coyote Brush (55), Lotus scoparius (56), Sparse Bush
Lupine Rock Outcrops (57), and California Juniper (59). The
majority of habitat types in Napa County were occupied by
at least one rare species (Supplementary Table 2).
The percentage of each habitat type that was occupied by
rare plant species indicated the probability of a rare plant
occupying that particular habitat (Supplementary Table 2).
The mean percentage occupied was 17.26 ± SD 16.03% of a
given habitat. Overall, Sugar Pine/Canyon Oak (58) had the
largest percentage occupied by rare plants (100%).
Ponderosa Pine (53) and Douglas-fir/Ponderosa Pine (16)
were occupied by rare plants in c. 50% of their ranges and
Canyon Live Oak (40) and Tanbark Oak (51) corresponded
with rare plants in c. 35% of their ranges. Conversely,
Chamise/Wedgeleaf Ceanothus (20), Interior Live Oak/
Foothill Pine (11), Interior Live Oak (23), Scrub Interior Live
Oak Mesic (15), and Sargent Cypress (32) were all occupied
by rare plants in , 5% of their overall range.
The percentage of the land area of Napa County
occupied by each habitat type also varied greatly (Thorne
et al., 2004; Supplementary Table 2) and presumably
affected the overall number of rare plant species that
occupied a given habitat. The species–area model showed
that species richness was positively correlated with the area
occupied by individual habitat types (r2 5 0.67; P , 0.01;
Fig. 2). Five habitat types had richness values furthest above
the values predicted by the model: Carex spp./Wet Meadow
(48), Rock Outcrops (35), Brewer’s Willow (52), Mixed
Willow (42), and Bulrush/Cattail (49). Conversely, Coast
© 2014 Fauna & Flora International, Oryx, 1–8
http://journals.cambridge.org
Downloaded: 20 Mar 2014
IP address: 166.4.81.227
3
�4
B. J. Crain et al.
FIG. 2 The relationship between species richness and area for
rare plants in the various habitat types in Napa County,
California (Fig. 1). Filled, numbered points indicate the habitat
types with richness values furthest above or below the value
predicted by the model (habitat numbers correspond with
Supplementary Table 2).
Redwood (47), Interior Live Oak/Foothill Pine (11),
Sclerophyllous Shrubland (26), Riverine, Lacustrine, and
Tidal Mudflats (46), and Interior Live Oak (23) had richness
values furthest below the values predicted by the model.
Overall, hotspots of rare plant richness occurred in 48
habitat types in Napa County (Supplementary Table 2). The
mean area of hotspots in individual habitat types was
0.75 ± SD 1.04 km2. Hotspots overlapped with Douglas-fir/
Ponderosa Pine (16) most frequently, i.e. in 3.99 km2.
Hotspots also coincided with 3.39 km2 of California Annual
Grasslands (3), 3.06 km2 of Douglas-fir (12), 3.04 km2 of
Mixed Manzanita (17), and 2.84 km2 of Leather Oak Xeric
Serpentine (7). The richest hotspots, which contained eight
rare plant species, coincided with Douglas-fir (12), Knobcone
Pine (21), Mixed Manzanita (17), and Rock Outcrops (35).
Canyon Live Oak (40) corresponded with a hotspot
containing seven rare plant taxa. Of the habitats that were
occupied by at least one rare plant, only two types,
Coast Redwood (47) and Sugar Pine/Canyon Oak (58), did
not correspond to any hotspots.
The percentage of each habitat type in Napa County
that was occupied by rare plant hotspots indicated the
probability of a hotspot occurring within that particular
habitat (Supplementary Table 2). The mean percentage
of each habitat type that was occupied by a hotspot was
4.36 ± SD 6.28%. Ponderosa Pine (53) was occupied by
hotspots in the largest proportion of its range, i.e. 28%.
Serpentine Barrens (54) and Tanbark Oak (51) were
occupied by hotspots in . 20% of their ranges. Canyon
Live Oak (40) and Black Oak (29) were occupied by hotspots
in . 10% of their ranges. Aside from habitat types that
did not coincide with any hotspots, those occupied in the
lowest percentage of their range (, 0.5%) included
FIG. 3 Frequency histogram showing the number of habitats
occupied by individual rare plant species in Napa County,
California (Fig. 1).
Riverine, Lacustrine, and Tidal Mudflats (46), WinterRain Sclerophyll Forest (41) and Scrub Interior Live Oak
Mesic (15).
A histogram showing the number of habitat types in
Napa County occupied by each rare plant species illustrates
how restricted they are in terms of habitat specificity (Fig. 3).
The mean number of habitats in which a rare plant species
occurred was 14.21 ± SD 10.84 (mode 6). Two species were
found only in one type of habitat: Poa napensis Beetle
was restricted to Bulrush/Cattail (49) and Castilleja affinis
Hook. & Arn. ssp. neglecta (E.M. Zeile) Chuang & Heckard
was found only in California Annual Grasslands (3). Five
species were found only in two types of habitat: Astragalus
tener A. Gray var. tener, Balsamorhiza macrolepis Sharp
var. macrolepis, Legenere limosa (E. Greene) McVaugh,
Limnanthes vinculans Ornd., and Rhynchospora californica
Gale. The frequency histogram indicated that rare plants
in Napa County had a tendency to occupy a smaller
number of habitats as opposed to being distributed more
generally. The data were moderately right (positively)
skewed (g1 5 0.66) and the pattern was highly significant
(t 5 12.19, P 5 0.001).
Our calculations of specificity-weighted richness index
showed that the maximum possible value for this analysis,
i.e. the value if every species occurred in an individual
habitat, was 9.39. Although the mean specificity-weighted
richness index value for Napa County was 1.10 ± SD 0.91,
several habitat types stood out as having particularly high
values (Supplementary Table 2). California Annual Grasslands (3) had the largest value (5.24), followed by Upland
Annual Grasslands (3.72). Three other habitat types had
values . 2.00: Bulrush/Cattail (49), Coast Live Oak (13)
and Valley Oak Riparian Forest (22) had values of 2.24, 2.06
and 2.04, respectively. Five of the habitat types containing
rare species had low values. Sugar Pine/Canyon Oak (58)
had the lowest value (0.02), followed by Coast Redwood
© 2014 Fauna & Flora International, Oryx, 1–8
http://journals.cambridge.org
Downloaded: 20 Mar 2014
IP address: 166.4.81.227
�Conservation ecology of rare plants
ordination. Several of the habitats highlighted by the
preceding analyses were positioned at the extremities of
the ordination axes, indicating large differences in the
composition of their rare species communities with respect
to the majority. Some habitats were clustered centrally in the
model, indicating similarities in the composition of their
communities.
Grassland habitats were repeatedly highlighted in this
analysis when considering richness, hotspots and specificity-weighted richness. Likewise, several oak-dominated
habitat types were highlighted in the context of these
measures. Five coniferous habitats and four wetland/
riparian habitats were among the most important in at
least one analysis. Three habitats associated with the
chaparral ecoregion (Olson et al., 2001) and three serpentine
habitats were also highlighted by at least one measure.
FIG. 4 Non-metric multidimensional scaling ordination analysis
of habitat types in Napa County, based on rare species
composition. The species listed outside the ordination plot are
those with the highest correlation values with the corresponding
axis that influence the ordination. The black points indicate the
important habitat types in terms of richness and/or presence of
hotspots. Collectively, the numbered points represent a series of
habitats that would efficiently support rare species in Napa
County if conserved.
(47), Serpentine Barrens (54), Riverine, Lacustrine, and
Tidal Mudflats (46) and Foothill Pine Chaparral (39), with
values of 0.14, 0.21, 0.25 and 0.26, respectively.
A three-dimensional non-metric multidimensional scaling explained 83.9% of the variation in rare species
composition between habitats, with a final stress value of
13.7 (P 5 0.004; Fig. 4). Axis 1 accounted for 19.3% of the
variation in the model, axis 2 accounted for 29.1% and axis 3
accounted for 35.5%. Ten rare species showed the highest
correlation values with the ordination, indicating they have
the strongest influence on determining the ordination
structure. Axis 1 (which accounted for 19.3% of the variation
in the model) was positively correlated with Castilleja
rubicundula ssp. rubicundula (Jepson) Chuang & Heckard
(r 5 0.62) and Fritillaria pluriflora Benth. (r 5 0.58) but
negatively correlated with Amorpha californica Nutt. var.
napensis Jepson (r 5 0.56), Lupinus sericatus Kellogg
(r 5 0.50) and Plagiobothrys strictus (E. Greene)
I.M. Johnston (r 5 0.51). Axis 2 (29.1% of the variation)
was negatively correlated only with Streptanthus morrisonii
F.W. Hoffm. (r 5 0.50). Axis 3 (35.5% of the variation) was
positively correlated with Streptanthus hesperidis Jeps.
(r 5 0.56) but negatively correlated with Chloropyron
molle (A. Gray) A. Heller ssp. molle (r 5 0.81), Lilaeopsis
masonii Mathias & Constance (r 5 0.75) and Trifolium
amoenum E. Greene (r 5 0.70). Accordingly, these species
had the greatest influence on the overall structure of the
Discussion
The initial stages of the systematic conservation planning
framework outlined by Margules & Pressey (2000) involve
compiling data on the locations of rare or threatened species
and identifying important habitats as targets for conservation. Our methodology can highlight the most important
habitats for rare plant conservation through the use of
multiple analyses focused on measures of occupancy,
richness, habitat specificity and community composition.
Distribution analyses can help to identify habitats that
sustain the greatest number of species and richness hotspots
(Fiedler et al., 2007; Crain et al., 2011) and habitat specificity
measures can help balance conservation efforts between
habitats that sustain high levels of diversity and those that
harbour species with restricted distributions. Ordination
models can also provide guidance, particularly if used in
conjunction with the other analyses (Ren et al., 2012). Our
study highlights the importance of analysing various
characteristics of the habitats of rare plants when identifying
conservation targets at local scales.
Our results from Napa County indicate that rare plant
species and richness hotspots overlap with a diverse range of
habitat types. The significance of habitats similar to those
highlighted in Napa County (i.e. grasslands, oak forests,
coniferous forests, wetlands, chaparral, serpentines and rock
outcrops) has been highlighted in other parts of California
and in numerous other locations (Dahl, 1990; Pavlik et al.,
1993; Paal, 1998; Lanner, 1999; Maisels et al., 2000; Olson &
Dinerstein, 2002; Lavergne et al., 2004; MEA, 2005; Pykälä
et al., 2005; Quinn & Keeley, 2006; Alexander et al., 2007;
Stromberg et al., 2007; Snow, 2010; Duffy & Kahara, 2011;
Garone, 2011; Roche et al., 2012). However, many habitats in
the same general categories were less important for rare
plants. We were only able to observe these subtle differences
by compiling high-resolution habitat (Thorne et al., 2004)
and plant distribution data (CNDDB, 2006) at the initial
© 2014 Fauna & Flora International, Oryx, 1–8
http://journals.cambridge.org
Downloaded: 20 Mar 2014
IP address: 166.4.81.227
5
�6
B. J. Crain et al.
conservation planning stage. Additional studies are needed
in other locations to determine if the local associations
between rare plants and specific habitat types in Napa
County are representative of a broader trend.
By using ordination analyses in conjunction with other
analyses to identify conservation targets we demonstrate
how planners can protect habitat for the greatest diversity
of rare plants more efficiently by focusing on assemblages
of important habitat types. The results of ordination
analyses can be used to avoid duplicating efforts on habitats
that offer diminishing returns. By targeting a series of
habitats in Napa County that represent various positions
in the ordination model, habitat for the majority of rare
plants can be protected locally. For example, by focusing
conservation efforts on California Annual Grasslands (3),
Douglas-fir (12), Canyon Live Oak (40), Carex spp./Wet
Meadow (48), Bulrush/Cattail (49), Brewer’s Willow (52)
and Serpentine Barrens (54), portions of the realized or
potential habitat for 100% of the species included in this
analysis could be protected (Fig. 4). This assemblage
includes habitats highlighted for overall diversity, presence
of hotspots and specificity-weighted richness, and therefore
it is apparent that ordination models are useful guides for
increasing efficiency in conservation planning. This habitat
assemblage is not the only one that would be appropriate for
rare plant conservation; there is flexibility in the choices
available. For example, if areas of California Annual
Grasslands (3) were unavailable for acquisition, another
habitat in a similar position on the ordination model, such
as Upland Annual Grasslands (14), could be chosen to
ensure that a habitat with a similar rare plant community is
represented. In this instance potential habitat for . 75% of
all species would still be included in the conservation plan.
The use of ordination models therefore allows planners to
take an opportunistic approach during the decision-making
process.
This flexibility is an important attribute of our proposed
methodology because the availability of important habitats
is variable. In Napa County some important habitats,
such as California Annual Grasslands (3) and Douglas Fir
forests (12), are abundant (Supplementary Table 2; Thorne
et al., 2004) and therefore there may be more opportunities
to acquire large patches of land in these habitats and to
protect larger contiguous patches capable of sustaining
numerous species (Roberge & Angelstam, 2004). These
abundant habitats can also be targeted during reintroduction or assisted migration projects (Fiedler et al., 2007),
to prepare for shifting conditions as a result of climate
change. Conversely, important habitats that are rarer in
Napa County, e.g. Bulrush/Cattail marshes (49) and Rock
Outcrops (35), can be prioritized for acquisition and
restoration projects as opportunities to protect rare plants
in these habitats may be limited in other areas. Accordingly,
this example highlights how the proposed methods afford
local managers the guidance and flexibility necessary to
protect conservation targets.
Some caveats regarding the proposed methodology
warrant discussion. Although fine-scale habitat and plant
distribution maps are available for numerous regions that
support important rare plant communities (CDCS, 2000;
Helmer et al., 2002; Tozer, 2003; CNRG, 2004; Driese et al.,
2004; CNDDB, 2006; Helme & Desmet, 2006; Panagos
et al., 2011), the suitability of our analyses is dependent
on the availability of local distribution data. Even though
the methods presented could be considered data intensive,
they require no more data than other local distribution
and habitat models yet they produce more focused and
efficient targets then other methods. As with other
distribution analyses such as hotspot models, the methodology streamlines conservation efforts by identifying
conservation targets for multiple species simultaneously.
Our methods provide additional predictive capabilities
because results from individual analyses may be applied,
albeit cautiously, to other areas with similar species
communities and habitats in the event that distribution
data are lacking in those areas. Where data are unavailable
local agencies are encouraged to begin data collection as a
starting point for systematic conservation planning
(Margules & Pressey, 2000), using lower resolution data to
identify broader conservation targets that can be refined
with subsequent analyses (Wu & Smeins, 2000). These
initial steps are particularly important in regions that have
already been highlighted as diversity hotspots at global or
national scales (Myers et al., 2000) as multiple-scale habitat
analyses are important for focusing conservation efforts
(Wu & Smeins, 2000). Our geographical analysis overlooks
abiotic conditions, vegetation structure, microhabitat features, soil type or the presence of mutualistic partners
but these parameters can be added to our habitat models
(e.g. using GIS and ordination analysis) if necessary.
GIS technologies and associated methodologies facilitate
such tasks, making comparable studies more feasible
(Frederiksen & Lawesson, 1992; Helmer et al., 2002; Driese
et al., 2004). Our results are in accordance with the findings
of earlier studies (Press et al., 1996; Sharrock, 2011) that
suggest local jurisdictions are empowered for conservation
of rare and threatened plant species. In many places
legislation facilitates the protection of rare plant communities by local governments and conservation agencies. The
methods employed here can be applied in other counties,
municipalities and parishes worldwide as researchers
continue to collect the comprehensive data sets that are
essential for local-level analyses. This process will empower
local communities and agencies and remove some of the
burden that is often misplaced on federal governments
(Press et al., 1996; Sharrock, 2011). It is clear that local
conservation efforts can influence biodiversity conservation
at greater scales if properly guided.
© 2014 Fauna & Flora International, Oryx, 1–8
http://journals.cambridge.org
Downloaded: 20 Mar 2014
IP address: 166.4.81.227
�Conservation ecology of rare plants
Acknowledgements
Special thanks to our families and friends for their ongoing
support. We also thank members of the Biodiversity
Research and Education Laboratory at Humboldt State
University and of the GIS and Remote Sensing Laboratory at
the International Institute of Tropical Forestry. We are
grateful for the assistance of Carolina Monmany.
References
A B B I T T , R., S C O T T , J. & W I L C O V E , D. (2000) The geography of
vulnerability: incorporating species geography and human
development patterns into conservation planning. Biological
Conservation, 96, 169–175.
A L E X A N D E R , E., C O L E M A N , R., K E E L E R -W O L F E , T. & H A R R I S O N , S.
(2007) Serpentine Geoecology of Western North America: Geology,
Soils, and Vegetation. Oxford University Press, New York, USA.
B I T T M A N , R. (2001) The California natural diversity database: a natural
heritage program for rare species and vegetation. Fremontia, 29,
57–62.
C A M P B E L L , F. (1991) Endangered plant species shortchanged:
increased funding needed. Endangered Species Update, 9, 6.
CDCS (C O R P O R A T I O N O F T H E D I S T R I C T O F C E N T R A L S A A N I C H )
(2000) Municipality of Central Saanich Resource Atlas: Vegetation
Mapping. Http://www.centralsaanich.ca/Assets/Central+Saanich/
Publications/CS+Resource+Atlas/Vegetation.pdf?method=1
[accessed 13 November 2013].
C E B A L LO S , G. & B R O W N , J.H. (1995) Global patterns of mammalian
diversity, endemism, and endangerment. Conservation Biology, 9,
559–568.
C H A P L I N , S., G E R R A R D , R., W AT S O N , H., M A S T E R , L. & F L A C K , S.
(2000) The geography of imperilment: targeting conservation
toward critical biodiversity areas. In Precious Heritage: The Status of
Biodiversity in the United States (eds B. Stein, L. Kutner & J. Adams),
pp. 159–199. Oxford University Press, New York, USA.
CNDDB (C A L I F O R N I A N AT U R A L D I V E R S I T Y D AT A B A S E ) (2006)
RareFind v. 3.0.5. California Department of Fish and Game
Biogeographic Data Branch, Sacramento, USA.
CNDDB (C A L I F O R N I A N AT U R A L D I V E R S I T Y D AT A B A S E ) (2013a)
Special Vascular Plants, Bryophytes and Lichens List. California
Department of Fish and Wildlife, Sacramento, USA.
CNDDB (C A L I F O R N I A N AT U R A L D I V E R S I T Y D AT A B A S E ) (2013b)
State and Federally Listed Endangered, Threatened and Rare Plants
of California. California Department of Fish and Game,
Sacramento, USA.
CNHP (C O LO R A D O N AT U R A L H E R I T A G E P R O G R A M ) (2011) Colorado
Rare Plant Conservation Initiative. Http://www.cnhp.colostate.edu/
teams/botany.asp#initiative [accessed 14 November 2013].
CNRG (C O N S E R VAT I O N A N D N AT U R A L R E S O U R C E S G R O U P ) (2004)
Remnant Vegetation of the Palmerston Municipality. Department of
Infrastructure, Planning and Environment, Northern Territory,
Australia.
CONABIO (C O M I S I Ó N N AC I O N A L P A R A E L C O N O C I M I E N T O Y U S O
D E L A B I O D I V E R S I D A D ) (2008) Estrategia Mexicana para la
Conservación Vegetal: objetivos y metas, pp. 1–36. CONABIO,
Mexico City, Mexico.
C O N N O R , E. & M C C O Y , E. (2001) Species–area relationships. In
Encyclopedia of Biodiversity (ed. S. Levin), pp. 397–411. Academic
Press, New York, USA.
C R A I N , B. & W H I T E , J. (2011) Categorizing locally rare plant taxa for
conservation status. Biodiversity and Conservation, 20, 451–463.
C R A I N , B., W H I T E , J. & S T E I N B E R G , S. (2011) Geographic discrepancies
between global and local rarity richness patterns and the
implications for conservation. Biodiversity and Conservation, 20,
3489–3500.
C R A I N , B.J. & W H I T E , J.W. (2013) A checklist and floristic summary
of the vascular plants of Napa County, California. Phytotaxa, 95,
1–60.
D A H L , T. (1990) Wetlands Losses in the United States, 1780’s to 1980’s.
U.S. Department of the Interior, Fish and Wildlife Service,
Washington, DC, USA.
D I X O N , P. & C O O K , R. (1989) Science, planning, and the recovery of
endangered plants. Endangered Species Update, 6, 11–14.
D R I E S E , K.L., R E I N E R S , W.A., L OV E T T , G.M. & S I M K I N , S.M. (2004)
A vegetation map for the Catskill Park, NY, derived from multitemporal landsat imagery and GIS data. Northeastern Naturalist,
11, 421–442.
D U F F Y , W. & K A H A R A , S. (2011) Wetland ecosystem services in
California’s central valley and implications for the wetland reserve
program. Ecological Applications, 21, S18–S30.
E L L S T R A N D , N. & E L A M , D. (1993) Population genetic consequences of
small population size—implications for plant conservation. Annual
Review of Ecology and Systematics, 24, 217–242.
E S T I L L , J. & C R U Z A N , M. (2001) Phytogeography of rare plant species
endemic to the southeastern United States. Castanea, 66, 3–23.
F I E D L E R , P., K E E V E R , M., G R E W E L L , B. & P A R T R I D G E , D. (2007) Rare
plants in the Golden Gate Estuary (California): the relationship
between scale and understanding. Australian Journal of Botany,
55, 206–220.
F R E D E R I K S E N , P. & L AW E S S O N , J.E. (1992) Vegetation types and
patterns in Senegal based on multivariate analysis of field and
NOAA-AVHRR satellite data. Journal of Vegetation Science, 3,
535–544.
G A R C Í A , H., M O R E N O , L.A., L O N D O Ñ O , C. & S O F R O N Y , C. (2010)
Estrategia Nacional para la Conservación de Plantas: actualización
de los antecedentes normativos y políticos, y revisión de avances.
Instituto de Investigación de Recursos Biológicos Alexander von
Humboldt y Red Nacional de Jardines Botánicos, Bogotá, Colombia.
G A R O N E , P. (2011) The Fall and Rise of the Wetlands of California’s
Great Central Valley. University of California Press, Berkeley, USA.
G I L L E S P I E , I. (2005) Habitat characteristics and distribution of
Erodium macrophyllum (Geraniaceae). Madroño, 52, 53–59.
G R I G G S , R. (1940) The ecology of rare plants. Bulletin of the Torrey
Botanical Club, 67, 575–594.
H E L M E , N. & D E S M E T , P.G. (2006) A Description of the Endemic Flora
and Vegetation of the Kamiesberg Uplands, Namaqualand, South
Africa. Report for Critical Ecosystem Partnership Fund (CEPF)
Succulent Karoo Ecosystem Planning (SKEP). Http://www.cepf.net/
Documents/helme_desmet.pdf [accessed 14 November 2013].
H E L M E R , E.H., R A M O S , O., L O P E Z , T., Q U I Ñ O N E S , M. & D I A Z , W.
(2002) Mapping the forest type and land cover of Puerto Rico, a
component of the Caribbean biodiversity hotspot. Caribbean
Journal of Science, 38, 165–183.
K E L LY , A. & G O U L D E N , M. (2008) Rapid shifts in plant distribution
with recent climate change. Proceedings of the National Academy of
Sciences of the United States of America, 105, 11823–11826.
K E L LY , J. & F L E T C H E R , G. (1994) Habitat correlates and distribution of
Cordylanthus maritimus (Scrophulariaceae) on Tomales Bay,
California. Madroño, 41, 316–327.
L A N N E R , R. (1999) Conifers of California. Cachuma Press, Los Olivos,
USA.
L AV E R G N E , S., T H O M P S O N , J., G A R N I E R , E. & D E B U S S C H E , M. (2004)
The biology and ecology of narrow endemic and widespread
plants: a comparative study of trait variation in 20 congeneric pairs.
Oikos, 107, 505–518.
© 2014 Fauna & Flora International, Oryx, 1–8
http://journals.cambridge.org
Downloaded: 20 Mar 2014
IP address: 166.4.81.227
7
�8
B. J. Crain et al.
M A I S E L S , F., C H E E K , M. & W I L D , C. (2000) Rare plants on Mount Oku
summit, Cameroon. Oryx, 34, 136–140.
M A J O R , J. (1963) Checklist of Vascular Plants in Yolo, Sacramento, and
Napa Counties, California. University of California Library, Davis,
USA.
M A R G U L E S , C.R. & P R E S S E Y , R.L. (2000) Systematic conservation
planning. Nature, 405, 243–253.
M A S T E R , L., F A B E R -L A N G E N D O E N , D., B I T T M A N , R.,
H A M M E R S O N , G., H E I D E L , B., N I C H O L S , J. et al. (2009) NatureServe
Conservation Status Assessments: Factors for Assessing Extinction
Risk. NatureServe, Arlington, USA.
M C C U N E , B. & M E F F O R D , M. (2002) PC-ORD Multivariate Analysis of
Ecological Data. MjM Software, Gleneden Beach, USA.
MEA (M I L L E N N I U M E C O S Y S T E M A S S E S S M E N T ) (2005) Millennium
Ecosystem Assessment Global Assessment Reports. Island Press,
Washington, DC, USA.
M Y E R S , N. (2003) Biodiversity hotspots revisited. BioScience, 53,
916–917.
M Y E R S , N., M I T T E R M E I E R , R.A., M I T T E R M E I E R , C.G., D A
F O N S E C A , G.A.B. & K E N T , J. (2000) Biodiversity hotspots for
conservation priorities. Nature, 403, 853–858.
N E I L S O N , J. & M C Q U A I D , D. (1981) Flora of the Mayacamas
Mountains. Ecoview Environmental Consultants, Napa, USA.
O L S O N , D. & D I N E R S T E I N , E. (2002) The global 200: priority
ecoregions for global conservation. Annals of the Missouri Botanical
Garden, 89, 199–224.
O L S O N , D., D I N E R S T E I N , E., W I K R A M A N AY A K E , E., B U R G E S S , N.,
P O W E L L , G., U N D E R WO O D , E. et al. (2001) Terrestrial ecoregions of
the world: a new map of life on earth. BioScience, 51, 933–938.
P A A L , J. (1998) Rare and threatened plant communities of Estonia.
Biodiversity and Conservation, 7, 1027–1049.
P A N A G O S , P., J O N E S , A., B O S C O , C. & S E N T H I L -K U M A R , P.S. (2011)
European digital archive on soil maps (EuDASM): preserving
important soil data for public free access. International Journal of
Digital Earth, 4, 434–443.
PARISI, M. (ed.) (2003) Atlas of the Biodiversity of California. California
Department of Fish and Game, Sacramento, USA.
P AV L I K , B., M U I C K , P. & J O H N S O N , S. (1993) Oaks of California.
Cachuma Press, Los Olivos, USA.
P E T E R S O N , A. (2006) Uses and requirements of ecological niche
models and related distributional models. Biodiversity Informatics,
3, 59–72.
P L A N TA E U R O P A (2003) A Joint Council of Europe and Planta Europa
European Plant Conservation Strategy. Https://wcd.coe.int/com.
instranet.InstraServlet?command5com.instranet.CmdBlobGet&In
stranetImage51336624&SecMode51&DocId51462576&Usage52
[accessed 14 November 2013].
P O M E R O Y , D. (1993) Centers of high biodiversity in Africa.
Conservation Biology, 7, 901–907.
P R E S S , D., D O A K , D. & S T E I N B E R G , P. (1996) The role of local
government in conservation of rare species. Conservation Biology,
10, 1538–1548.
P Y K Ä L Ä , J., L U O T O , M., H E I K K I N E N , R. & K O N T U L A , T. (2005) Plant
species richness and persistence of rare plants in abandoned seminatural grasslands in northern Europe. Basic and Applied Ecology, 6,
25–33.
Q U I N N , R. & K E E L E Y , S. (2006) Introduction to California Chaparral.
University of California Press, Berkeley, USA.
R A B I N O W I T Z , D. (1981) Seven forms of rarity. In The Biological Aspects
of Rare Plant Conservation (ed. H. Synge), pp. 205–217. John Wiley
& Sons, Chichester, UK.
R E N , H., Z E N G , S., L I , L., Z H A N G , Q., Y A N G , L., W A N G , J. et al. (2012)
Reintroduction of Tigridiopalma magnifica, a rare and Critically
Endangered herb endemic to China. Oryx, 46, 391–398.
R O B E R G E , J. & A N G E L S T A M , A. (2004) Usefulness of the umbrella
species concept as a conservation tool. Conservation Biology, 18,
76–85.
R O C H E , L., R I C E , K. & T AT E , K. (2012) Oak conservation maintains
native grass stands in an oak woodland–annual grassland system.
Biodiversity and Conservation, 21, 2555–2568.
S A F F O R D , H., V I E R S , J. & H A R R I S O N , S. (2005) Serpentine endemism
in the California flora: a database of serpentine affinity. Madroño, 52,
222–257.
S H A R R O C K , S. (2011) Global Strategy for Plant Conservation: A Guide to
the GSPC. All the Targets, Objectives and Facts. Botanic Gardens
Conservation International, Richmond, UK.
S K I N N E R , M. & P AV L I K , B. (1994) Inventory of Rare and Endangered
Vascular Plants of California. California Native Plant Society,
Sacramento, USA.
S N OW , L. (2010) State of the State’s Wetlands Report: Ten Years of
Challenges and Progress. Http://dev.californiawetlands.net/static/
documents/Final_SOSW_Report_09232010.pdf [accessed 14
November 2013].
S O K A L , R. & R O H L F , J. (2012) Biometry. W.H. Freeman, New York,
USA.
S T E B B I N S , G. & M A J O R , J. (1965) Endemism and speciation in the
California flora. Ecological Monographs, 35, 1–35.
S T R O M B E R G , M., C O R B I N , J. & D’A N T O N I O , C. (eds) (2007) California
Grasslands: Ecology and Management. University of California
Press, Berkeley, USA.
T H O R N E , J., K E N N E DY , J., Q U I N N , J., M C C O Y , M., K E E L E R -W O L F , T.
& M E N K E , J. (2004) A vegetation map of Napa County using the
Manual of California Vegetation classification and its comparison to
other digital vegetation maps. Madroño, 51, 343–363.
T O Z E R , M. (2003) The native vegetation of the Cumberland Plain,
western Sydney: systematic classification and field identification of
communities. Cunninghamia, 8, 1–75.
V E E C H , J. (2000) Choice of species-area function affects identification
of hotspots. Conservation Biology, 14, 140–147.
V I E R S , J., T H O R N E , J. & Q U I N N , J. (2006) CalJep: a spatial distribution
database of Calflora and Jepson plant species. San Francisco Estuary
& Watershed Science, 4, 1–18.
W I S E R , S., P E E T , R. & W H I T E , P. (1998) Prediction of rare-plant
occurrence: a southern Appalachian example. Ecological
Applications, 8, 909–920.
W U , X. & S M E I N S , F.E. (2000) Multiple-scale habitat modeling
approach for rare plant conservation. Landscape and Urban
Planning, 51, 11–28.
Biographical sketches
B E N J A M I N J . C R A I N ’s primary research interests include biogeography, conservation biology, ecology of threatened species, and
population viability analyses. Much of his research involves the use of
geographical information systems and matrix models to analyse rare
species in biodiversity hotspots. A N A M A R Í A S Á N C H E Z - C U E R V O is a
conservation biologist whose research involves the use of geographical
information systems, spatially explicit models, spatial analysis and
multivariate statistics to understand patterns, causes and consequences
of global environmental change. J E F F R E Y W. W H I T E ’ s primary
research interests include plant biogeography, science education and
scientific film-making. S T E V E N J . S T E I N B E R G specializes in geographical information systems, data management systems, remote
sensing, spatial analysis, natural resources, and image processing. He
has researched the application of spatial analysis and web-based
systems for modelling and visualization of spatial data in both human
and natural environments.
© 2014 Fauna & Flora International, Oryx, 1–8
http://journals.cambridge.org
Downloaded: 20 Mar 2014
IP address: 166.4.81.227
�Conservation ecology of rare plants within complex local habitat
networks
BENJAMIN J. CRAIN, ANA MARÍA SÁNCHEZ-CUERVO, JEFFREY W. WHITE
and STEVEN J. STEINBERG
SUPPLEMENTARY TABLE 1 Rare plants in Napa County documented by the California Natural
Diversity Database (CNDDB, 2006; n = 55). According to the California Department of Fish
and Game and NatureServe’s element ranking system (CNDDB, 2013a,b), each of these
plants is considered to be at risk of extinction at the global or state level.
No.
1
2
3
4
5
6
7
8
9
10
11
12
13
14
15
16
17
18
19
20
21
22
23
24
25
26
27
28
29
30
31
32
33
34
Species
Amorpha californica var. napensis
Amsinckia lunaris
Arctostaphylos manzanita ssp. elegans
Astragalus claranus
Astragalus rattanii var. jepsonianus
Astragalus tener var. tener
Atriplex joaquinana
Balsamorhiza macrolepis var. macrolepis
Brodiaea leptandra
California macrophylla
Castilleja affinis ssp. neglecta
Castilleja rubicundula ssp. rubicundula
Ceanothus confusus
Ceanothus divergens
Ceanothus purpureus
Ceanothus sonomensis
Centromadia parryi ssp. parryi
Chloropyron molle ssp. molle
Cryptantha dissita
Downingia pusilla
Erigeron greenei
Eriogonum nervulosum
Fritillaria pluriflora
Harmonia hallii
Hesperolinon bicarpellatum
Hesperolinon breweri
Hesperolinon drymarioides
Hesperolinon serpentinum
Juglans hindsii
Lasthenia conjugens
Lathyrus jepsonii var. jepsonii
Layia septentrionalis
Legenere limosa
Leptosiphon jepsonii
Status
Imperilled
Imperilled
Imperilled
Critically imperilled
Vulnerable
Imperilled
Imperilled
Imperilled
Imperilled
Imperilled
Critically imperilled
Imperilled
Imperilled
Imperilled
Imperilled
Imperilled
Critically imperilled
Critically imperilled
Imperilled
Imperilled
Imperilled
Imperilled
Vulnerable
Imperilled
Imperilled
Imperilled
Imperilled
Imperilled
Critically imperilled
Critically imperilled
Imperilled
Imperilled
Imperilled
Imperilled
�35
36
37
38
39
40
41
42
43
44
45
46
47
48
49
50
51
52
53
54
55
Lilaeopsis masonii
Limnanthes vinculans
Lupinus sericatus
Monardella villosa ssp. globosa
Navarretia leucocephala ssp. bakeri
Navarretia leucocephala ssp. pauciflora
Navarretia rosulata
Penstemon newberryi var. sonomensis
Plagiobothrys strictus
Poa napensis
Polygonum marinense
Rhynchospora californica
Sidalcea hickmanii ssp. viridis
Sidalcea oregana ssp. hydrophila
Streptanthus brachiatus ssp. brachiatus
Streptanthus hesperidis
Streptanthus morrisonii
Symphyotrichum lentum
Trifolium amoenum
Trifolium hydrophilum
Viburnum ellipticum
Imperilled
Critically imperilled
Imperilled
Imperilled
Imperilled
Critically imperilled
Imperilled
Imperilled
Critically imperilled
Critically imperilled
Critically imperilled
Critically imperilled
Imperilled
Imperilled
Critically imperilled
Imperilled
Imperilled
Imperilled
Critically imperilled
Imperilled
Imperilled
�SUPPLEMENTARY TABLE 2 Habitat/land-use types documented in Napa County by Thorne et al. (2004) and the total area (km2) occupied by each
type. Associations between habitat types and rare plants are outlined in terms of the total number of rare plant taxa that occur within each habitat,
the proportion of each habitat occupied by rare plants, the total area (km2) and proportion of each habitat occupied by rare plant hotspots, and the
specificity-weighted richness index (SWRI) for each habitat. The numbers preceding each habitat type are used throughout the article, with
abbreviated habitat names, and for identification purposes in figures.
No.
Habitat type
Area
(km2)
No. of rare
spp. present
% area
occupied
by rare spp.
Area occupied by
hotspots (km2)
% area
occupied
by hotspots
SWRI
1
Agriculture*
260.95
2
Blue Oak Alliance
178.44
27
5.73
2.27
1.27
1.51
3
California Annual Grasslands Alliance
158.82
40
7.55
3.39
2.14
5.24
4
Chamise Alliance
124.90
27
7.75
1.90
1.52
1.92
5
Water*
116.61
6
Mixed Oak Alliance
116.41
30
14.31
2.32
1.99
1.97
7
109.16
21
9.51
2.84
2.60
1.25
8
Leather Oak–White Leaf Manzanita–Chamise Xeric
Serpentine NFD Super Alliance
Urban or Built-up*
9
Coast Live Oak–Blue Oak–(Foothill Pine) NFD Association
106.76
23
14.45
1.02
0.95
1.33
10
74.01
23
12.29
1.73
2.33
1.93
11
California Bay–Madrone– Coast Live Oak–(Black Oak BigLeaf Maple) NFD Super Alliance
Interior Live Oak–Blue Oak–(Foothill Pine) NFD Association
73.17
11
3.23
0.68
0.93
0.46
12
Douglas-fir Alliance
70.23
21
23.00
3.06
4.36
1.32
13
Coast Live Oak Alliance
53.34
25
9.12
0.43
0.82
2.06
14
Upland Annual Grasslands & Forbs Formation
49.16
33
21.31
2.10
4.28
3.72
15
Scrub Interior Live Oak–Scrub Oak–(California Bay–
Flowering Ash–Birch Leaf Mountain Mahogany–Toyon–
California Buckeye) Mesic East County NFD Super
Alliance
Douglas-fir–Ponderosa Pine Alliance
44.69
14
3.73
0.17
0.40
0.56
37.21
17
45.46
3.99
10.74
0.72
Mixed Manzanita–(Interior Live Oak–California Bay–
Chamise) West County NFD Alliance
White Leaf Manzanita–Leather Oak–(Chamise–Ceanothus
35.14
25
28.43
3.04
8.66
1.68
32.39
24
13.02
1.54
4.75
1.47
16
17
18
107.11
�spp. (Foothill Pine)) Xeric Serpentine NFD Super Alliance
19
29.04
22
17.89
1.42
4.89
1.29
20
California Bay- Leather Oak–(Rhamnus spp.) Mesic
Serpentine NFD Super Alliance
Chamise–Wedgeleaf Ceanothus Alliance
28.63
12
2.73
0.27
0.95
0.51
21
Knobcone Pine Alliance
23.92
20
31.47
1.70
7.14
1.18
22
Valley Oak–(California Bay–Coast Live Oak–Walnut–Ash)
Riparian Forest NFD Association
Interior Live Oak Alliance
23.15
26
15.36
0.63
2.76
2.04
21.43
9
3.65
0.22
1.07
0.33
17.79
22
9.71
0.14
0.82
1.28
25
Leather Oak–California Bay–Rhamnus spp. Mesic Serpentine
NFD Alliance
Saltgrass–Pickleweed NFD Super Alliance
14.45
9
33.24
1.29
8.92
1.78
26
Sclerophyllous Shrubland Formation
13.26
7
4.86
0.06
0.49
0.52
27
Valley Oak Alliance
11.72
20
7.79
0.09
0.81
1.08
28
Coast Redwood–Douglas-fir/California Bay NFD Association
11.65
15
26.35
0.36
3.09
0.69
29
Black Oak Alliance
10.39
16
25.46
1.36
13.17
0.92
30
McNab Cypress Alliance
9.64
13
9.33
0.26
2.74
0.83
31
Serpentine Grasslands NFD Super Alliance
8.56
19
12.13
0.19
2.29
1.08
32
Sargent Cypress Alliance
8.27
9
4.52
0.16
2.03
0.46
33
Foothill Pine Alliance
7.58
17
29.64
0.67
8.94
0.90
34
Vacant*
7.22
35
Rock Outcrop
6.84
20
18.43
0.22
3.26
1.13
36
Unknown
4.70
16
16.62
0.26
5.67
0.85
37
Oregon White Oak Alliance
4.58
12
13.33
0.14
3.13
0.57
38
3.91
15
25.22
0.23
5.98
0.88
3.80
6
5.35
0.02
0.72
0.26
40
White Alder (Mixed Willow–California Bay–Big-Leaf Maple)
Riparian Forest NFD Association
Foothill Pine/Mesic Non-serpentine Chaparral NFD
Association
Canyon Live Oak Alliance
2.67
14
38.78
0.38
14.33
0.91
41
Winter-Rain Sclerophyll Forests & Woodlands Formation
2.50
5
4.87
0.008
0.34
0.45
42
Mixed Willow Super Alliance
2.19
14
16.38
0.19
9.09
0.68
43
Valley Oak–Fremont Cottonwood–(Coast Live Oak) Riparian
Forest NFD Association
2.13
7
9.58
0.03
1.73
1.09
23
24
39
�44
1.94
0
45
Sparse California Juniper–Canyon Live Oak–California Bay–
California Buckeye/Steep Rock Outcrop NFD Alliance
Eucalyptus Alliance
1.65
9
46
Riverine, Lacustrine, and Tidal Mudflats
1.57
4
47
Coast Redwood Alliance
1.31
3
48
1.14
49
(Carex spp.–Juncus spp.–Wet Meadow Grasses) NFD Super
Alliance
(Bulrush–Cattail) Fresh Water Marsh NFD Super Alliance
50
0.00
0.00
0.00
6.90
0.03
2.24
1.08
26.83
0.001
0.11
0.25
14.62
0.00
0.00
0.14
14
30.38
0.04
3.79
1.07
1.09
11
18.23
0.02
2.67
2.24
Perennial Bunchgrass Restoration Sites
1.03
5
13.93
0.08
7.77
0.27
51
Tanbark Oak Alliance
0.99
8
34.62
0.24
24.75
0.29
52
Brewer’s Willow Alliance
0.96
11
23.63
0.08
8.35
0.47
53
Ponderosa Pine Alliance
0.68
7
47.97
0.19
28.03
0.26
54
Serpentine Barrens
0.20
3
32.46
0.05
27.41
0.21
55
Coyote Brush–California Sagebrush–(Lupine spp.) NFD
Super Alliance
Lotus scoparius Alliance (post-burn)
0.17
0
0.00
0.00
0.00
0.00
0.12
0
0.00
0.00
0.00
0.00
0.02
0
0.00
0.00
0.00
0.00
58
Sparse Bush Lupine/Annual Grasses/Rock Outcrop NFD
Alliance
Sugar Pine–Canyon Oak NFD Association
0.01
1
100.00
0.00
0.00
0.02
59
California Juniper Alliance
0.01
0
0.00
0.00
0.00
0.00
56
57
0.00
*Human-related land uses were excluded from the analysis.
References
CNDDB (CALIFORNIA NATURAL DIVERSITY DATABASE) (2006) RareFind v. 3.0.5. California Department of Fish and Game Biogeographic Data
Branch, Sacramento, USA.
CNDDB (CALIFORNIA NATURAL DIVERSITY DATABASE) (2013a) Special vascular plants, bryophytes and lichens list. California Department of
Fish and Wildlife, Sacramento, USA.
CNDDB (CALIFORNIA NATURAL DIVERSITY DATABASE) (2013b) State and federally listed endangered, threatened and rare plants of California.
California Department of Fish and Game, Sacramento, USA.
THORNE, J., KENNEDY, J., QUINN, J., MCCOY, M., KEELER-WOLF, T. & MENKE, J. (2004) A vegetation map of Napa County using the Manual
of California Vegetation classification and its comparison to other digital vegetation maps. Madroño, 51, 343–363.
View publication stats
�
 Benjamin J Crain