J. Nat. Hist. Mus. Vol. 26, 2012, 163-174
ASSESSMENT OF RESOURCES IN BAGHMARA COMMUNITY
FOREST OF CENTRAL LOWLAND NEPAL
B.K. Sharma1 and M.K. Chalise2
ABSTRACT
Initial assessment of cost and benefit aspect to the community managed forest for biodiversity
conservation was conducted in Baghmara Community Forest at central lowland Nepal. Wildlife
was being colonizing and forest was in early succession stage. The area was potential habitat
for large wildlife too. Cost-benefit analysis indicated more cost than benefit during the initial
stage. Eco-tourism was initiated after a few conservation management efforts in the area that
resulted the numbers of tourist influx which will be on profit in near future.
Key words: Baghmara, community forest, buffer zone
INTRODUCTION
Resource degradation has exceeded after the nationalization of private forest (1957) in Nepal
mostly due to the unstable government and lack of proper institution for conservation. Later
the conservation activities were institutionalized in the form of forest law (early 60's) and protected area law (early 70's) (Chalise 2010). The law enforcement in the protected areas and
involvement of local communities in conservation areas moved simultaneously that showed
the positive impact on resource conservation (Sharma 1999). The lowland (subtropical) region
is famous for economically valuable natural resources like Dipterocarp timber, one horned
Rhinoceros, Royal Bengal Tiger and so on. Similarly it consists of the riverine and subtropical
forests with flood plain, which are very rich in biodiversity.
In Chitwan, the first step to conserve bio-diversity was initiated with the establishment of rhino
sanctuary in 1956 followed by wildlife protection act in 1957. A special unit called rhino patrol
was created after a few years to protect rhino (NCRTC 1997). After conservation initiation (1989)
in Baghmara, a healthy forest area was created and some endangered flagship species like
Asian One Horned Rhinoceros were re-colonized. Then wildlife tourism was started in 1995.
Now, this forest is a part of the Buffer Zone of Chitwan National Park (CNP). Conservation
efforts have brought significant ecological and socio-economic changes. The changes need to
be quantified and assessed before the concept is expanded to the other areas. The institutional
engagement in the resource management and the involvement of local stakeholder in process
of conservation of the community forest has totally controlled grazing and illegal collection of
fuel wood, fodder and hunting. This study will try to analyze the ecological and socio-economic
situation during the early phase of its management.
STUDY AREA
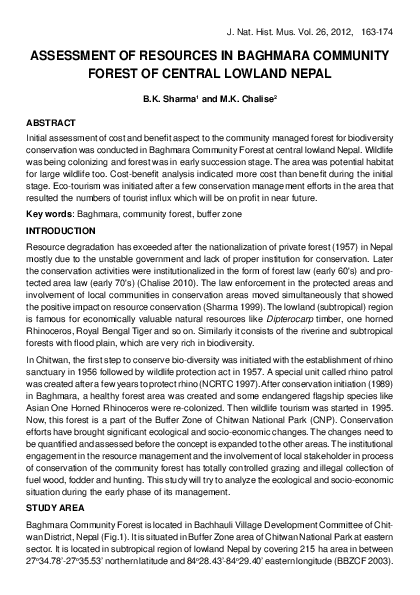
Baghmara Community Forest is located in Bachhauli Village Development Committee of Chitwan District, Nepal (Fig.1). It is situated in Buffer Zone area of Chitwan National Park at eastern
sector. It is located in subtropical region of lowland Nepal by covering 215 ha area in between
27o34.78’-27o35.53’ northern latitude and 84o28.43’-84o29.40’ eastern longitude (BBZCF 2003).
�164
J. Nat. Hist. Mus. Vol. 26, 2012
Figure 1. Location of the study area.
The climate of study area is sub-tropical monsoon type with relatively high humidity at an elevation of 200 to 250 meter above sea level. Monsoon rain prevails from late June to September
and amount of annual rainfall ranges from 14.04 mm to 602.2 mm (Tamrakar 2002). Heavy
flooding occurs during the monsoon. The average daily maximum temperature of the area in
hot summer days is about 36.8oC. Spring starts from March and is immediately followed by
summer and that ends in June (Pant 2003). The minimum temperature is about 7.8oC in cool
dry winter season which occurs from October to February (NCRTC 1997).
This community forest is located in the floodplain of Rapti river with majority of riverine forest species. Basically, the dominant species of the forest are Simal (Bombax ceiba), Bhellar
(Trewia nudiflora), and Padke (Albizia julibrissin). Other tree species available in the forest are
Mallotus phillippensis, Ehertia laevis, Premna integrifolia, Litsea monopetala, Acacia catechu,
Dalbergia sissoo and Cordia dichotoma. Similarly, there are some patches of grasslands in the
community forest and the major species in the grassland available are Ageratum conyzoides,
Peperoxia pellucida, Cyanodon dactylon, Imperata cylindrical, Saccharum spontaneum and
Themeda villosa. From the community forest 104 species of plants (including endangered
Butea monosperma and Roulfia serpentina) has been recorded (Pant 2003).
The Baghmara Community forest has provided an excellent habitat for the wildlife. It harbors
carnivores such as the tiger (Panthera tigris) as frequent visitor and leopard (Panthera pardus).
The other main wildlife available in the forest is rhino (Rhinoceros unicornis), spotted deer
(Axis axis), sambhar deer (Cervus unicolar), barking deer (Muntiacus muntjack), hog deer
(Axis porcinus), wild boar (Sus scrofa), mugger crocodile (Crocodylus palustris), and rhesus
monkey (Macaca mulatta)
The first users’ group of the Baghmara Community Forest was formed in 1989, which initially
included the local residence of Bachhauli Village Development Committee (VDC) ward number
2 and 3 as the member. Later residence ward number 3 and 4 of Bachhauli VDC were included in
as its users’ with 780 households as the members (49.68% male and 50.32% female) (Pant 2003).
�Sharma and Chalise : Assessment of Resources in .................165
MATERIALS AND METHODS
For wildlife monitoring was mainly focused on large and flagship species. In early 1995 two
permanent transects, covering the different habitats of the study area, were constructed to
monitor the wildlife of the area. Monitoring was conducted on monthly basis by using elephants.
Equipments for the monitoring mainly included binoculars, GPS and camera. Species, locality
and their number was recorded in the field form during the monitoring period.
Basic data to calculate phyto-sociological parameters of the different habitat types were collected
by random nested quadrate sampling. Quadrates of 1600m2, 25m2 and 1m2 were used to collect
data on tree, understory and ground vegetation respectively. From the biggest plot information
on trees bigger than 5 cm DBH were collected. DBH of trees was measured by using Vernier
Caliper (<100cm) at 1.3 m height. Height of trees was measured by using a range finder. Those
included scientific name, local name, DBH, basal area coverage per species. Information on
shrub layer was collected by preparing two 25m2 nested plots at opposite corners of the 1600m2
quadrate. From those quadrates information of the species which had woody stems smaller
than 5cm DBH and taller than knee height (40cm, except grasses) were collected. Collected
information included scientific name, local name, crown coverage and number of multiple stems
per species. Information on ground vegetation was collected from other four 1m2 nested plots
set at each corner of the 1600m2 quadrate. Information about ground floras, which included
grasses and forbs (lower than 5cm DBH) and below knee height (except grasses), were collected. Collected information consisted of scientific name, local name and crown coverage
per species. Linear measuring tapes, nylon strings and pegs (sticks) were utilized to mark the
boundaries of each quadrate. Aluminum frames of 1m2 were used to demarcate boundaries of
quadrates for ground vegetation. A site survey form was prepared for primary data collection.
Horizontal coverage of understory and ground vegetation was determined by eye estimation.
Name of each forest was determined by ordering the Importance Values of each tree species.
Importance Value was obtained by summation of the relative frequency, relative density, and
relative dominance (Krebs 1989). Relative dominance of trees was determined by calculating
the basal area. The coverage of ground flora was calculated by converting the recorded cover
percentage to midpoint cover classes according to Zobel et al. (1987) (cited in Sharma 1999a).
Prominence value of species was calculated by multiplying percent cover of that species
with square root of its frequency (Dinerstein 1979). All together the total number of sampling
quadrates was 84. The distribution of sampling quadrates was 12 for trees, 24 for understory
and 48 for ground vegetation.
Information regarding cost, benefit, location, history, physiography, climate and natural resource
of the study area were obtained from secondary sources. To gather information about the history of the study area knowledgeable persons were interviewed as key informants (Mikkelsen
1995). Plants and large wildlife available in the site were identified either by using local names
or from literature. Information about cost and the benefit from the community forest, from start
to 1995, was collected from secondary sources and knowledgeable persons. To calculate Net
Present Value of investment cost general 10% discount rate was utilized. Economic value of
the goods which are not sold in the local market, like fodder and grass, was calculated by using shadow price methods (Johnsen 1997).
�166
J. Nat. Hist. Mus. Vol. 26, 2012
RESULTS AND DISCUSSION
Habitat Types
The entire study area (215 ha) included three types of habitats namely forest (133 ha), grassland
(67 ha) and wetland (15 ha). The forest habitat included both plantation (26 ha) and natural
regeneration (107 ha) areas. Grassland incorporated grazing lands as well as scrublands and
wetland included oxbow lakes and rivers (BBZCF 2003).
From this study the plantation site included two types of forests, namely Khair-Padke (Acacia
catechu and Albizia julibrissin) and pure sissoo (Dalbergia sissoo) forest. In the former forest
the Importance value of Khair was found highest (105.9) followed by Padke (59.3) and Sissoo
(57.6) respectively. The number of tree per hector of forest land was 1416 and the average
height of the tree was 7.2 m. Our current study (2011) showed the number of tree per hector
was reduced to 209 individuals. Similarly, the understory layer mainly consists of Urtica dioca
(PV = 25) and Callicarpa macrophylla (PV = 6.1) respectively. Ground layer of vegetative cover
mainly included incorporated Diplazium esculentum (PV = 9.4) and Clerodendrum viscosum
(PV = 6.3) respectively (Appendix 1). In the Sissoo forest most important species was Sissoo
(IV = 256) and was followed by Bombax ceiba (IV = 15). The most prominent species in understory and ground layer of this forest were Urtica dioca (PV = 29.6) and Diplazium esculentum
(PV = 28.1) respectively (Appendix 2). In this forest average height of tree was 7.5 m and tree
density was 1759 per hector. From our current study (2011) the number of trees per hector
was drastically reduced to 210 individuals. In both of these forests tree diversity was not much
changed but was changed in understory vegetation.
The plantation was conducted as two phases, first in 1989 (16 ha) and second in1990 (10 ha),
in north western grazing lands of the area (NCRTC 1990). This area was fenced from barbed
wire and restricted for grazing. The main planted species were Sissoo, Khair, Bhellor, Simal
and Teak (Tectona grandis) (NCRTC 1992). From this study Padke, which was not planted
species, came as an important species in Khair forest. This succession appeared at the edge
of plantation in mostly from moist microclimate. It indicates that the vegetation was changed
according land suitability of the area.
The natural regeneration site included two types of vegetations namely Padke-Bhellor (Albizia
julibrissin and Trewia nudiflora) and Simal-Padke (Bombax ceiba- Albizia julibrissin) forest. In
the former forest the Importance Value of Padke was found highest (112.7) followed by Bhellor
(84.6) and Simal (23.8) respectively (Appendix 3). In this forest, number of trees per hector
was 273 and average height of tree was 8.2 m. The most prominent species at understory
layer was Caesalpinia decapetala (PV = 87.5) and ground vegetation was absent due to dense
canopy cover. In Simal-Padke forest most important species were Simal (IV = 124.2) and
Padke (IV = 99.3). In this forest average height of tree was 9.3 m and tree density was 78 per
hector. The most prominent species at understory and ground layer of this forest were Litsea
sp (PV = 32.5) and Dennstaedtia appendiculata (PV = 6.3) respectively (Appendix 4). From
our current study the number of trees per hector of both forests was increased. The diversity
of tree species was not much changed but was changed in shrub layer.
The natural regeneration area also protected by community and fencing was completed. Most
�Sharma and Chalise : Assessment of Resources in .................167
of these areas were inaccessible due to the presence of very dense thorny bush of Caesalpinia
decapetala. In these inaccessible areas elephants were used to do plot inventory. It was found
quite difficult to work in these areas due to thorny bushes, even from the backup of elephant
(NCRTC 1995). Understory layer of Simal-Padke forest consist a good fodder plant and also
used to eat by rhino (Jnawali 1995).
Types of Wildlife
Five species of large wild animals were reported from this forest during 1995. They included
wild boar (Sus scrofa), common leopard (Panthera pardus), rhinoceros (Rhinoceros unicornis),
marsh mugger (Crocodylus palustris) and sambhar deer (Cervus unicolor) (NCRTC 1995,
BCF 1995).
One resident marsh mugger was recorded from Budhi Rapti River situated at the western part
of the study area. The available food and less anthropogenic activities due to having deep
gorge in the river made it possible to have resident crocodile in the area. The availability of
marsh mugger indicated that it will be a favorable habitat for this wildlife. Considering the those
fact two more marsh mugger was planning to release in this area.
One resident sambhar deer was recorded from the forest of natural regeneration site (BCF
1995). Anthropogenic activities like grazing, collecting fodder and tree felling were quite common in this area. On average 846 livestock (cattle and buffaloes) were grazed daily and 1300
kg of fodder were collected daily from this area (BCC 2002). Disturbance of these activities
may be one cause of having only one resident sambhar in this area. But, its availability in such
disturbance indicated it also can be a potential habitat of sambhar deer.
One injured common leopard and one dead wild boar were reported from the study area
(BCF 1995). They may be either resident or migrated from nearby national park. It will be
difficult to predict resident leopard without having available food in these area. Even, mush
disturbances from the anthropogenic activities will also favor not having resident individual of
these two species.
The regular rhino monitoring was started only from November 1995. In total 3-4 rhino were
recorded per visit of the rhino monitoring. There was no record of having resident rhino in
this area before 1995. The area is one of a good refuge ground for wildlife during the flood
and forest fire (NCRTC 1995). In these months agricultural products like wheat and mustards
are in early stage of growing and easily available good food for wildlife. During these months
other food sources inside national park, like grass and forbs, will be at mature stage and not
so palatable to wildlife. So, most of the fringed wildlife used to depredate these agricultural
products, especially during night time. Sometimes they used to travel up to 8 km to depredate
crops in the agricultural land and returned to the nearby refuse during early morning (Jnawali
1999). So, that may be the cause of having frequent rhino encounter in the study area during
last two months of monitoring.
�168
J. Nat. Hist. Mus. Vol. 26, 2012
Table 1. Status of wildlife species in Baghmara community forest from1989-1995 and
2011.
SN
Name
1989 to 1995
2011
1.
Barking deer
--
12
2.
Hog deer
--
2
3.
Langur monkey
--
1
4.
Leopard
1
--
5.
Marsh Mugger
1
35
6.
Rhesus monkey
--
76
7.
Rhinoceros
3-4
3
8.
Sambhar deer
2
23
9.
Spotted deer
--
182
10.
Tiger
--
1
11.
Wild boar
1
5
It was found that the number of large wildlife species was 11. The number of these species was
also increased. That indicated the area became a good habitat for the different large wildlife.
Conservation Benefit
Though initiation for the community management of this area was started from 1987, the actual
implementation was started only in 1989 from first plantation (16 ha area). After plantation the
area was protected from barbed wire fence associated with rhino proof trenches from livestock
and wildlife respectively. In this first plantation 82,517 seedlings of Sissoo, Khair, Teak (Tectona
grandis), Bhellor (Trewia nudiflora), and Simal were used. As an early reward of conservation
community get NRs. 91,468 during late 1989 by selling thatch grasses. The half portion of this
reward was in kind for local community and that was thatch grass. The next plantation was
conducted in 10 hector during 1990 (NCRTC 1992). The planted seedlings were the same as
the previous year. After these plantations conservation in other areas of this community forest
was started only from late 1994. During that period 133 ha area was conserved as natural
regeneration site (NCRTC 1997).
Investment for plantation and conservation included the cost for fencing and plantation. That
mainly included procurement of poles, wires, seedlings, tools with their transportation and
labor cost. The investment was done from then Nepal Conservation Research and Training
Center (NCRTC) which is one consortium of then King Mahendra Trust for Nature Conservation
(KMTNC) with financial support from WWF US and Biodiversity Conservation Network (NCRTC
1995). Poles for fencing were provided from then Royal Chitwan National Park (NCRTC 1990).
Labor for plantation like ground clearing, hole-digging and seedling plantation was done from
�Sharma and Chalise : Assessment of Resources in .................169
local community (NCRTC 1996).
The other costs for conservation of this area included salary for staffs, cost for habitat improvement, and cost to develop tourism infrastructure Tab 2). The first two costs were covered from
their own income. The investment for the tourism infrastructure was also done by same institution from the financial support of same organizations (NCRTC 1997).
Table 2. Total cost (NRs.) of Baghmara community forest from 1989 to 1995/96.
Headings
Cost (NRs.)
Investment
6,664,414.47
Salary
158,567.00
Wetland rehabilitation
31,852.50
Machan (View tower) construction
250,000.00
Other cost
199,998.35
Total
7,304,832.32
Income source of this community included the forest resources like timber, fuel wood, and
grass. Beside these forest products the other main income source of the study area was
tourism revenue (Tab 3). The innovative idea of the tourism inside the community forest was
generated from local tourism entrepreneurs. Some of the entrepreneurs illegally used their
private elephant for wildlife tourism inside the community forest (BCF 1995). Location of this
forest nearby famous tourism destination of Nepal, called as Sauraha, will be an opportunity
to develop tourism in this forest. This potential indirectly forced the community forest users’
groups and other stakeholders to think and plan for potential eco-tourism products in this forest.
Difficulties to provide salary for forest guards due to lack of financial resources also enforce
all the stakeholders to generate revenue from the forest (BCF 1994). From the managed ecotourism there will be not much destruction inside forest, which is one of the positive aspects
of the tourism inside the community forest (Cochrane 1999). However, the common tendency
of private entrepreneurs is more benefit earning. So, without any mechanism to control the
overuse of resources there will be chances of more exploitation of forest resources from private
sector (Sharma 2003).
Table 3. Total benefit (NRs.) of Baghmara community forest from 1989 to 1995/96.
Source
Benefit
Forest product selling (timber & fuel-wood)
415,636.00
Tourism revenue (tourist & elephant entry)
487,965.00
Grass collection from local people
548,800.00
Thatch grass collection and selling
91,468.00
Income from other sources
37,462.24
Total
1,581,331.24
From the cost and benefit analysis, the cost was much more than the benefit. The analysis
�170
J. Nat. Hist. Mus. Vol. 26, 2012
was done for short period (6 years) when the investment was still ongoing. The tourism influx
in the area indicated that the study area will be on benefit side in near future.
From current study it was found that the income of this community forest was in increasing
trend. Highest income of this community forest was on fiscal year 2009/2010. In this fiscal year
the total income was NRs. 7,772,039.54 (Figure 2). The average income of this community
forest was approximately NRs. 38 lakhs per year.
Figure 2. Income status of Baghmara buffer zone community forest from
fiscal year 96/97 to 09/10.
Baghmara Community Forest incorporated mosaics of forest, wetlands and grassland habitats
suitable for large herbivores. Succession patterns of the forest tree specifically the Albizia julibrissin indicated the area will be converted to a good forest if it conserved from anthropogenic
pressure, especially for grazing and timber collection. The area is potential habitats for deer
species, monkeys and marsh mugger including endangered rhinoceros. It incorporated potential
eco-tourism products which can be a main financial source of this community managed forest.
ACKNOWLEDGEMENTS
Baghmara Community Forest for providing research permission, Nepal Conservation Research
and Training Centre for providing logistic support including assistants and elephant for monitoring. Local people acknowledged for providing required information of this study.
REFERENCES
Baghmara Buffer Zone Community Forest (BBZCF), 2003. Operational plan of Baghmara
buffer zone community forest 2003 to 2007. BBZCF, Chitwan, 50 p.
Biodiversity Conservation Centre (BCC), 2002. Assessment of human pressure inside Barand-
�Sharma and Chalise : Assessment of Resources in .................171
abhar corridor forest. KMTNC, BCC. 5 p.
Chalise, M.K., 2010. Kehi prakritik srot ra vartaman Nepal (Some Natural Resources and Current Nepal). Praagyik Sansar, Central Campus, TU,12(1):55-65 (in Nepali).
Cochrane, J.,1999. Communities and conservation in Nepals' Terai region: the socio-cultural
dynamics of a buffer zone eco-tourism programme in Royal Chitwan National Park. M. Phil.
Thesis Submitted to Cambridge University, UK.
Dinerstein, E.,1979. An ecological survey of the Royal Karnali-Bardia Wildlife Reserve, Nepal.
Part I: Vegetation modifying factors, and successional relationship. Biol. Conserv., 15:127-150.
Jnawali, S.R.,1995. Population ecology of Greater One-horned Rhinoceros (Rhinoceros unicornis) with particular emphasis on habitat preference, food ecology and ranging behavior of
a reintroduced population in Royal Bardia National Park in lowland Nepal. Ph. D. Dissertation,
Agricultural University of Norway.
Jnawali, S.R.,1999. Assessing rhino-people conflict in Nepal’s Royal Chitwan National Park.
Unicorn, 1(1):10-17.
Johnsen, F.H.,1997. Introduction to project appraisal. Noragric, Agricultural University of
Norway. 15 p.
Krebs, C.J.,1989. Ecological methodology. Harper Collins College Publishers, New York.
Mikkelsen, B.,1995. Methods for development work and research. Sage Publications, New
Delhi, India.
Nepal Conservation Research and Training Center,1990. Annual report. KMTNC, NCRTC.
Nepal Conservation Research and Training Center, 1992. Annual report. KMTNC, NCRTC.
Nepal Conservation Research and Training Center, 1995. Promoting local guardianship of
endangered species and wildlife habitat in Royal Chitwan National Park, Nepal. Progress
submitted to Biodiversity Conservation Network.
Nepal Conservation Research and Training Center,1997. Promoting local guardianship of
endangered species and wildlife habitat in Royal Chitwan National Park, Nepal. Final technical
report submitted to Biodiversity Conservation Network.
Pant, P., 2003. Fuel wood consumption pattern in low land Nepal: A case study in Bagamara
Buffer Zone Community Forest, Chitwan, Nepal. M Sc thesis submitted to Pokhara University.
Sharma, U.R.,1999. The concept of “Impact Zone” as applied in Royal Chitwan National Park.
Unicorn, 1(1): 5-9.
Sharma, B.K.,1999. Wildlife habitat mapping by using Geographic Information Systems (GIS)
in the Karnali floodplain of Royal Bardia National Park at lowland Nepal. M Sc Thesis Submitted to Agricultural University of Norway.
Sharma, B.K., 2003. Eco-tourism in community forest – an example from Baghmara community forest at lowland Nepal. A paper presented in Regional Ecotourism Conference, Gangtok,
Sikkim.
�172
J. Nat. Hist. Mus. Vol. 26, 2012
Tamrakar, A., 2002. Resource management in community forest : A case study from Baghmara
community forest of Bachhauli VDC, buffer zone of Royal Chitwan National Park. M Sc. Dissertation Submitted to Pokhara University.
Zobel, D.B., M..J. Behan, P.K. Jha and U.K.R. Yadav,1987. A practical manual for ecology.
Ratna Book Distributors, Kathmandu, Nepal.
Appendix 1. Importance value (IV) and prominence value (PV) of the
plant species in Khair-Padke forest.
Species
Layers
Acacia catechu
F
C
PV
RF
RD
RDo
IV
Tree
14.3
46.6
45.0
105.9
Albizia julibrissin
Tree
14.3
14.8
30.2
59.3
Dalbergia sissoo
Tree
14.3
27.4
15.9
57.6
Bombax ceiba
Tree
14.3
7.1
4.0
25.4
Trewia nudiflora
Tree
14.3
2.9
4.6
21.8
Litsea monopetala
Tree
7.1
0.4
0.1
7.6
Toona ciliate
Tree
7.1
0.4
0.1
7.6
Albizia sp.
Tree
7.1
0.2
0.1
7.4
Ehertia laevis
Tree
7.1
0.2
0.0
7.3
Urtica dioica
UL
1.0
25.0
25.0
Callicarpa macrophylla
UL
0.8
7.0
6.1
Colebrookea oppositifolia
UL
0.3
10.0
5.0
Murraya koenigii
UL
0.3
10.0
5.0
Diplazium esculentum
GV
0.6
12.5
9.4
Clerodendrum viscosum
GV
0.3
12.5
6.3
Ageratum conyzoides
GV
0.5
5.0
3.5
Pogostemon benghalensis
GV
0.4
2.5
1.7
Note: C = Percent cover; F = Frequency; RF = Relative Frequency, RD = Relative Density,
RDo Relative Dominance,
�Sharma and Chalise : Assessment of Resources in .................173
Appendix 2. Importance value (IV) and prominence value (PV) of th
plant species in Sissoo forest.
Species
Layers
Dalbergia sissoo
F
C
PV
RF
RD
RDo
IV
Tree
57.1
99.2
99.7
256.0
Bombax ceiba
Tree
14.3
0.6
0.1
15.0
Anthocephalus chinensis
Tree
14.3
0.1
0.1
14.5
Albizia julibrissin
Tree
14.3
0.1
0.0
14.4
Urtica dioica
UL
0.6
37.5
29.6
Colebrookea oppositifolia
UL
0.4
37.5
23.0
Callicarpa macrophylla
UL
0.4
12.5
7.7
Diplazium esculentum
GV
0.6
37.5
28.1
Ageratum conyzoides
GV
0.5
12.5
8.8
Hemarthria compressa
GV
0.4
12.5
8.3
Imperata cylindrica
GV
0.8
2.5
2.2
Eupatorium adenophorum
GV
0.4
2.5
1.5
Piper longum
GV
0.3
2.5
1.3
Note: C = Percent cover; F = Frequency; RF = Relative Frequency, RD = Relative Density,
RDo Relative Dominance,
Appendix 3. Importance value (IV) and prominence value (PV) of the
plant species in Padke-Vellor forest.
Species
Layers
Albizia julibrissin
F
C
PV
RF
RD
RDo
IV
Tree
21.5
46.6
44.7
112.7
Trewia nudiflora
Tree
21.5
37.2
26
84.6
Bombax ceiba
Tree
7.2
2
14.6
23.8
Dysoxylum binectariferum
Tree
10.7
4.1
2.5
17.2
Caesalpinia decapetala
Tree
10.7
3.3
1.2
15.1
Ehretia laevis
Tree
7.2
3.1
1.8
12
Bischofia javanica
Tree
3.6
1.2
2.6
7.3
Syzygium cumini
Tree
3.6
1.2
1.8
6.6
Toona ciliate
Tree
3.6
0.4
2.6
6.5
Mallotus philippensis
Tree
3.6
0.4
1.9
5.8
Bohori
Tree
3.6
0.4
0.7
4.6
Litsea monopetala
Tree
3.6
0.4
0.1
4
�174
J. Nat. Hist. Mus. Vol. 26, 2012
Caesalpinia decapetala
UL
1.0
87.5
87.5
Litsea sp.
UL
1.0
2.5
2.5
Colebrookea oppositifolia
UL
0.3
2.5
1.3
Ardisia solanaceae
UL
0.3
2.5
1.3
Note: C = Percent cover; F = Frequency; RF = Relative Frequency, RD = Relative Density,
RDo Relative Dominance
Appendix 4. Importance value (IV) and prominence value (PV) of the
plant species in Simal-Padke forest.
Species
Layers
Bombax ceiba
Tree
F
C
PV
RF
RD
RDo
IV
33.3
12.0
78.9
124.2
Albizia julibrissin
16.7
76.0
6.6
99.3
Cleistocalyx operculatus
16.7
4.0
14.1
34.8
Syzygium cumini
16.7
4.0
0.2
20.9
Litsea monopetala
16.7
4.0
0.1
20.8
Litsea sp.
UL
0.8
37.5
32.5
Ardisia solanaceae
UL
0.5
2.5
1.8
Colebrookea oppositifolia
UL
0.5
2.5
1.8
Callicarpa macrophylla
UL
0.5
2.5
1.8
Dennstaedtia appendiculata
GV
0.3
12.5
6.3
Diplazium esculentum
GV
0.1
12.5
4.4
Hemarthria compressa
GV
0.3
2.5
1.3
Achyranthus aspera
GV
0.1
2.5
0.9
Trifolium repens
GV
0.1
2.5
0.9
Note: C = Percent cover; F = Frequency; RF = Relative Frequency, RD = Relative Density,
RDo Relative Dominance,
AUTHORS’ ADDRESS
Bhuvan Keshar Sharma1
Ph D Scholar, Mizoram University, India
(email: bhuvan_keshars@hotmail.com)
Mukesh Kumar Chalise2
Central Department of Zoology, Tribhuvan University, Kirtipur, Kathmandu, Nepal
�
 Bhuvan Keshar Sharma