Synthesis of Nanocrystalline ZrO2 Powder by the Polyol Route
S. Vivekanandhan,1 M. Venkateswarlu,2 H. R. Rawls,3* N. Satyanarayana1*
1
Department of Physics, Pondicherry University, Pondicherry- 605 014, India
Research and Engineering center, Amara Raja Batteries Ltd, TIRUPATI – 517 520, India.
3.
University of Texas Health Science Center at San Antonio, Division of Biomaterials, Department of
Restorative Dentistry, 7703 Floyd Curl Drive, San Antonio, TX 78229, USA
2
Abstract
The polyol route, with zirconium
oxychloride as the metal ion source, was used to
synthesize nanocrystalline ZrO2 powder. The
complete process for the synthesis of
nanocrystalline ZrO2 was monitored by
TG/DTA, FTIR, XRD and TEM. Thermal
behavior of the intermediate powder was
investigated using TG/DTA analysis. The
structural coordination and phase of the
intermediate, as well as the synthesized ZrO2
powder, were investigated by FTIR and XRD
respectively. The microstructure of the
synthesized nanocrystalline ZrO2 powder was
identified
using
transmission
electron
microscopy.
Keywords: Nanocrystalline ZrO2 Powder;
Polyol synthesis; TG/DTA; FTIR; XRD; TEM
1. INTRODUCTION
Zirconium oxide has a wide range of
applications, including restorative dentistry,
catalysis, high temperature ceramics, etc., due to
its properties [1-4]. Recently, it was observed
that nanostructured ZrO2 powder exhibits
enhanced performance in many applications [5,
6]. A wide range of wet chemical routes such as
sol gel, polyol, combustion, hydrothermal, coprecipitation, etc., have been investigated for the
synthesis of nanocrystalline metal oxides,
including ZrO2 powders [7-12]. Among them,
ethylene glycol mediated polyol synthesis has
been used for the preparation of nanostructured
metal and metal oxides because of its strong
reducing power as well as high boiling point
(~197oC) [13]. In this process, ethylene glycol
also acts as a solvent for the precursor chemicals
due to its high relative permittivity (ε =32), and
leads to hydrolysis reactions under atmospheric
pressure [13]. Thus, the polyol route involves
hydrolysis and inorganic polymerization carried
out on the salts dissolved in a polyol medium. In
the present work, the polyol route was used for
the synthesis of nanocrystalline ZrO2 powder,
which was characterized by TG/DTA, FTIR,
XRD and TEM techniques.
2. EXPERIMENTAL TECHNIQUES
2.1. Polyol synthesis of nanocrystalline ZrO2
powder.
The required amount of zirconium
oxychloride (AR Grade, S.D-Fine, India) was
added to ethylene glycol (S.Q Grade, Qualigens,
India) under stirring condition by keeping the
total metal ion to ethylene glycol ratio at 1:40.
The resulting clear solution was heated at 175oC
for 2 h in an erlenmeyer flask. During heating,
the clear solution turned to a white, turbid
suspension, which may indicate the formation of
zirconia intermediates. After cooling to room
temperature, colloidally stable suspensions were
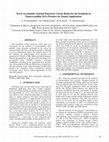
obtained. Photographs of the various stages of
the reaction mixture are shown in fig. 1. The
suspended particles were separated from
ethylene glycol by centrifugation at 3000 rpm.
Repeated washing was performed on the
particles using distilled water and dried in an
oven at 100oC for 12 h. The dried intermediate
was calcined at 600oC for 6 hours to obtain the
nanocrystalline ZrO2 powder.
Fig. 1. Photograph of the various stages in
the synthesis of nanocrystalline ZrO2
powder by a polyol route
NSTI-Nanotech 2009, www.nsti.org, ISBN 978-1-4398-1782-7 Vol. 1, 2009
125
2.2.
TG/DTA, FTIR, XRD and TEM
measurements on nanocrystalline
ZrO2 powder.
The thermal behavior of the polymeric
intermediates was investigated by simultaneous
TG/DTA
measurement
(Lybsys
thermal
analyzer, Setaram, France). Approximately, 3mg
of polymeric intermediate was heated at a rate of
10oC min-1 between 30 and 600oC. All thermal
studies were performed in flowing oxygen. The
FTIR spectra were recorded between 400 and
4,000 cm-1 with KBr dilution (Shimadzu FTIR 8000 spectrometer). Powder XRD patterns were
recorded by Cu Kα X-ray powder diffractometer
(X’ Pert PRO MPD, PANalytical, Philips). The
crystallite size of the ZrO2 powder was
calculated using Scherrer’s formula [14].
L=
50oC and 150oC with ~3% weight loss is due to
the removal of absorbed water. Further heating
of the intermediate particles caused the broad
exothermic peak between 200 and 350oC, which
is attributed to the decomposition of organic
derivatives (glycolates), and the respective ~2%
weight loss in the TGA curve. The exothermic
peak at approximately 455oC corresponds to
crystallization of the ZrO2 phase. There is no
significant weight loss observed beyond 500oC,
which indicates the complete decomposition of
organic derivatives and also the formation of a
ZrO2 phase, as confirmed by FTIR and XRD
analyses.
0.9#
" 12 cos ! B
where, λ is Wavelength of X-ray radiation used
(in Å), θB is the Bragg angle (in degrees) and β1/2
is full width at half maximum (FWHM) in
radians. β1/2 is calculated using the following
expression:
Fig. 3. TG/ DTA Thermogram
collected
suspension
intermediate)
of the
(ZrO2
3.2. FTIR
!1/ 2 = ( ! M2 " ! S2 )1/ 2
where, βM is full width at half maximum
(FWHM) value of the sample and βS is the
FWHM value of the Si standard. A NBS silicon
standard was used to estimate instrumental
broadening. The microstructure of the polymeric
intermediate was identified using transmission
electron microscopy (TEM), Jeol, Japan
3. RESULTS AND DISCUSSION
3. 1 TG/DTA analysis
A TG/DTA thermogram of the
intermediate particle product obtained from the
ethylene glycol mediated polyol process is
shown in fig. 3. From fig. 3, the observed broad
endothermic peak in the DTA curve between
126
Fig 4 shows the FTIR spectra of the asprepared as well as-calcined intermediate powder
(at 300oC and 600oC for 6 hours). From fig. 4,
the observed broad IR peak at 3377 cm-1 is due
to the presence of adsorbed water, which is not
observed in calcined samples [15]. The intense
IR peaks observed at 2939, 2867, 1093 and 909
cm-1 are attributed to the ethylene glycol based
organic derivatives [19]. Also, the observed low
intensity peaks at 1644 and 1432 cm-1 are
respectively due to the asymmetric and
symmetric vibrations of chelated carboxylate,
which may be due to the formation of a
minimum fraction of metal glycolate. All the IR
peaks, which are related to the organic
derivatives, begin to disappear at 300oC and are
completely removed from the intermediate after
being calcined at 600oC, which is consistent with
the TG/DTA results. The FTIR peaks at 747755 cm-1 and 498-502 cm-1 in the intermediate
products calcined at 300oC and 600oC are due to
the vibrational modes of ZrO32- groups, which
confirm the formation of the ZrO2 structure.
Further, its phase is confirmed by XRD analysis
[15-16].
NSTI-Nanotech 2009, www.nsti.org, ISBN 978-1-4398-1782-7 Vol. 1, 2009
t
m
m
Fig. 4. FTIR spectra of the as-separated as
well as suspensions calcined at 300oC
and 600oC for 6 hours
Fig. 5. XRD pattern of the as-separated as
well as suspensions calcined at 300oC
and 600oC for 6 hours
3.3. XRD
3. 4. TEM analysis
Fig. 5 shows the XRD patterns of the
as-prepared as well as the as-calcined
intermediates at 300oC and 600oC. The peaks for
the as-prepared as well as-calcined intermediate
at 300oC indicate the formation of a tetragonal (t)
ZrO2 phase only. However, the calcination of
polymeric intermediates at 600oC yields a
mixture of both metastable t-ZrO2 and
monoclinic (m)-ZrO2 phases. The XRD patterns
indicate that both crystalline phases were
independently formed during calcination, since
the small intense peak at ~32o 2Θ related to the
m-ZrO2 phase is observed in the XRD pattern of
the polymeric intermediate calcined at 300oC.
The diffraction patterns also show that increasing
calcining temperature leads to increasing ZrO2
crystallinity. FTIR and XRD analyses confirmed
the formation of organic-free ZrO2 powder with
t-ZrO2 and m-ZrO2 phases at 600oC for 6 hours.
The volume fraction and their respective
crystallite sizes were calculated using XRD data.
The volume fraction for the tetragonal phase and
the crystallite size were, respectively, found to be
41.95 % and 18 nm. Also, the calculated
crystalline size for the monoclinic phase was
found to be 21 nm.
Transmission electron micrographs of
the ZrO2 powder synthesized by the ethylene
glycol mediated polyol route and calcined at
600oC for 6 hours are shown in fig. 6 at various
magnifications. The micrographs show the
agglomeration of ZrO2 particles, which are about
25 nm in size. 25 nm is comparable with the
crystalline size calculated using XRD data.
Fig. 6. TEM micrographs of nanocrystalline
ZrO2 powder synthesized at 600oC.
(Magnification bars are 100 nm.)
NSTI-Nanotech 2009, www.nsti.org, ISBN 978-1-4398-1782-7 Vol. 1, 2009
127
4. Conclusions
Nanocrystalline ZrO2 powder can be
successfully synthesized by employing an
ethylene glycol mediated polyol process. From
TG/DTA, FTIR and XRD results, it was found
that organic-free nanocrystalline ZrO2 particles
can be formed at 600oC, that consist of both
tetragonal and monoclinic phases. Their volume
fraction was calculated using XRD data and
found to be 42 % for t-ZrO2 and 48 % for mZrO2. The average crystallite size of the
synthesized ZrO2 powder was calculated using
Scherer’s formula and found to be in range of
~18 nm for t-ZrO2 and ~21 nm for m-ZrO2. TEM
analysis shows that ~25 nm primary ZrO2
particles are formed, and agglomerate into larger
aggregate particles.
References
[1]
[2]
[3]
[4]
[5]
[6]
[7]
Keywords:
Nanocrystalline ZrO2 Powder; Polyol
synthesis; TG/DTA; FTIR; XRD; TEM
Acknowledgments:
NS gratefully acknowledges CSIR,
AICTE, DRDO, DST and UGC for
utilizing research facilities available
from the major research projects.
SV
acknowledges
the
CSIR,
Government of India, for the award of a
senior research fellowship (SRF).
HRR gratefully acknowledges support
by NIH/NIDCR grant 1P01 DE11688.
[8]
[9]
[10]
[11]
[12]
[13]
*Corresponding authors:
Prof. H. Ralph Rawls, E-mail:
rawls@uthscsa.edu, Phone: +1-210-5676871 and Prof. N. Satyanarayana, Email: nallanis2007@gmail.com, Phone:
+91-413-2654404
128
[14]
[15]
[16]
Srinivasan R, Hubbard CR, Cavin OB,
Davis BH. Chem Mater 1993;5:27
Angeles-Chavez C, Cortes-Jácome MA,
Torres-Garcia E, Toledo-Antonioa JA, J
Mater Res 2006; 21 No. 4: 807
Tan GL, Wu XJ, Thin Solid Films
1998;330:59
Valigi M, Gazzoli D, Ferrarisa G,
Bemporad E. Phys Chem Chem Phys
2003;5:4974
Benfe S, Kno¨zinger E. J Mater Chem
1999; 9:1203.
Wu Y, Bandyopadhyay A, Bose S. Mater
Sci Eng A 2004;380:349
Feng X, Hu M. Z, Encyclopedia of
Nanoscience and Nano technology,
Edited by H. S. Nalwa, American
Scientific Publishers 2004;1:687.
Bucella S, Riello P, Scremin BF, Calvelli
P, Polloni R, Speghini A, Bettinelli M,
Benedetti A, Opt Mater 2004;27:249
Angeles-Chavez C, Cortes-Jácome MA,
Torres-Garcia E, Toledo-Antonioa JA. J
Mater Res 2006;21No.4:807
Armenda´riz H, Cortes MA, Herna´ndez
I, Navarretea J, Va´zquez A. J Mater
Chem 2003;13:143
Zhang YW, Yan ZG, Liao FH, Liao CS,
Yan CH. Mater Res Bull 2004; 39:1763.
Lascalea GE, Lamas DG, Pe´rez L,
Cabanillas ED, Walso¨e de Rec NE.
Mater Lett 2004;58:2456
Jiang X, Wang Y, Herricks T, Xia Y, J
Mater Chem 2004;14:695
Gullity BD, Elements of X- ray
diffraction, Addison- Westely, MA, 1978.
Socrates G, Infrared and Raman
Characteristic Group Frequencies, John
Wiley and Sons: New York, 2001.
Sreekumaran Nair A, Tom RT, V.
Suryanarayanan, T. Pradeep. J Mater
Chem 2003;13:297
NSTI-Nanotech 2009, www.nsti.org, ISBN 978-1-4398-1782-7 Vol. 1, 2009
Synthesis of nanocrystallinc ZrO2 powder by the polyol route
2009
The polyol route, with zirconium oxychloride as the metal ion source, was used to synthesize nanocrystalline ZrO2 powder. The complete process for the synthesis of nanocrystalline ZrO2 was monitored by TG/DTA, FTIR, XRD and TEM. Thermal behavior of the intermediate powder was investigated using TG/DTA analysis. The structural coordination and phase of the intermediate, as well as the synthesized ZrO2 powder, were investigated by FTIR and XRD respectively. The microstructure of the synthesized nanocrystalline ZrO2 powder was identified using transmission electron microscopy....Read more