© 2009 The Chemical Society of Japan
Bull. Chem. Soc. Jpn. Vol. 82, No. 4, 453–457 (2009)
453
Determination of Binding Parameters and Mode
of Ferrocenyl ChalconeDNA Interaction
Afzal Shah, Rumana Qureshi,* Asad Muhammad Khan, Farzana Latif Ansari, and Safeer Ahmad
Department of Chemistry, Quaid-i-Azam University, 45320, Islamabad, Pakistan
Received September 12, 2008; E-mail: r_qureshy@yahoo.com
This paper reports that how the variation in peak current, absorbance, and viscosity of ferrocenyl chalcone (FC),
chemically named as 1-ferrocenyl-3-(4-nitrophenyl)-2-propen-1-one, in 10% aqueous DMF upon addition of DNA can be
used to probe the mode of interaction and binding parameters. Binding constant (K = 5.17 («0.25) © 103 M¹1), binding
site size (s = 1.08 « 0.05 bp) and diffusion coefficient of the free (Df = 5.22 © 10¹7 cm2 s¹1) and DNA bound drug
(Db = 4.39 © 10¹8 cm2 s¹1) were determined from voltammetric data. The binding constant (K = 4.91 («0.20) © 103
M¹1) was also obtained from UVvis absorption titration. Gibbs energy change (¦G = ¹RT ln K) of ¹21.18 kJ mol¹1 at
25 °C indicated the spontaneity of the binding interaction. The experimental results revealed intercalation of FC into DNA
as the dominant mode of interaction. Furthermore, the radii of the free and DNA-bound drug were determined from
viscosity measurements.
Ferrocene-based derivatives have drawn utmost attention in
various fields of analytical chemistry due to their varied and
well-established redox chemistry. These are widely used for
medical purposes,13 electrocatalysis,4 and in the design of new
signaling ion sensors.5,6 The sensitivity of the ferrocenyl
groups to covalent or non covalent binding with other
molecules and their unique property of retaining simple one
electron redox behavior after the introduction of substituents
are routinely exploited for the determination of electrochemical
parameters.79
Chalcones (¡,¢-unsaturated ketones) are promising candidates in the new era of medicines on account of their wide
spectrum of antitumor, antibacterial, and anti-inflammatory
activities.1013 The applications of these compounds in chemotherapy due to their direct interaction with DNA has been
reported by previous investigators.11,12 Their derivatization
with ferrocene can enhance their detection by electrochemical
methods like cyclic voltammetry (CV), differential pulse
voltammetry, and square wave voltammetry. Like an effective
chemical sensor, ferrocenyl chalcone has two basic parts: the
signaling unit and the binding unit. The interaction of the
binding unit with other molecules will be monitored by the
tunable redox behavior of the signaling ferrocene moiety. As
the study of the electrochemical sensing properties of ferrocenyl chalcones is limited, a ferrocenyl chalcone (FC) was
obtained and investigated. Its binding with DNA was monitored by the redox active ferrocenyl group, acting as an
intramolecular oxidation antenna.14
Drug-DNA interactions have been studied by a variety of
techniques such as viscometry, UVvis spectroscopy, isothermal calorimetry, luminescence, fluorescence, and electroanalytical methods.1518 For an active redox species like FC,
electrochemical methods could be used to complement the
previously used methods of investigation.1519 In the present
work, the interaction of FC (Scheme 1) with chicken blood
O
Fe
NO2
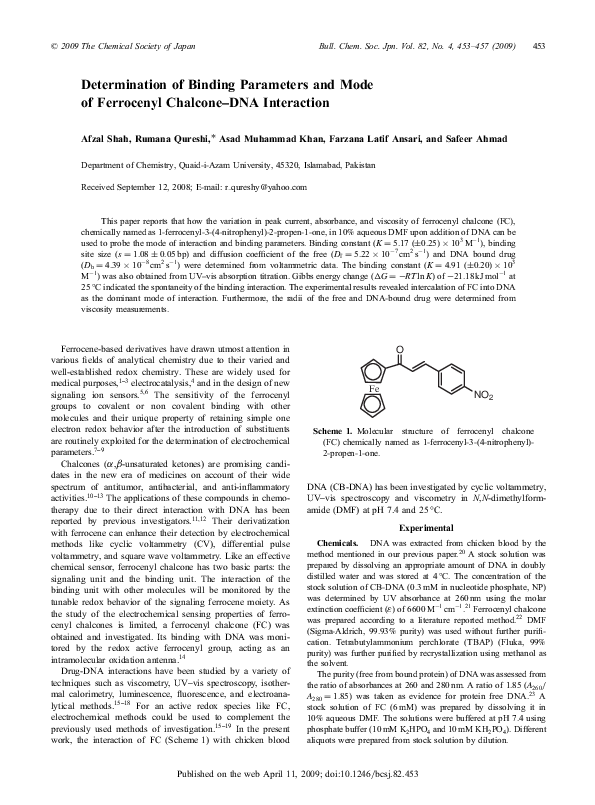
Scheme 1. Molecular structure of ferrocenyl chalcone
(FC) chemically named as 1-ferrocenyl-3-(4-nitrophenyl)2-propen-1-one.
DNA (CB-DNA) has been investigated by cyclic voltammetry,
UVvis spectroscopy and viscometry in N,N-dimethylformamide (DMF) at pH 7.4 and 25 °C.
Experimental
Chemicals. DNA was extracted from chicken blood by the
method mentioned in our previous paper.20 A stock solution was
prepared by dissolving an appropriate amount of DNA in doubly
distilled water and was stored at 4 °C. The concentration of the
stock solution of CB-DNA (0.3 mM in nucleotide phosphate, NP)
was determined by UV absorbance at 260 nm using the molar
extinction coefficient (¾) of 6600 M¹1 cm¹1.21 Ferrocenyl chalcone
was prepared according to a literature reported method.22 DMF
(Sigma-Aldrich, 99.93% purity) was used without further purification. Tetrabutylammonium perchlorate (TBAP) (Fluka, 99%
purity) was further purified by recrystallization using methanol as
the solvent.
The purity (free from bound protein) of DNA was assessed from
the ratio of absorbances at 260 and 280 nm. A ratio of 1.85 (A260/
A280 = 1.85) was taken as evidence for protein free DNA.23 A
stock solution of FC (6 mM) was prepared by dissolving it in
10% aqueous DMF. The solutions were buffered at pH 7.4 using
phosphate buffer (10 mM K2HPO4 and 10 mM KH2PO4). Different
aliquots were prepared from stock solution by dilution.
Published on the web April 11, 2009; doi:10.1246/bcsj.82.453
�Bull. Chem. Soc. Jpn. Vol. 82, No. 4 (2009)
-20
-15
a
b
-10
I /µA
Apparatus. Voltammetric experiments were performed using
PGSTAT 302 with Autolab GPES version 4.9 Eco Chemie,
Utrecht, the Netherlands. Measurements were carried out in a
conventional three electrode cell with Ag/AgCl as reference
electrode, a thin Pt wire as counter electrode and a bare glassy
carbon electrode (GCE) with a geometric area of 0.071 cm2 as the
working electrode. Prior to experiments, the GCE was polished
with 0.25-µm diamond paste on a nylon buffing pad, followed by
washing with water. For electrochemical measurements the test
solution was kept in an electrochemical cell (model K64 PARC)
connected to a circulating thermostat LAUDA model K-4R.
Absorption spectra were measured on a UVvis Spectrometer;
Shimadzu 1601 by keeping constant the concentration of the drug
while varying the concentration of DNA. The viscosity measurements were carried out with an Anton Paar Stabinger Viscometer
SVM 3000.
Procedures. Voltammetric Studies: For CV experiments
both the concentration and volume of FC were kept constant while
varying the concentration of DNA in solution. The voltammograms were recorded as aliquots of known quantity of DNA were
added. The solutions were deoxygenated via purging with argon
gas for 10 min before every experiment and were maintained under
argon atmosphere throughout the measurements. All experiments
were carried out at 25 °C and blood pH (7.4). Prior to every
electrochemical assay the GCE was polished for carrying out the
electrochemical process on a clean electrode surface.
Spectroscopic Studies: Absorption spectra were measured by
adding a small aliquot of DNA solution to a constant concentration
of the drug solution. Solutions were allowed to equilibrate for
5 min before experimental assay.
Viscometric Measurements:
For viscosity measurements,
titrations were performed by the addition of aliquots of the drug
solution into a constant concentration of DNA solution in the
viscometer. Data are presented as (©/©o) versus the concentration
of DNA, where © is the viscosity of the drug in the presence of
DNA and ©o is the viscosity of the drug alone.
Interaction Ferrocenyl Chalcone with DNA
-5
0
5
10
-0.5
-0.8
-1.4
-1.7
Figure 1. Cyclic voltammograms of 3 mM FC in 10%
aqueous DMF with 0.1 M TBAP as supporting electrolyte
in the absence (a) and presence of 200 µM DNA (b) at
100 mV s¹1 scan rate in 0.25 M phosphate buffer at pH 7.4
and 25 °C. Glassy carbon electrode (0.071 cm2) was used
as working electrode and all potentials are reported vs. Ag/
AgCl.
40
35
30
25
20
15
10
5
0
0
0.1
0.2
Results and Discussion
Voltammetric Studies of the Interaction of FC with DNA.
The cyclic voltammetric behavior of 3 mM FC in the absence
and presence of 200 µM DNA at bare GCE is shown in
Figure 1. The voltammogram without DNA (Figure 1a) featured a couple of well-defined and stable redox peaks in
the potential range of ¹0.6 to ¹1.6 V. The voltammogram
registered an anodic peak at ¹1.036 V and a cathodic peak at
¹1.173 V versus Ag/AgCl. By the addition of 200 µM DNA
(Figure 1b) both the cathodic and anodic peak potentials
shifted by 93 and 97 mV in the positive direction. These
positive shifts in peak potentials are indicative of an intercalative mode of binding.24 Furthermore, a 25% decrease in
cathodic and 19.35% decrease in anodic peak current was
observed. The greater decrease of Ipc as compared to Ipa is
attributed to the intercalation of FC into the double-stranded
DNA, referring to appropriate references.25,26 The rationale
behind the diminution in peak currents is the decrease in free
drug concentration due to the formation of macromolecular
FCDNA complex with a smaller diffusion coefficient.27,28 The
values of the diffusion coefficient (Df = 5.22 © 10¹7 cm2 s¹1)
of the free and DNA bound drug (Db = 4.39 © 10¹8 cm2 s¹1)
were determined by the Randles Sevcik expression:29,30
-1.1
E / V vs. Ag/AgCl
I / µA
454
0.3
1/2
0.4
υ / (V/s)
0.5
0.6
0.7
1/2
1/2
Figure 2. I vs. v plots of 5 mM FC in the absence of
DNA ( ) and presence of 20 µM DNA ( ) at 20 (a),
50 (b), 100 (c), 200 (d), and 500 mV s¹1 (e) in 0.25 M
phosphate buffer (pH 7.4) at 25 °C.
I ¼ 2:69 � 105 n3=2 ACD1=2 v1=2
ð1Þ
where I is the peak current (A), A is the surface area of the
electrode (cm2), C is the bulk concentration (mol cm¹3) of the
electroactive species, D is the diffusion coefficient (cm2 s¹1), v
is the scan rate (V s¹1), and n is the number of electrons gained
or lost by the electroactive species.
The linear dependence of Ip on v1/2 (Figure 2) indicates that
the redox process of FC in the absence and presence of DNA is
diffusion controlled.31
It can be seen that the diffusion coefficient of DNA bound
drug is an order of magnitude lower than that of the free drug.
Similar results have also been obtained by other investigators.15,3234 The smaller slope of FC in the presence of DNA
could be attributed to its intercalation into DNA resulting in the
formation of slowly diffusing supramolecular complex in
solution.35
�A. Shah et al.
-18
0.6
-14
0.5
a
g
y = 0.0024x
R2 = 0.9959
0.4
Cb / C f
I / µA
-10
-6
455
Bull. Chem. Soc. Jpn. Vol. 82, No. 4 (2009)
0.3
0.2
-2
0.1
2
0
6
-0.5
-0.8
-1.1
-1.4
0
-1.7
50
150
200
[DNA] / µM
E / V vs. Ag/AgCl
Figure 3. Cyclic voltammograms of 3 mM FC in the
absence of DNA (a) and presence of 20 (b), 40 (c),
60 (d), 80 (e), 100 (f), and 200 µM DNA (g).
Figure 5. Cb/Cf vs. [DNA] for the determination of binding
site size. 5% error is estimated in all the values at y axis.
0.8
145
a
y = 193.3x - 4.6959
R2 = 0.9885
0.6
Absorbance
120
2
2
I p / pA
100
95
70
45
e
0.4
0.2
20
0.3
0.4
0.5
0.6
0.7
275
2
2
(I po2 - Ip ) / [DNA] / µA
Ip
2
Ip Þ þ Ipo
2
½DNA
ð2Þ
where, Ipo and Ip are the peak currents of FC in the absence
and presence of DNA, respectively. By plotting Ip2 vs.
(Ipo2 ¹ Ip2)/[DNA] a straight line with a binding constant of
5.17 («0.25) © 103 M¹1 was obtained (Figure 4).
For the determination of binding site size the following
simple binding model was used:37
Cb =Cf ¼ Kf½free base pairs=sg
ð3Þ
where s is the binding site size in terms of base pairs.
Measuring the concentration of DNA in terms of [NP], the
concentration of base pairs can be expressed as [DNA]/2. So
eq 3 can be written as:
Cb =Cf ¼ Kf½DNA=2sg
375
425
475
Figure 6. UVvis absorption spectra of 50 µM FC in the
absence of DNA (a), in the presence of 40 (b), 60 (c),
80 (d), and 100 µM DNA (e) at pH 7.4 and 25 °C.
Based on variations in cathodic peak current of FC caused
by the addition of increasing concentration of DNA (Figure 3),
the binding constant K, was calculated according to the
equation:36
1
ðIpo 2
¼
K½DNA
325
Wavelength/nm
Figure 4. Plot of Ip2 vs. (Ipo2 ¹ Ip2)/[DNA] for 3 mM FC
with varying concentration of DNA ranging from 20 to
200 µM in a medium buffered at pH 7.4, used to calculate
the binding constant of FCDNA adduct.
2
0
ð4Þ
Cf and Cb denote the concentrations of free and DNA-bound
species respectively.
The Cb/Cf ratio was determined by the equation given
below:38
Cb =Cf ¼ ðI
IDNA Þ=IDNA
ð5Þ
where IDNA and I represent the peak current of the drug with
and without DNA.
Putting the value of K = 5.17 («0.25) © 103 M¹1 as calculated according to eq 2, the binding site size of 1.08 « 0.05
was obtained from the plot (Figure 5) of Cb/Cf vs. [DNA]. The
value of s shows that the drug occupies more than one base pair
when intercalated into DNA.39
Absorption Studies. The interaction of FC with solution
phase CB-DNA, was also characterized by UVvis absorption
titration by keeping the concentration of the drug constant
(50 µM) while varying the concentration of DNA from 20 to
200 µM. As shown in Figure 6, the absorption band of FC with
the maximum wavelength at 321 nm, resulted in hypochromism
(45%), broadening of the envelope and slight red shift of 3 nm
by the incremental addition of DNA. The large hypochromism,
characteristic of intercalation40 (in binding mode) is attrib-
�Bull. Chem. Soc. Jpn. Vol. 82, No. 4 (2009)
Interaction Ferrocenyl Chalcone with DNA
uted to the interaction between the electronic states of the
intercalative chromophore of FC and that of the DNA bases.
However, the lack of pronounced red shift is suggestive of
partial intercalation as classical intercalation exhibits appreciable shift in wavelength (red shift ² 15 nm).41 The reason for
partial intercalation could be the stereochemical effect of the
non-planar ferrocenyl group, which will prevent the whole
molecule from intercalating into DNA. The weak bathochromic
effect is further correlated to out binding mode,42 in which the
non-intercalating ferrocenyl group of FC is considered more
suitable for fitting into the grooves of DNA. The broadening of
the envelope can be assigned to the changes in the electronic
distribution of FC upon binding to the DNA bases. The nonuniform variation in absorbance can presumably be due to a
couple of factors like conformational changes in the structure
of either FC and/or nucleic acid upon binding and complex
complex interactions.
The origin of bathochromic and hypochromic effects might
lie in the mechanism of interaction of FC with DNA. The
introduction of the planar 4-nitrophenyl-2-propen-1-one of FC
in DNA is likely to decrease the ³ ¼ ³* transition due to the
coupling of the lowest unoccupied ³*-orbital of the drug
molecule with the highest occupied ³-orbital of the DNA base
pairs. Consequently the partial filling of the empty ³*-orbital
by the electrons, the transition probability is expected to be
reduced which will lead to hypochromism. The suggested
mixed binding mode (intercalation and groove binding) will
unwind the DNA helix at the interaction sites which will lead to
perturbation in its normal functioning that may culminate in
cellular death.
Assuming the two state binding of FC with DNA (“free” and
“DNA bound”), the binding constant was calculated from the
decay of absorbance according to the following equation:4345
A0
¾G
¾G
1
¼
þ
¢
A A0
¾HG ¾G ¾HG ¾G K½DNA
ð6Þ
where K is the binding constant, A and A0 represent the
absorbance of the drug with and without DNA, ¾HG and ¾G are
the coefficients FcDNA adduct and free Fc.
The binding constant K (4.91 («0.20) © 103 M¹1) was
obtained from the intercept to slope ratio of A0/(A ¹ A0) vs.
1/[DNA]. However, it is an order of magnitude greater than the
binding constant (3.45 © 102 M¹1) of protonated ferrocene
with DNA,46 due to the presence of planar 4-nitrophenyl-2propen-1-one, which can effectively intercalate into DNA.
However, the value of K is moderate as compared to the high
value of K (6.15 © 105), reported for the interaction of 1(4¤-aminophenyl)-3-(4¤¤-N,N-dimethylaminophenyl)-2-propen1-one with DNA20 due to the sandwich-like ferrocenyl group
which prevents the whole molecule from intercalating. The
interaction of FC with DNA will stop the proliferation of
cancerous cell by damaging the DNA transcription machinery.
The value of the binding constant, determined here is
comparable to the K = 5.17 («0.25) © 103 M¹1 obtained from
CV measurements.
Viscosity Measurements. To support the results obtained
from CV and UVvis absorption titrations concerning the mode
of binding viscometric titrations were performed by the
addition of increasing concentration of DNA (ranging from
3
2.6
η / ηο
456
2.2
1.8
1.4
1
0
50
100
150
200
250
[DNA] / µM
Figure 7. Plot of relative viscosity (©/©o) vs. concentration
of DNA in 0.25 M phosphate buffer (pH 7.4) at 25 °C.
20 to 200 µM) into 50 µM constant concentration of the drug
buffered at pH 7.4. Data were presented as ©/©o vs. the
concentration of DNA, where © is the viscosity of the drug
in the presence of DNA and ©o is the viscosity of the drug
alone.
A plot of (©/©o) against the concentration of DNA is shown
in Figure 7. The relative viscosity increases with the increase in
concentration of DNA. In general, a classical intercalation
mode causes an increase in the viscosity of DNA solution due
to the increased separation of base pairs at the intercalation
sites, and hence an increase in the overall DNA length.47 This
behavior suggests that FC binds with DNA via an intercalative
mode of binding.
The radii of free FC (r = 4.7 nm) and its adduct with DNA
(r = 19.5 nm) were calculated using the following rearranged
form of the StokesEinstein equation:
r ¼ kB T =6³©D
ð7Þ
The result shows that the radius of the FCDNA complex is
greater than the free drug. The increase in radius may be linked
with the rupture of DNA strands, which will lead to cell
apoptosis.
Conclusion
The results demonstrate that electrochemical methods can be
successfully employed to evaluate the mode of interaction and
binding parameters like binding constant, Gibbs energy of
adduct formation and binding site size.
In general, FC shows electrochemically, spectroscopically
and viscometrically measurable interactions with DNA at blood
pH and ambient temperature of 25 °C. Its CV, UVvis,
and viscometric results reveal intercalation as the dominant
mode of interaction. The binding constant with values of
5.17 («0.25) © 103 and 4.91 («0.20) © 103 M¹1 was obtained
from CV and UVvis spectroscopic techniques. The Gibbs
energy change (¦G = ¹RT ln K) of ¹21.18 kJ mol¹1 at 25 °C
indicates the spontaneity of the binding interaction.
These investigations reliably unfold the binding mode and
interaction strength as required for the design of effectively
specific anticancer drugs.
We are highly grateful to Higher Education Commission
Islamabad, Pakistan for supporting this work.
�A. Shah et al.
References
1 E. W. Neuse, J. Inorg. Organomet. Polym. 2005, 15, 3.
2 N. Metzler-Nolte, Nachr. Chem. 2006, 54, 966.
3 M. J. Clarke, F. Zhu, D. R. Frasca, Chem. Rev. 1999, 99,
2511.
4 S. C. Barton, H.-H. Kim, G. Binyamin, Y. Zhang, A. Heller,
J. Phys. Chem. B 2001, 105, 11917.
5 F. Otón, A. Tárraga, M. D. Velasco, A. Espinosa, P. Molina,
Chem. Commun. 2004, 1658.
6 D. Jimenez, R. Martinez-Manez, F. Sancenon, J. V.
Ros-Lis, J. Soto, A. Benito, E. Garcia-Breijo, Eur. J. Inorg. Chem.
2005, 2393.
7 M. Ciszkowska, Z. Stojek, Anal. Chem. 2000, 72, 754A.
8 P. Hudeczek, F. H. Kohler, P. Bergerat, O. Kahn, Chem.®
Eur. J. 1999, 5, 70.
9 C. B. Hollandsworth, W. G. Hollis, Jr., C. Slebodnick, P. A.
Deck, Organometallics 1999, 18, 3610.
10 T. Sasayama, K. Tanaka, K. Mizukawa, A. Kawamura, T.
Kondoh, K. Hosoda, E. Kohmura, J. Neurooncol. 2007, 85, 123.
11 C.-L. Ye, J.-W. Liu, D.-Z. Wei, Y.-H. Lu, F. Qian, Pharm.
Res. 2004, 50, 505.
12 C.-L. Ye, J.-W. Liu, D.-Z. Wei, Y.-H. Lu, F. Qian, Cancer
Chemother. Pharmacol. 2005, 55, 447.
13 Y. S. Lee, S. S. Lim, K. H. Shin, Y. S. Kim, K. Ohuchi,
S. H. Jung, Biol. Pharm. Bull. 2006, 29, 1028.
14 E. Hillard, A. Vessières, L. Thouin, G. Jaouen, C. Amatore,
Angew. Chem., Int. Ed. 2006, 45, 285.
15 M. T. Carter, M. Rodriguez, A. J. Bard, J. Am. Chem. Soc.
1989, 111, 8901.
16 E. Palecek, Talanta 2002, 56, 809.
17 A. Erdem, M. Ozsoz, Turk. J. Chem. 2001, 25, 469.
18 M. Aslanoglu, C. J. Isaac, A. Houlton, B. R. Horrocks,
Analyst 2000, 125, 1791.
19 S. A. Özkan, Y. Özkan, Z. Şentürk, J. Pharm. Biomed.
Anal. 1998, 17, 299.
20 A. Shah, A. M. Khan, R. Qureshi, F. L. Ansari, M. F. Nazar,
S. S. Shah, Int. J. Mol. Sci. 2008, 9, 1424.
21 M. E. Reichmann, S. A. Rice, C. A. Thomas, P. Doty,
J. Am. Chem. Soc. 1954, 76, 3047.
22 X. Wu, E. R. Tiekink, I. Kostetski, N. Kocherginsky, A. L.
Tan, S. B. Khoo, P. Wilairat, M. L. Go, Eur. J. Pharm. Sci. 2006,
27, 175.
Bull. Chem. Soc. Jpn. Vol. 82, No. 4 (2009)
457
23 J. Marmur, J. Mol. Biol. 1961, 3, 208.
24 X. Lu, M. Zhang, J. Kang, X. Wang, L. Zhuo, H. Liu,
J. Inorg. Biochem. 2004, 98, 582.
25 D.-W. Pang, H. D. Abruna, Anal. Chem. 1998, 70, 3162.
26 J. Labuda, M. Bučková, M. Vaníčková, J. Mattusch, R.
Wennrich, Electroanalysis 1999, 11, 101.
27 T. W. Welch, H. H. Thorp, J. Phys. Chem. 1996, 100,
13829.
28 F. Wang, Y. Xu, J. Zhao, S. Hu, Bioelectrochemistry 2007,
70, 356.
29 J. E. B. Randles, Trans. Faraday Soc. 1948, 44, 327.
30 A. Sevcik, Collect. Czech. Chem. Commun. 1948, 13, 349.
31 M. T. Carter, A. J. Bard, J. Am. Chem. Soc. 1987, 109,
7528.
32 S. Chanfreau, P. Cognet, S. Camy, J. S. Condoret, J.
Electroanal. Chem. 2007, 604, 33.
33 J. Swiatek, J. Coord. Chem. 1994, 33, 191.
34 I. S. Shehatta, M. S. Ibrahim, Can. J. Chem. 2001, 79,
1431.
35 S. Wang, T. Peng, C. Yang, Biophys. Chem. 2003, 104, 239.
36 J. Niu, G. Cheng, S. Dong, Electrochim. Acta 1994, 39,
2455.
37 M. T. Carter, M. Rodriguez, A. J. Bard, J. Am. Chem. Soc.
1989, 111, 8901.
38 M. Aslanoglu, C. J. Isaac, A. Houlton, B. R. Horrocks,
Analyst 2000, 125, 1791.
39 A. J. Bard, L. R. Faulkner, Electrochemical Methods
Fundamentals and Applications, John Wiley & Sons, Inc., NY,
USA, 1986, p. 256.
40 M. Kožurková, D. Sabolová, L. Janovec, J. Mikeš, J.
Koval’, J. Ungvarský, M. Štefanišinová, P. Fedoročko, P. Kristian,
J. Imrich, Bioorg. Med. Chem. 2008, 16, 3976.
41 R. F. Pasternack, E. J. Gibbs, J. J. Villafranca, Biochemistry
1983, 22, 2406.
42 J. Kang, H. Wu, X. Lu, Y. Wang, L. Zhou, Spectrochim.
Acta, Part A 2005, 61, 2041.
43 X.-J. Dang, R. Tong, H.-L. Li, J. Inclusion Phenom. 1996,
24, 275.
44 M. Y. Nie, Y. Wang, H. L. Li, Pol. J. Chem. 1997, 71, 816.
45 J. B. Lepecq, C. Paoletti, J. Mol. Biol. 1967, 27, 87.
46 A. Shah, R. Qureshi, N. K. Janjua, S. Haque, S. Ahmad,
J. Anal. Sci., 2008, 24, 1437.
47 J. M. Veal, R. L. Rill, Biochemistry 1991, 30, 1132.
�
 Safeer Ahmad