Environ. Sci. Technol. 1999, 33, 2771-2781
Field-Scale Evaluation of in Situ
Bioaugmentation for Remediation of
Chlorinated Solvents in Groundwater
R O B E R T J. S T E F F AN , *
K E N N E T H L . S P E R R Y,
M AT T H E W T . W ALS H ,
S I M O N VAI N B E R G , AN D
C H AR LE S W . C O N D E E
En virogen , In c., 4100 Qu ak erbridge Road,
Law ren ceville, New Jersey 08648
Groundw ater contaminated w ith 1000-2500 µg/L chlorinated
ethenes (trichloroethene [TCE], dichloroethene [DCE],
vinyl chloride [VC]) w as treated by in situ bioaugmentation
w ith a specialized microorganism, Burkholderia cepacia
ENV435. The strain w as selected for its limited adhesion to
aquifer solids and its ability to degrade chlorinated
ethenes in the absence of inducing cosubstrates. Approximately 550 L of the toluene ortho -monooxygenaseproducing ENV435 culture (∼100 g/L) w as injected along w ith
oxygen (20 mg/L) into a semi-confined silty-sand aquifer
(test plot). An equal volume of basal salts medium
w as simultaneously injected into an adjacent control plot.
The plots each measured 4.6 m w ide by 12 m long,
w ere spaced 9.2 m apart, and contained 18 multilevel
monitoring w ells. Groundw ater ENV435 concentrations
exceeded 1 × 10⁸ cfu/mL 7 days after injection, and the
strain traveled the 12 m from injection to recovery w ell w ith
an average linear velocity of 0.37 to 0.54 m/day. By
comparison, a bromide tracer passed through the same
formation at a rate of 0.53 to 0.68 m/day. In one trial, the total
mass of TCE, DCE, and VC in the treated area w as
reduced by as much as 78% w ithin 2 days after injecting
the organisms.
Introduction
Volatile organ och loride com p ou n ds (VOCs) su ch as p erch loroeth ylen e (PCE), trich loroeth ylen e (TCE), dich loroeth ylen e (DCE), an d vin yl ch loride (VC) h ave been u sed
exten sively as in du strial solven ts, reagen ts, an d clean in g
agen ts, an d th ey h ave becom e com m on grou n dwater con tam in an ts th rou gh ou t th e Un ited States (1). Sign ifican t
resou rces h ave been exp en ded to iden tify su itable rem edial
altern atives for th ese ch em icals, an d in situ biorem ediation
h as em erged as a p oten tially im p ortan t tech n ology for
destroyin g th em .
A n u m ber of in situ biotreatm en t ap p roach es h ave been
develop ed an d tested. Th e first ap p roach , in trin sic biorem ediation or n atu ral atten u ation , in volves allowin g in digen ou s m icroflora to destroy th e con tam in an t of con cern
before it creates a sign ifican t risk to down gradien t recep tors
(2, 3). Th is h as becom e a n atu ral first ch oice of rem ediation
altern atives wh ere ap p licable becau se it requ ires n o in terven tion , ju st m on itorin g of con tam in an t con cen tration s an d
* Corresp on din g au th or p h on e: (609) 936-9300; fax: (609) 9369221; e-m ail; steffan @en virogen .com .
10.1021/es9812204 CCC: $18.00
Published on Web 07/13/1999
© 1999 Am erican Chem ical Society
m odelin g of th e grou n dwater flow an d n atu ral degradation
rates. An oth er ap p roach is biostim u lation wh ereby in digen ou s m icrobial p op u lation s are stim u lated to degrade VOCs
by addin g sp ecific n u trien ts, growth su bstrates, in du cers,
an d/ or oxygen to su p p ort th eir growth an d degradative
activity (4, 5, 6).
Wh en in trin sic biorem ediation or biostim u lation are n ot
ap p rop riate for a given site, bioau gm en tation m igh t be
u tilized. Bioau gm en tation in volves in jectin g selected exogen ou s organ ism s with th e desired catalytic cap abilities
directly in to th e con tam in ated zon es alon g with an y requ ired
n u trien ts to affect th e biodegradation of target ch em icals.
Two distin ct bioau gm en tation ap p roach es h ave been develop ed for rem ediatin g VOCs. In th e first ap p roach , degradative organ ism s are added to com p lem en t or rep lace th e
n ative m icrobial p op u lation (7, 8, 9). Th e added m icroorgan ism s can be selected for th eir ability to su rvive for
exten ded p eriods or to occu p y a sp ecific n ich e with in th e
con tam in ated en viron m en t. If n eeded, stim ulan ts or selective
cosu bstrates can be added to im p rove su rvival or en h an ce
activity of the added organ ism . Thus, the goal of this approach
is to ach ieve p rolon ged su rvival an d growth of th e added
organ ism s an d degradation of th e target p ollu tan ts.
In th e secon d bioau gm en tation ap p roach , large n u m bers
of degradative bacteria are added to a con tam in ated en viron m en t as biocatalysts that will degrade a sign ifican t am oun t
of th e target con tam in an t before becom in g in active or
p erish in g (10). Addition al m icrobes can be added as n eeded
to com p lete th e rem ediation p rocess. Attem p ts can be m ade
to in crease th e p rodu ction of th e degradative en zym es or to
m axim ize catalytic efficien cy or stability, bu t lon g-term
su rvival, growth , an d establish m en t of an active m icrobial
p op u lation are n ot th e p rim ary goals of th e treatm en t
ap p roach .
In th is stu dy, we evalu ated th e u se of th e latter bioau gm en tation ap p roach for rem ediatin g a ch lorin ated solven tcon tam in ated aquifer. Asp ecialized bacterium , Bu rkholderia
cepacia ENV435, was selected for th e stu dy becau se of several
im p ortan t ch aracteristics in clu din g: (1) its lim ited adh esion
to aquifer solids (adhesion deficien cy), (2) its ability to degrade
ch lorin ated eth en es in th e absen ce of in du cin g cosu bstrates
(con stitutive activity), (3) its ability to grow to high cell den sity
(∼100 g/ L) in a ferm en tor, an d (4) its accu m u lation of large
am ou n ts of in tern al en ergy reserves wh ich can p oten tially
be u sed to p rolon g VOC degradation an d su rvival.
Materials and Methods
Strain Developm ent. B. cepacia ENV435 (11) was develop ed
by selectin g adh esion deficien t varian ts of th e con stitu tive
tolu en e orth o-m on ooxygen ase-p rodu cin g strain B. cepacia
PR1 301 (8). Selection of th e n atu rally occu rrin g adh esion deficien t varian ts of th e strain was essen tially as p reviou sly
described (12), an d som e of th e adh esion ch aracteristics of
ENV435 h ave been rep orted (11). Strain ENV435 is resistan t
to n aladixic acid (20 µg/ m L), strep tom ycin (30 µg/ m L),
ch loram p h en icol (20 µg/ m L), an d cycloh exim ide (100 µg/
m L). For rou tin e m on itorin g of ENV435 in grou n dwater,
sam p les were dilu ted in 0.1 M p h osp h ate bu ffer (p H 7.0),
sp read p lated (13) on to R2Aagar p lates con tain in g 15 µg/ m L
n aladixic acid, 30 µg/ m L strep tom ycin , 20 µg/ m L ch loram p h en icol, an d 100 µg/ m L cycloh exim ide, an d in cu bated for
48 h at 30 °C. Backgrou n d bacterial cou n ts in test p lot
grou n dwater were <1 × 10² cfu / m l on th is m edia.
To p rodu ce large am ou n ts of ENV435 for th e field
dem on stration p roject, th e cells were grown in a 750-L
ferm en tor (ABEC, In c. Allen town , PA) filled with 550 L of
VOL. 33, NO. 16, 1999 / ENVIRONM ENTAL SCIENCE & TECHNOLOGY
9
2771
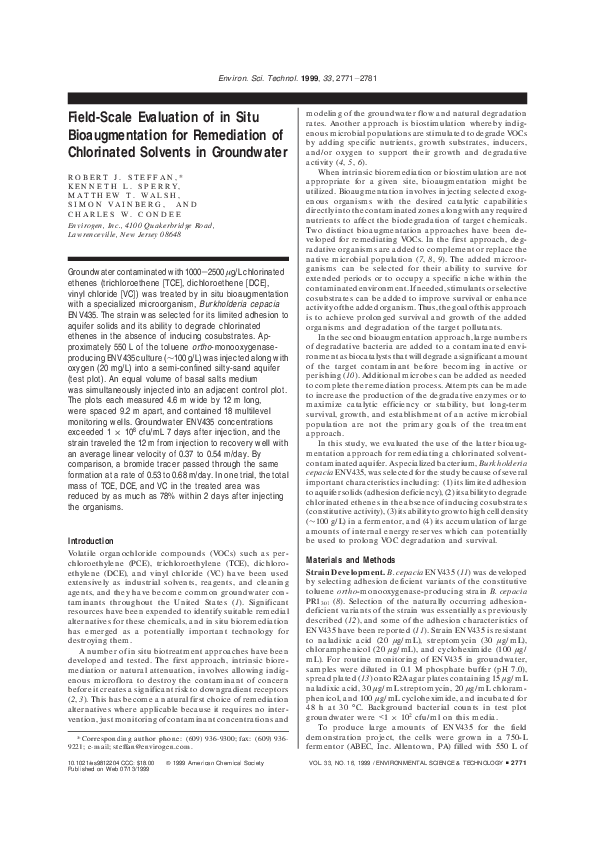
�FIGURE 1. Plan view of the bioaugmentation demonstration site show ing the location of injection, recovery, and monitoring w ells in the
control and test plot. Injection and monitoring w ells w ere constructed as nested w ells w ith one w ell screened in the shallow (upper
one-third) of the formation and one w ell screened in the deep (low er one-third) region of the formation.
basal salts m ediu m (BSM;14) con tain in g 1.6% (w/ w) su crose.
Th e p H of th e cu ltu re was m ain tain ed at 7.0 by addin g NaOH
or H 2SO 4 as n eeded. As th e sucrose with in th e reactor becam e
dep leted, as m easu red by an in crease in dissolved oxygen
(DO), th e cu ltu re was fed altern atin g batch es of su crose an d
p h en ol as carbon sou rces. Bacterial storage p olym ers were
p rodu ced n atu rally by th e strain as th e am m on iu m in th e
reactor becam e dep leted. Cell den sity was determ in ed by
m easu rin g th e op tical den sity of dilu ted sam p les at 550 n m
(OD 550). Th e VOC-degradin g activity of th e cu ltu re was
m on itored by perform in g TCE bottle assays (15), an d bacterial
storage p olym er con cen tration s were m easured as previously
described (16). Th e h igh cell den sity cu ltu res of ENV435 were
tran sferred to the field dem on stration site as described below.
2772
9
ENVIRONM ENTAL SCIENCE & TECHNOLOGY / VOL. 33, NO. 16, 1999
Site Characterization and Experim ental Plots. Th e test
system u sed in th is stu dy was located at an in du strial facility
in Pen n sau ken , New Jersey. Th e form ation is h eterogen eou s
an d com p rised of ap p roxim ately 2.4 to 3 m of silty, fin e to
m ediu m san ds in tersp ersed with th in (2 to 5 cm th ick) len ses
of m oderately p lastic gray clay. Th e test p lots were in stalled
in a p ortion of th e form ation th at was con fin ed above an d
below by a m oderately p lastic gray clay.
Th e field dem on stration system con sisted of a test p lot
an d a con trol p lot (Figu re 1). Th e test p lot served as a
treatm en t cell an d received ENV435, wh ereas th e con trol
p lot did n ot receive ENV435. Th e p lots m easu red 4.6 m wide
by 12 m lon g, an d were sp aced 9.2 m ap art as sh own in
Figu re 1. Th e test an d con trol p lots each con tain ed th ree sets
�of du al n ested in jection wells (a total of six in jection wells
in each p lot), an d on e recovery well in stalled ap p roxim ately
12 m h yd rau lically d own gradien t of th e in jection wells
(Figu re 1). Nin e sets of du al n ested m on itorin g wells (on e
well in th e lower th ird of th e form ation an d on e in th e u p p er
th ird) were in stalled between the in jection wells an d recovery
well (3 each at ap p roxim ately 2, 5, an d 8 m down gradien t of
th e in jection wells) in each p lot. On e du al-n ested well set
an d two in dividu al m on itorin g wells were in stalled ou tside
of th e dim en sion s of th e test p lot to m on itor for crosscon tam in ation between th e p lots or m igration of in jected
bacteria u p gradien t or down gradien t of th e test p lot (Figu re
1).
In jection an d m on itorin g wells were con stru cted from
5.1 cm diam eter Sch edu le 40 p oly(vin yl ch loride) (PVC) riser
p ip e. Th e screen s on th e in jection an d m on itorin g wells were
0.6 m lon g with 0.05 an d 0.03 cm stan dard slot Sch edu le 40
PVC screen s wells, resp ectively. Morie san d, grain sizes
n u m ber 0 an d n u m ber 00, was u sed to con stru ct a san d p ack
aroun d in jection an d m on itorin g wells, respectively. The san d
p ack typ ically exten ded 0.3 m above an d below th e top an d
bottom of th e well screen . A m in im u m of 1.4 m of ben ton ite
seal was in stalled above the well screen to hydraulically isolate
th e in jection p oin ts. Recovery wells were con stru cted from
15-cm Sch edu le 40 PVC riser p ip e an d a 3-m stain less steel
wire wrap , 0.03-cm slot, screen . Each recovery well was
equ ip p ed with a 10-cm diam eter Gru n dfos Redi-Flo4 5E12
su bm ersible p u m p (Pu m p s of Oklah om a, Oklah om a City,
OK).
Recovered grou n dwater was p ip ed u n dergrou n d to a
treatm en t bu ildin g wh ich h ou sed a sep arate grou n dwater
am en dm en t an d rein jection system for each p lot. Th e
recovered grou n dwater was p assed th rou gh an oxygen ation
vessel (described below), a cartridge filtration system (th ree
p leated cellu lose 30-µm p ore size filters p ip ed in p arallel) to
rem ove sedim en t an d p recip itated m etals (e.g., iron ), an d
th en in to an in jection m an ifold con stru cted with 12 RateMaster flow m eters (Dwyer, In c., Mich igan City, IN). Th e
m an ifold distribu ted th e oxygen ated grou n dwater to th e test
an d con trol p lot in jection wells via u n dergrou n d p ip in g.
Grou n dwater VOC con cen tration s were m easu red in both
th e recircu lation system an d m on itorin g wells by u sin g EPA
m eth od 8260 (17).
Characterization of Site Hydraulic Param eters. Prior to
in jectin g bacteria, th e h ydrau lics of th e test an d con trol p lots
were evalu ated by p erform in g slu g tests, p u m p in g tests, an d
con servative tracer stu dies. Fallin g h ead an d risin g h ead slu g
tests were p erform ed at each in jection an d m on itorin g well
in accordan ce with ASTM stan dard test m eth od D 4044-91
(18) to determ in e th e variability in h ydrau lic con du ctivity
th rou gh ou t th e p ilot-test area. A series of five p u m p in g tests
were p erform ed at recovery wells in th e p ilot-test area in
accordan ce with ASTM stan dard test m eth od D 4050-91 (18).
Each p u m p in g test was p erform ed for ap p roxim ately 24 h at
a p u m p in g rate ran gin g from 2.3 to 3.8 L/ m in . wh ile water
level elevation s were recorded by u sin g su bm ersible p ressu re
tran sdu cers lin ked to a data logger (In Situ , In c., Laram ie,
WY). Pu m p in g test data were an alyzed by th e Th iem m eth od
(19) for steady-state con dition s, an d by th e Coop er-Jacob
m eth od (20) for tran sien t con dition s to calcu late th e tran sm issivity, h ydrau lic con du ctivity, an d sp ecific yield of th e
aqu ifer in th e p ilot-test area.
A con vergen t sodiu m brom ide tracer test was p erform ed
to determ in e th e p redom in an t flow p ath ways an d tran sp ort
tim e of grou n dwater between th e Test p lot in jection an d
recovery wells. A total of 57 L of NaBr solu tion (137 g/ L) was
in jected in to th e six in jection wells over a p eriod of 20 m in .
To verify th e lack of cross-con tam in ation between th e p lots,
the tracer test was perform ed while the recovery an d in jection
wells in both th e test an d con trol p lots were op eratin g. Th e
grou n dwater recovery an d in jection system op erated at 3.8
L/ m in for 30 con secu tive days after th e tracer in jection , with
p eriodic sam p lin g an d brom ide an alysis. Th e sam e p u m p in g
con dition s were m ain tain ed th rou gh ou t th e dem on stration .
Data from a sim ilar, bu t earlier, brom ide tracer test at th e
site was u sed to estim ate effective p orosity u sin g a p reviou sly
described m eth od (21).
Oxygen Delivery Procedures. Two m eth ods were em p loyed for su p p lyin g oxygen to th e su bsu rface du rin g th e
p ilot test. Th e first m eth od, wh ich was u sed th rou gh ou t th e
dem onstration, consisted of oxygenating recirculating groundwater p rior to in jection in to th e test an d con trol p lots. Th e
recovered grou n dwater was p assed th rou gh an oxygen atin g
vessel th at was con stru cted of Sch edu le 80 PVC equ ip p ed
with aerosol sp ray n ozzles an d su p p lied with a con stan t flow
of oxygen gas (99.5%). Th e oxygen ation vessel was op erated
as a closed system to p reven t strip p in g of VOCs, an d VOC
an d DO con cen tration s were m easu red im m ediately p rior
to in jectin g th e water in to th e form ation .
Th e secon d m eth od of su p p lyin g oxygen was by direct
in jection of oxygen (99.5%) in to th e su bsu rface th rou gh th e
existin g m on itorin g wells. Mon itorin g wells screen ed in th e
lower form ation of th e test p lot were fitted with lockin g
airtight caps equipped with pn eum atic quick con n ect fittin gs.
A flexible oxygen su p p ly lin e was u sed to p eriodically deliver
oxygen to th ese m on itorin g wells. To p reven t strip p in g of
VOCs, on ly en ough oxygen was added to each well to disp lace
th e water in th e well, an d th ereby m in im ize sp argin g in th e
form ation . Dissolved oxygen con cen tration s were m on itored
in th e u p p er p ortion s of th e form ation to detect th e u p ward
m ovem en t of oxygen (i.e., sp argin g) from th e lower oxygen
in jection p oin ts.
Bacteria and Nutrient Injection Procedures. The bacteria
an d n u trien t in jection system con sisted of two 750-L h igh den sity p olyeth ylen e h oldin g/ m ixin g tan ks (on e for each
p lot), a m icrobe an d n u trien t feed p u m p , an d a com p ressed
oxygen su p p ly system . Th e test p lot h oldin g/ m ixin g tan k
was equ ip p ed with a com p ressor an d an air diffu ser to su p p ly
oxygen to m icroorgan ism s in th e tan k du rin g in jection . Th e
feed p u m p was a skid-m ou n ted, n on sh earin g p ositive
displacem en t diaphragm pum p (Neptun e, Lan sdale, PA), an d
was u sed to in ject bacteria, n u trien ts, or in ert tracer at flow
rates of u p to 3.8 L/ m in . Bacterial cu ltu re (550 L) was
tran sferred to th e field site in a 1100-L p lastic tan k equ ip p ed
with an air ston e an d com p ressor an d th en p u m p ed in to th e
on -site h oldin g tan ks of th e in jection system .
Two bacteria in jection trials were p erform ed to evalu ate
th e effect of differen t m eth ods of bacteria dep loym en t an d
oxygen delivery on th e effectiven ess of bioau gm en tation for
VOC rem ediation . In th e first trial (trial n u m ber 1), bacteria
were in jected in to th e test p lot th rou gh th e u p gradien t
in jection wells. Th e cu ltu re was added to th e recircu latin g
grou n dwater to ach ieve an in jection con cen tration of ap p roxim ately 1 × 10 11 cfu / m l. A total of 550 L of bacteria
(1.2 × 10¹¹ cfu / m l) were in jected at a rate of 2.3 to 3.0 L/ m in .
Du rin g th e in jection p eriod, th e grou n dwater p u m p in g rate
was m ain tain ed at 3.0 L/ m in . An equ al volu m e (550 L) of
1 × BSM solution was sim ultan eously in jected in to the con trol
p lot at th e sam e rate. Oxygen was su p p lied to th e test an d
con trol p lots by oxygen atin g th e recircu latin g grou n dwater.
The secon d trial was design ed to rapidly distribute ENV435
th rou gh ou t th e test p lot an d to su p p ly oxygen across th e
en tire p lot. An equ al volu m e of ENV435 cu ltu re (∼1 × 10 11
cfu / m l) was in jected u n der p ressu res of 10 to 30 p si an d a
flow rate of 2.3 to 3.0 L/ m in in to the m on itorin g wells screen ed
in th e lower form ation of th e test p lot. Prior to an d after
in ocu lu m in jection , th e m on itorin g wells were evacu ated
with com p ressed oxygen to force th e cu ltu re in to th e
form ation . Oxygen was in jected directly in to th e m on itorin g
wells p eriodically after th e bacteria in jection to m ain tain a
VOL. 33, NO. 16, 1999 / ENVIRONM ENTAL SCIENCE & TECHNOLOGY
9
2773
�grou n dwater flow m odelin g in dicated th at ap p roxim ately
50% of th e total flow of circu lated grou n dwater wou ld p ass
th rou gh th e test p lot. Brom ide tracer in th e test p lot was
tran sp orted fastest th rou gh th e lower zon e of th e aqu ifer.
Th e tracer in itially traveled alon g th e sou th side of th e test
p lot an d th en m igrated toward th e n orth side of th e p lot. Th e
brom ide fron t traveled th e len gth of th e test p lot (12 m ) in
ap p roxim ately 13 days. Th e m easu red average lin ear velocity
of th e brom ide tracer was ap p roxim ately 0.53 an d 0.68 m / day
in th e u p p er an d lower region s of th e aqu ifer, resp ectively
(Figu re 2).
TABLE 1. Results of Large-Scale Fermentation (550 L) of
Strain ENV435
parameter
initial m edia
m edia volum e
inoculum volum e
initial optical density at
550 nm
initial cell counts
grow th rate
exponential grow th rate
final cell counts
final optical density at
550 nm
cell yield
storage polym er yield
specific activity of cells
30 °C
13 °C
ferm entation tim e
grow th yield (total)
grow th yield
(during log phase)
value
1 × BSM + 3 g/L NH4Cl +
1.6% w /w sucrose
550 L
5.5 L
0.06-0.08
1.7-2.3 × 10⁸ cfu/m l
0.28-0.35 hr -1
0.19-0.24 hr -1
1.0-1.7 × 10¹¹ cfu/m l
55-61
ENV435, in jected at an in itial con cen tration of ap p roxim ately 1 × 10 11 cfu / m l, ap p eared to follow th e sam e
grou n dwater flow p ath s th rou gh th e test p lot as th e brom ide
tracer (Figu re 3). Th e strain was in itially tran sp orted alon g
th e sou th ern bou n dary of th e test p lot, with lesser con cen tration s of bacteria travelin g through the n orth side an d cen ter
of the plot. The highest m easured groun dwater con cen tration
of ENV435 was 1.9 × 10 8 cfu / m l at m on itorin g well AFM111B located ap p roxim ately 2 m h ydrau lically down gradien t
of th e in jection wells. A sim ilar distribu tion , bu t lower
con cen tration , of ENV435 was observed in th e u p p er zon e
of th e test p lot, with th e h igh est con cen tration of ENV435
(2.2 × 10⁷ cfu / m l) at m on itorin g well AFM1-12A located 2 m
down gradien t of th e in jection wells. ENV435 were detected
in th e recovery well of th e test p lot 20 days after in jection .
No ENV435 were observed u p - or down gradien t of th e test
p lot, n or in th e con trol p lot.
Th e ENV435 lin ear velocity was calcu lated on th e basis
of th e m ovem en t of th e ENV435 con cen tration p eak th rou gh
th e test p lot. Th e m easu red lin ear velocities of ENV435
ran ged from ap p roxim ately 0.23 to 0.80 m / day du rin g trial
n u m ber 1 an d averaged 0.54 m / day an d 0.37 m / day in th e
lower an d u p p er region s of th e test p lot, resp ectively. Th e
ratio of th e tracer velocity (v Br ) to ENV435 velocity (v ENV) in
th e u p p er an d lower zon e of th e test p lot was ap p roxim ately
1.43 an d 1.26, resp ectively. However, th e several log decrease
in ENV435 con cen tration s between th e in jection wells an d
th e down gradien t m on itorin g wells in dicate th at sign ifican t
am ou n ts of th e strain were bein g filtered by th e aqu ifer
sedim en t or were p erish in g. A sim p le first- order decay
an alysis of th e tran sp ort data su ggested an ENV435 h alf-life
of on ly 1 an d 2 days in th e sh allow an d deep zon es of th e
aqu ifer, resp ectively (Table 3). By com p arison , wh en ENV435
(1 × 10⁹ cfu / m l) was added to aqu ifer m icrocosm s con stru cted with site sedim en t an d water sam p les, viable cell
n u m bers decreased by abou t 2 orders of m agn itu de over a
35-day in cu bation (data n ot sh own ).
16-18 g/L (dw t)
50-64% (dw t)
0.074 µg TCE/m g cell protein/m in
0.027 µg TCE/m g cell protein/m in
108-110 hr
0.25-0.28 g dw t/g sucrose
0.51-0.53 g dw t/g sucrose
DO con cen tration above 8 m g/ L. Th e recircu lation system
was op erated du rin g th e first 14 days after bacteria in jection ,
an d th e Con trol p lot was n ot op erated du rin g th e secon d
trial.
Results
Production and Injection of ENV435. Th e resu lts of largescale ferm en tation of strain ENV435 are p rovided in Table
1. Ap p roxim ately 2.5 h were requ ired to tran sfer th e bacteria
from th e ferm en tor to th e tran sp ort tan k an d u ltim ately to
th e bacteria in jection system at th e test site. TCE degradation
assays p erform ed im m ediately after ferm en tation an d p eriodically du rin g th e in jection p eriod sh owed n o m easu rable
decrease in sp ecific activity of th e cu ltu re du rin g th e
ap p roxim ately 3.7 h of in jection . Du rin g trial n u m ber 1, a
total of 394 L was delivered in to th e deep in jection wells, an d
157 L was in jected in to th e sh allow in jection wells of th e test
p lot. A total of 305 an d 243 L of BSM were in jected in to th e
con trol p lot deep an d sh allow in jection wells, resp ectively,
durin g the sam e tim e. The differen ce in the am oun t of culture
in jected in to th e two form ation s was du e to th e differen ce
in h ydrau lic con du ctivity of th e form ation s. Du rin g trial
n u m ber 2, 61 L of ENV435 cu ltu re was in jected in to each of
th e n in e deep m on itorin g wells.
Bacterial Transport. Th e h ydrogeologic ch aracteristics
of th e test aqu ifer are p resen ted in Table 2. Prelim in ary
Th e trial n u m ber 2 direct in jection of ENV435 (in itially
1.1 × 10¹¹ cfu / m l) in to deep m on itorin g wells th rou gh ou t
TABLE 2. Test Plot Hydrogeologic and ENV435 Transport Properties
parameter
notes
units
shallow zone
hydraulic conductivity, Kh
hydraulic gradient, i
hydraulic gradient, i
effective porosity, ηe
total porosity, η
dispersivity, R
soil bulk density, Fb
ENV435 partition coefficient, Kd
groundw ater linear velocity, νgw
brom ide linear velocity, νBr
ENV435 velocity v env
v Br :v env
a
b
c
d
e
d
f
g
b
d
g
m /day
m /m
m /m
1.13
2.70
0.002
0.0077
m
kg/L
L/kg
m /day
m /day
m /day
deep zone
test plot
average
0.075
0.16
0.50
0.056
1.3
0.051
0.89
0.53
0.37
1.43
0.68
0.54
1.26
a Values calculated from pum ping test results. b Values m easured or calculated w hile pum ping both the control and test plots at 3 L/m in. c Values
m easured under static (nonpum ping) conditions. d Value calculated from brom ide tracer testing. e Value calculated from soil bulk density. f Value
determ ined from laboratory analysis. g Values calculated from trial num ber 1 test results.
2774
9
ENVIRONM ENTAL SCIENCE & TECHNOLOGY / VOL. 33, NO. 16, 1999
�FIGURE 2. Isoconcentration contours of Br in mg/L in the test plot during trial number 1. The tracer test w as performed w ith recovery
w ells in both the control and test plot pumping at 3.8 L/min.
FIGURE 3. Isoconcentration contours of strain ENV435 in log cfu/ml in the test plot during trial number 1.
TABLE 3. Regression Analysis of Trial Number 1 Groundwater ENV435 Concentration Data and Estimates of ENV435 Half-Life
shallow w ellsa
a
deep w ellsb
parameter
day 10
day 15
day 18
day 10
day 15
day 18
slope, λ/v gw
goodness of fit, R2
linear GW velocity, v gw (m /day)
first-order decay rate, λ (day -1)
first-order half-life, t 1/2 (day)
0.8227
0.99
0.53
1.440
0.481
0.4237
0.93
0.53
0.741
0.93
0.4215
0.88
0.53
0.738
0.94
0.4708
0.93
0.68
1.045
0.66
0.1237
0.93
0.68
0.275
2.52
0.1956
0.90
0.68
0.434
1.60
AFM 1-12A, AFM 1-22A, AFM 1-32A.
b
AFM 1-12B, AFM 1-22B, AFM 1-32B.
th e test p lot (trial n u m ber 2) resu lted in th e h igh est observed
grou n dwater ENV435 con cen tration s. ENV435 con cen tration s exceeded 1 × 10 9 cfu / m l in m ost test p lot deep wells
2 days after in jection , an d were as h igh as 1.6 × 10 10 cfu / m L
in m on itorin g well AFM1-21B 5 days after in jection . The exact
distan ce traveled by th e in jected bacteria is n ot kn own
becau se of th e difficu lty of collectin g aqu ifer sam p les away
from th e m on itorin g wells, bu t trial n u m ber 1 tran sp ort data
in dicated th at th ey sh ou ld h ave m oved ap p roxim ately 0.8
m / day away from th e in jection p oin ts.
Oxygen Use and Distribution. Two m eth ods were u sed
for oxygen atin g grou n dwater du rin g th e bioau gm en tation
trials: (1) am en din g re-circu latin g grou n dwater with oxygen ,
an d (2) directly in jectin g oxygen in to th e test area form ation .
In gen eral, re-circu latin g grou n dwater was am en ded with
oxygen to 20 m g/ L, an d direct in jection of oxygen (trial
VOL. 33, NO. 16, 1999 / ENVIRONM ENTAL SCIENCE & TECHNOLOGY
9
2775
�FIGURE 4. Groundw ater VOC concentration in the deep zone of the test and control plots after injection of ENV435 during trial number
1. Panels A, B, and C represent the north, center, and south columns of monitoring w ells in the test plot, respectively, and panel D represents
the center column of the control plot. Diamonds, squares, and triangles represent the VOC concentration (µg/L) in monitoring w ells located
2, 5, and 8 m dow ngradient of the injection w ells, respectively. Groundw ater pumped from the recovery w ells w as reinjected into the
injection w ells for the duration of the test.
n u m ber 2) was p erform ed to m ain tain in situ grou n dwater
DO con cen tration s above 8 m g/ L. A total of 6.2 kg of oxygen
was added du rin g trial n u m ber 1, all via am en dm en t of
recircu latin g grou n dwater. Du rin g trial n u m ber 2, on e kg of
oxygen was added to th e recircu latin g grou n dwater, an d 11.4
kg of oxygen were directly in jected in to th e form ation .
Becau se of th e con fin ed n atu re of th e test form ation , it was
assu m ed th at all of th e added oxygen rem ain ed trap p ed
with in th e form ation below th e overlyin g clay u n til dissolved.
Du rin g trial n u m ber 1, m easu rable levels of DO typ ically
occu rred on ly with in abou t 2 m from th e in jection wells in
both th e u p p er an d lower zon es of th e test p lot, with
con cen tration s >2 m g/ L rarely observed in m on itorin g wells
located 5 or 8 m down gradien t. In th e con trol p lot, grou n dwater DO con cen tration s typ ically exceeded 20 m g/ L in th e
first row of m on itorin g wells (2 m ) an d were con sisten tly >2
m g/ L at m on itorin g wells located 5 an d 8 m down gradien t
of th e in jection wells.
Direct in jection of oxygen in to th e deep m on itorin g wells
of th e test p lot du rin g trial n u m ber 2 resu lted in sign ifican tly
higher groun dwater DO con cen tration s than observed durin g
trial n u m ber 1. DO con cen tration s were con sisten tly greater
th an 20 m g/ L in all of th e test p lot deep m on itorin g wells
im m ediately followin g oxygen in jection s, an d th ey gen erally
decreased to ap p roxim ately 2 m g/ L 3 to 5 days after in jectin g
th e bacteria.
VOC Degradation. To evalu ate degradation of VOCs in
th e test aqu ifer, th e total VOCs were sep arated in to th ose
th at can be biodegraded by strain ENV435 (“T1”: TCE, DCE,
VC), an d th ose th at are n ot degraded (“T2”: PCE, dich lo2776
9
ENVIRONM ENTAL SCIENCE & TECHNOLOGY / VOL. 33, NO. 16, 1999
roeth an e [DCA] an d trich loroeth an e [TCA]). Th u s, th e
n on degradable VOCs served as in tern al stan dards for evaluatin g biodegradation .
Grou n dwater con cen tration s of th e T1 VOCs in deep
m on itorin g wells of th e test p lot an d th e con trol p lot du rin g
trial n u m ber 1 are p resen ted in Figu re 4. Th e T1 VOCs in th e
deep zon e of th e test p lot decreased from ap p roxim ately
2200 µg/ L to less th an 500 µg/ L at m ost location s in th e p lot.
Th e greatest degradation occu rred alon g th e sou th ern edge
of th e test p lot (Figu re 4C). Th ere, T1 VOCs decreased from
approxim ately 2200 µg/ L to 250 µg/ L in the first 2 m , rem ain ed
stable over th e n ext 3 m , an d th en decreased to less th an 50
p p b over th e followin g 3 m (m easu red at AFM1-31). Th e
con cen tration s of th e in dividu al T1 com p ou n ds at AFM1-11
are sh own in Figu re 5. Th e p rogressive decrease in T1 VOC
con cen tration s with distan ce su ggested th at th e organ ism s
con tin u ed to degrade VOCs as th e organ ism s an d treated
water m oved down gradien t.
In th e cen ter row of th e test p lot (Figu re 4B) degradation
was greatest in th e first 2 m , but degradative activity ap p eared
to decrease or cease as th e organ ism s m oved down gradien t.
Degradation ap p eared m in im al in th e first 2 m of th e n orth
edge of the test plot (Figure 4A) which received lower n um bers
of ENV435, bu t it in creased in th e down gradien t areas of th e
n orth edge of th e p lot. A sim ilar tren d in total degradable
VOC con cen tration s was observed in test p lot sh allow
m on itorin g wells (data n ot shown ), but overall th e m agn itude
of VOC degradation was less, p resu m ably becau se of th e
lower volu m e of in ocu lu m an d oxygen ated water in jected
in to th e sh allow form ation .
�FIGURE 5. Concentration of individual degradable VOCs and total nondegradable VOCs (PCE, DCA, TCA) at deep monitoring w ell AFM 1-11B
(south column, 2 m from injection w ell). Symbols: TCE, b; c DCE, 1; VC, 9; total nondegradable VOCs, O.
FIGURE 6. Concentration of degradable VOCs (µg/L) in the reinjected groundw ater entering the test plot during trial number 1 (b) and
trial number 2 (1), and the control plot during trial number 1 (O).
In each case th e total VOC con cen tration in th e test p lot
rebou n ded several days after in jectin g th e organ ism s. Th is
rebou n d was likely du e to th e con tin u ou s rein jection of
con tam in ated grou n dwater from th e recovery well wh ich
collected water both from th e test p lot an d th e m ore h eavily
con tam in ated p lu m e (u p to 4000 µg/ L VOCs) im m ediately
down gradien t of th e test p lot (Figu re 6). Som e am ou n t of
rebou n d was also p ossible as a resu lt of desorp tion of VOCs
from th e aqu ifer sedim en ts. Th e total con cen tration of T1
VOCs m easu red in th e con trol p lot rem ain ed relatively stable
th rou gh ou t th e 60-day m on itorin g p eriod of trial n u m ber 1
(Figu re 4D), an d th ey were n ot m easu rably affected by th e
in jection of BSM.
Acom p arison of th e ratio of degradable to n on degradable
VOCs (T1:T2) an d th e con cen tration of total T2 com p ou n ds
in th e test p lot m on itorin g wells is p rovided in Figu re 7. Th e
T1:T2 ratio decreased from ap p roxim ately 14 to less th an 2
in m ost location s of th e test p lot th at received in ocu lu m ,
an d did n ot chan ge in th e con trol p lot. Th e observed decrease
in T1:T2 ratios in dicated th at th e m easu red decrease in
grou n dwater total VOC con cen tration is attribu table to
biologically m ediated degradation an d n ot physical processes
su ch as dilu tion or disp lacem en t, even th ou gh som e dilu tion
of th e T2 com p ou n ds was ap p aren t.
The greatest decrease in groun dwater VOC con cen tration s
du rin g th e en tire stu dy was observed in trial n u m ber 2 wh en
VOL. 33, NO. 16, 1999 / ENVIRONM ENTAL SCIENCE & TECHNOLOGY
9
2777
�FIGURE 7. Ratio of degradable VOCs (T1: TCE, DCE, VC) to nondegradable VOCs (T2: PCE, DCA, TCA) in the test and control plots. Panels
A, B, and C represent deep center column monitoring w ells in the test plot located 2, 5, and 8 m dow ngradient of the injection w ells,
respectively. Symbols are: trial number 1 T1:T2, (b); trial number 2 T1:T2, (1); trial number 1 total T2 compounds (µg/L), (O); trial number
2 concentration of total T2 compounds (µg/L), (3). Panel D represents the control plot trial number 1 T1:T2 in the deep center column
monitoring w ells located 2 m (b), 5 m (1), and 8 m (9) dow ngradient of the injection w ells, and total T2 compounds (µg/L), (3).
FIGURE 8. Isoconcentration contours of degradable VOCs (TCE, DCE, VC) in the test plot during trial number 2. Values are in µg/L.
Groundw ater pumped from the recovery w ell w as reinjected into the injection w ells during the first 14 days after ENV435 injection.
b acteria an d oxygen were d irectly in jected th rou gh deep
m on itorin g wells located th rou gh ou t th e test p lot (Figu re 8).
Th e m ost dram atic decrease occu rred n ear th e cen ter of th e
p lot wh ere th e con cen tration of T1 VOCs was redu ced to
ap p roxim ately 50 µg/ L. Th e con cen tration of T1 VOCs
2778
9
ENVIRONM ENTAL SCIENCE & TECHNOLOGY / VOL. 33, NO. 16, 1999
rebou n ded sligh tly by day 5, p resu m ably du e to recircu latin g,
con tam in ated grou n dwater in to th e test p lot (Figu re 6).
As observed in trial n u m ber 1, th e ratio of degradable to
n on degradable VOCs decreased rap idly in each well after
in jectin g ENV435 (Figu re 7). In trial n u m ber 2, h owever, th e
�m agn itu de of th e decrease was sim ilar th rou gh ou t en tire
p lot; it was n ot less in th e down gradien t wells th an in th e
u p gradien t wells. Like th e total VOC con cen tration , th e T1:
T2 ratio within the test plot reboun ded with tim e, presum ably
becau se of rein jectin g con tam in ated water in to th e p lot
(Figu re 6).
Estim a te of VOC Ma ss Rem ova l. Two m eth ods were
u sed to estim ate th e m ass of VOCs degraded in th e test p lot.
In th e first m eth od, th e am ou n t of VOCs circu lated in to th e
test p lot at th e in jection wells was com p ared to th e am ou n t
of VOCs p assin g th e first row of m on itorin g wells, 2 m away
from th e in jection wells. Assu m in g th at 50% of th e recircu latin g grou n dwater p assed th rou gh th e test p lot, ap p roxim ately 107 g of VOCs were in jected in to th e test p lot du rin g
th e first 21 days of trial n u m ber 1 after in jectin g ENV435. On
th e basis of th e m ean con cen tration of VOCs at th e first row
of m on itorin g wells, ap p roxim ately 31 g of VOCs were
rem oved in th e lower zon e of th e aqu ifer, an d 15 g were
rem oved in th e u p p er zon e (total of 46 g VOCs rem oved).
Th is rep resen ted a rem oval of abou t 44% of th e in jected
degradable VOCs. After th e first 21 days of trial n u m ber 1,
addition al m ass rem oval in th e first 2 m of th e test p lot was
n egligible.
In th e secon d an alysis, th e total m ass of VOCs in th e test
p lot was estim ated by m u ltip lyin g th e average VOC con cen tration at all of th e m on itorin g wells by th e estim ated
volu m e of th e treated zon e (assu m in g a total p orosity of 0.5,
calcu lated from th e m easu red soil bu lk den sity). Mass
rem oved was calcu lated by com p arin g total VOC m ass p rior
to in jection of ENV435 to th e lowest total m ass in th e p lot
after in jectin g the organ ism s. Durin g trial n um ber 1, the in itial
estim ated dissolved m ass of VOCs in th e p lot was 244 g (125
g in th e sh allow zon e, an d 119 g in th e deep zon e). On day
13 after in jectin g th e organ ism s, th ere was an estim ated 54
g of VOCs rem ain in g in th e sh allow zon e an d 49 g rem ain in g
in th e deep zon e. Th u s, at day 13 estim ated VOC m asses of
71 an d 70 g were rem oved in th e sh allow an d deep zon es,
resp ectively (total of 141 g VOCs rem oved). Th is rep resen ted
a total m ass rem oval of ap p roxim ately 58% of th e VOCs in
th e test p lot.
Th e sam e an alysis p erform ed with data from trial n u m ber
2 in dicated an estim ated in itial VOC m ass in th e lower zon e
of th e test p lot of 60 g. An estim ated 13 an d 23 g total VOCs
were rem ain in g in th e p lot on days 2 an d 8, resp ectively. Th is
rep resen ted 78% rem oval of VOCs in th e test p lot du rin g th e
first 2 days.
Strip p in g of VOCs was assu m ed to be m in im al du rin g
th is stu dy. Du rin g trial n u m ber 1, oxygen was added on ly to
recircu latin g grou n dwater p rior to rein jection , an d th e h igh
oxygen dem an d of th e in jected organ ism s an d n atu ral sin ks
su ch as h igh ferrou s iron likely lim ited off gassin g of th e
added oxygen . Likewise, du rin g trial n u m ber 2, oxygen was
added to th e form ation by p ressu rizin g deep wells with p u re
oxygen wh ile attem p tin g to m in im ize sp argin g. Becau se th e
aqu ifer was con fin ed above an d below by clay layers, an y
oxygen or VOCs strip p ed from th e lower area of th e form ation
wou ld likely dissolve in to th e u p p er form ation grou n dwater
cau sin g an in crease in VOC an d DO con cen tration s. No su ch
in creases in VOC or DO con cen tration s were observed in th e
u p p er form ation .
Discussion
Th is stu dy was design ed to test th e utility of bioau gm en tation
for rem ediatin g aquifers con tam in ated with VOCs. The ability
of an exogen ou s organ ism to su rvive an d com p ete for
resou rces again st in digen ou s organ ism s h as lon g been an
area of in terest in both m acro an d m icrobial ecology, an d in
m ost cases added organ ism s do n ot fare well (7, 22, 23). Th e
lack of com p etitiven ess of exogen ou s strain s can be exacerbated du rin g co-m etabolic degradation of VOCs becau se
oxidation of these com poun ds can produce toxic in term ediates th at dam age th e degradative organ ism s (24, 25) an d
fu rth er redu ce th eir com p etitiven ess (23). Th e difficu lty in
establish in g fu n ction al m icrobial p op u lation s of exogen ou s
organ ism s p rom p ted u s to evalu ate a secon d ap p roach for
ap p lyin g bioau gm en tation . To ap p ly th e tech n ology, large
am ou n ts of degradative organ ism s were grown ex situ in a
ferm en tor an d th en in jected directly in to a con tam in an t
p lu m e with ou t th e exp ectation of lon g-term su rvival. For
th is tech n iqu e to be an effective rem edial altern ative, en ou gh
con tam in an t m u st be rem oved to allow closu re of th e site,
or degradative organ ism s m u st be rep eatedly cu ltu red an d
added u n til con tam in an t levels are su fficien tly redu ced.
Ex situ ferm en tation an d bioau gm en tation m ay h ave an
advan tage over in situ biostim u lation tech n ologies becau se
op tim u m growth con dition s for sp ecific biocatalysts can be
develop ed an d m ain tain ed. For exam p le, du rin g th is stu dy,
h igh ly active ENV435 cu ltu res were p rodu ced by growin g
the strain in a ferm en tor on sucrose with the periodic addition
of p h en ol to m ain tain fu ll in du ction of th e catalytic gen es.
In a fu ll-scale field ferm en tor th e p eriodic addition of p h en ol
also m ay h elp m ain tain th e in tegrity of th e cu ltu re du rin g
p rolon ged ferm en tation by in h ibitin g th e growth of con tam in atin g organ ism s. Du rin g th is stu dy, growth rates as
great as 0.19 h r -1 were ach ieved, th e cells cou ld be grown to
h igh cell den sity (>1 × 10¹¹ cfu / m l), an d th e resu ltin g cells
h ad a h igh sp ecific activity for degradin g VOCs (Table 2). It
wou ld be difficu lt to obtain su ch growth rates an d h igh
sp ecific activity du rin g in situ biostim u lation (4, 5) becau se
of colder tem p eratu res, in su fficien t m ixin g, an d th e in ability
to supply sufficien t am oun ts of oxygen an d growth substrates.
Du rin g ferm en tation , ENV435 n atu rally p rodu ced large
am ou n ts of h igh -en ergy p olyalkan oate storage p olym ers.
Alth ou gh th e exact effect of th ese p olym ers on th e catalytic
activity or survival of ENV435 in situ was n ot evaluated durin g
th is stu dy, su ch p olym ers h ave been sh own to su p p ly
redu cin g en ergy (i.e., NADH) for degradin g VOCs (26, 27,
28), an d p ossibly in crease th e in h eren t degradative cap acity
of th e organ ism (26) in laboratory stu dies.
Prior field stu dies of bioau gm en tation for VOC degradation (9, 10) h ave m et with m ixed resu lts, largely du e to th e
p oor tran sp ort p rop erties of th e m icroorgan ism s th at p reven ted th em from com in g in to con tact with th e target
con tam in an t. Likewise, the poten tial for well-head or form ation p lu ggin g also exists wh en in jectin g large n u m bers of
n atu rally adh esive m icroorgan ism s. In th is stu dy, two
m icroorgan ism delivery p rotocols were u sed to test th e
tran sp ort p rop erties of th e adh esion -deficien t cu ltu res an d
to en su re con tact with th e con tam in an ts: (1) u p gradien t
in jection p erp en dicu lar to grou n dwater flow (trial n u m ber
1) an d (2) direct in jection of th e organ ism s th rou gh ou t th e
con tam in an t p lu m e (trial n u m ber 2). In trial n u m ber 1,
ENV435 was tran sp orted th rou gh th e aqu ifer at a rate relative
to brom ide (vBr : vENV) of on ly 1.26 in th e deep sedim en ts, an d
th e organ ism s were detected th rou gh ou t th e test p lot.
Alth ough th e in jected organ ism s were tran sp orted th rou gh ou t th e test p lot, m u ch of th e degradative activity ap p eared
to occu r n ear th e in jection wells. Th is was likely a resu lt of
th e sievin g or en trap m en t of m u ch of th e added bacteria by
aqu ifer sedim en ts an d th e dep letion of DO.
Th e direct in jection of ENV435 th rou gh ou t th e test p lot
(trial n u m ber 2) was m ore effective for distribu tin g active
biom ass an d rem ovin g VOCs th rou gh ou t th e test p lot th an
u p gradien t in jection (trial n u m ber 1) becau se it resu lted in
a m ore rap id distribu tion of th e organ ism s across th e en tire
p lot. Th u s, it was n ot n ecessary to m ain tain h igh levels of
degradative activity for an exten ded p eriod, an d th e h igh er
local cell con cen tration s resu lted in rap id degradation of
VOCs. Fu rth erm ore, oxygen lim itation s were m in im ized
becau se oxygen cou ld be added in th e im m ediate vicin ity of
VOL. 33, NO. 16, 1999 / ENVIRONM ENTAL SCIENCE & TECHNOLOGY
9
2779
�th e in jected bacteria, th ereby elim in atin g th e n eed for lon g
distan ce oxygen tran sp ort across th e p lot.
Du rin g fu ll scale ap p lication of bioau gm en tation , tran sp ort of th e catalyst m ay still be a lim itation at som e sites
becau se of th e existin g h ydrogeology (e.g., low effective
p orosity) or th e in ability to in du ce grou n dwater flow or
p rom ote m ixin g as don e in th is stu dy. However, oth er
m ech an ism s for distribu tin g m icroorgan ism s th rou gh ou t
aqu ifers are available (29, 30), an d th ey m ay redu ce th e
m easu red decay rate by m in im izin g sievin g an d rap idly
disp ersin g th e bacteria over greater distan ces. In an oth er
field-scale test of bioau gm en tation , strain ENV435 was
in jected with h igh -p ressure air directly in to a bedrock aquifer
du rin g p n eu m atic fractu rin g (30), an d th e bacteria were
distribu ted th rou gh an 8-m radiu s from th e in jection well
with in m in u tes. Th e h igh -p ressu re airflow also p rom oted
m ixin g of th e in jected cu ltu re with con tam in ated grou n dwater. Likewise, ap p lyin g th e organ ism s with m icrobu bble
foam s ap p eared to im p rove th eir tran sp ort an d distribu tion
in m odel aqu ifers (29), an d n u trien ts an d growth su bstrates
can be added to th e foam s to h elp p rolon g su rvival. Th e
p oten tial for u sin g th ese altern ative delivery tech n iqu es in
aqu ifer m aterials sim ilar to th ose en cou n tered du rin g th is
p roject h as n ot yet been tested.
On e of th e critical issu es faced wh en in jectin g large
qu an tities of aerobic m icroorgan ism s in to an aqu ifer is
satisfyin g th e oxygen dem an d of th e organ ism s an d reactive
ch em ical sp ecies in th e grou n dwater. Oxygen lim itation also
h as been en cou n tered wh en ap p lyin g oth er aerobic in situ
biotreatm en t tech n ologies (4, 5, 6). In th is work, DO
con cen tration s in th e test p lot decreased sign ifican tly after
in jectin g ENV435, an d th ey did n ot recover even after th ree
weeks of in jectin g aerated water in to th e p lot. Th is dep letion
of oxygen likely redu ced th e efficien cy of VOC degradation
by th e added strain . As seen in Figu res 4 an d 7, m ost of th e
VOC degradative activity du rin g trial n u m ber 1 occu rred n ear
th e in jection wells, an d it decreased as th e organ ism s m oved
down gradien t. Mass rem oval calcu lation s su ggested th at
about 33% of the VOC rem oval occurred between the in jection
wells an d th e m on itorin g wells located 2 m down gradien t.
If degradation con tin u ed at h igh levels, VOC con cen tration s
in th e grou n dwater sh ou ld h ave con tin u ed to declin e as th e
organ ism s an d water m oved down gradien t, as was observed
alon g th e sou th ern edge of th e test p lot (Figu re 4C).
Dissolved oxygen lim itation s were redu ced in th is stu dy
by in jectin g th e biocatalyst an d p u re oxygen th rou gh ou t th e
test p lot (trial n u m ber 2). In th is case, h igh oxygen con cen tration s (>2 m g/ L) were m ain tain ed with ou t sp argin g, an d
TCE degradation occu rred th rou gh ou t th e p lot (Figu re 8).
Likewise, th e T1:T2 ratio decreased sign ifican tly at all of th e
m on itorin g wells of th e test p lot after in jection of th e
organ ism s (Figu re 7), in dicatin g th at th e T1 com p ou n ds were
degraded th rou gh ou t th e p lot. Oth er ap p roach es for addin g
oxygen , su ch as in jectin g h ydrogen p eroxide (5), m ay also
su p p ly su fficien t oxygen in som e situ ation s, bu t th e cost an d
poten tial toxicity of the added com poun d m ust be con sidered.
Du rin g trial n u m ber 1, m ost of th e degradation in th e test
p lot occu rred with in th e first 3 to 5 m down gradien t of th e
in jection wells wh ere th e organ ism s were con cen trated an d
oxygen was m ost available. We estim ate th at at least 141 g
of VOCs were degraded du rin g trial n u m ber 1 by 38.5 kg of
ENV435. Th is rep resen ts an ap p aren t tran sform ation ratio
(g VOC/ g biom ass) of ap p roxim ately 0.004 wh ich is on ly 10%
of th e tran sform ation cap acity rep orted for p h en ol degraders
(0.031) (31), an d 45% of th ose rep orted for oth er tolu en e
degraders (0.0073) (31) in laboratory stu dies. Th e actu al in
situ tran sform ation cap acity of th e added strain s, h owever,
m ay be greater th an th at m easu red h ere. For exam p le, th e
low con cen tration s of VOCs p resen t an d lim ited oxygen
2780
9
ENVIRONM ENTAL SCIENCE & TECHNOLOGY / VOL. 33, NO. 16, 1999
availability m ay h ave p reven ted an accu rate assessm en t of
th e am ou n t of VOCs th at cou ld be degraded by th e organ ism s
u n der differen t con dition s.
Two of th e m ost attractive ch aracteristics of th e bioau gm en tation ap p roach dem on strated h ere are (1) th at it can
resu lt in rap id degradation of VOCs an d (2) it can be ap p lied
over wide areas an d/ or targeted directly toward th e sou rce
of con tam in ation . By com parison , biostim ulation approaches
can requ ire several m on th s of ap p lication before su fficien t
degradation is ach ieved (4, 5), an d dep en din g on h ow th ey
are ap p lied, th ey can requ ire in situ tran sp ort of th e
con tam in an ts to a treatm en t zon e (5) n ot u n like p u m p an d
treat ap p roach es. Th u s, th e resu lts of th is work dem on strate
a tech n ology th at can be ap p lied at sites wh ere th e h ydrogeological con dition s an d access are favorable an d rap id
treatm en t TCE, DCE, an d/ or VC is desired.
Acknowledgments
Th is work was su p p orted by a Sm all Bu sin ess In n ovative
Research con tract No. FO863795C6007 from th e U.S. Air
Force. We th an k Alison Ligh tn er of th e Air Force Research
Laboratory at Tyn dall Air Force Base for h er p rogram
m an agem en t an d oversigh t, William Gu arin i for p rogram
adm in istration at En virogen , In c., an d Mary DeFlau n , Pau l
Hatzin ger, an d Ron ald Un term an for reviewin g th e m an u scrip t. We are in debted to Allen Th om as, Jam ie Lath am , an d
George Pfeiffer for th eir an alytical work, Sh eryl Streger for
selectin g adh esion deficien t varian ts, an d Graig Lavorgn a
for sam p lin g an d data m an agem en t.
Literature Cited
(1) Westrick, J. J.; Mello, J. W.; Th om as, R. F. J. Am . Wa ter Works
Assoc. 1984, 76, 52-59.
(2) Major, D. W.; Hodgin s, E. W.; Bu tler, B. J. In On Site Biorecla m a tion : Processes for Xen obiotic a n d Hydroca rbon Trea tm en t;
Hin ch ee, R. E., Olfen bu ttel, R. G., Eds.; Bu tterworth -Hein em an n : Boston , 1991; p p 147-171.
(3) Yager, R. M.; Bilotta, S. E.; Man n , C. L.; Madsen , E. L. En viron .
Sci. Tech n ol. 1997, 31, 3138-3147.
(4) Hazen , T. C.; Lom bard, K. H.; Loon ey, B. B.; En zien , M. V.;
Dou gh erty, J. M.; Flierm an s, C. B.; Wear, J.; Eddy-Dilek, C. A.
In In Situ Rem edia tion : Scien tific Ba sis for Cu rren t a n d Fu tu re
Tech n ologies; Gee, G. W., Win g, N. R., Eds.; Battelle Press:
Rich lan d, WA, 1994; p p 137-150.
(5) McCarty, P. L.; Goltz, M. N.; Hop kin s, G. D.; Dolan , M. E.; Allan ,
J. P.; Kawakam i, B. T.; Carroth ers, T. J. En viron . Sci. Tech n ol.
1998, 32, 88-100.
(6) Kru m m e, M. L.; Tim m is, K. H.; Dwyer, D. F. Appl. En viron .
Microbiol. 1993, 59, 2746-2749.
(7) Sem p rin i, L.; McCarty, P. L. Grou n dwa ter 1992, 30, 37-44.
(8) Mu n akata-Marr, J.; McCarty, P. L.; Sh ields, M. S.; Reagin , M.;
Fran cescon i, S. En viron . Sci. Tech n ol. 1996, 30, 2045-2052.
(9) Nelson , M. J.; Kin sella, J. V.; Mon toya, T. En viron . Progr. 1990,
9, 190-196.
(10) Du ba, A. G.; Jackson , K. J.; Jovan ovich , M. C.; Kn ap p , R. B.;
Taylor, R. T. En viron . Sci. Tech n ol. 1996, 30, 1982-1989.
(11) DeFlau n , M. F.; Op p en h eim er, S. R.; Streger, S.; Con dee, C. W.;
Fletch er, M. Appl. En viron . Microbiol. 1999, 65 759-765.
(12) DeFlau n , M. F.; Tan zer, A. S.; McAteer, A. L.; Marsh all, B.; Levy,
S. B. Appl. En viron . Microbiol. 1990, 56, 112-119.
(13) Koch , A. L. In Meth ods for Gen era l a n d Molecu la r Ba cteriology;
Gerh ardt, P., Mu rray, R. G. E., Wood, W. A., Krieg, N. R., Eds.;
Am erican Society for Microbiology: Wash in gton , DC, 1994; p p
248-278.
(14) Harelan d, W.; Crawford, R. L.; Ch ap m an , P. J.; Dagley, S. J.
Ba cteriol. 1975, 121, 272-285.
(15) McClay, K.; Streger, S. H.; Steffan , R. J. Appl. En viron . Microbiol.
1995, 61, 3479-3481.
(16) Lageveen , R. G.; Hu ism an , G. W.; Preu stin g, H.; Ketelaar, P.;
Eggn ik, G.; With olt, B. Appl. En viron . Microbiol. 1988, 54, 29242932.
(17) Test Meth ods for Eva lu a tin g Solid Wa ste, Ph ysica l/Ch em ica l
Methods (SW-846). U.S. En viron m en tal Protection Agen cy, Office
of Solid Waste an d Em ergen cy Respon se: Washin gton , DC, 1986.
�(18) ASTM Sta n da rds on An a lysis of Hydrologic Pa ra m eters a n d
Grou n dwa ter Modelin g; Am erican Society of Testin g an d
Materials: West Con sh oh ocken , PA, 1996. ASTM Pu blication
Code No. PCN 03-418096-38.
(19) Loh m an , S. W. Grou n dwa ter Hydra u lics; U.S. Geological Su rvey
Prof. Pap er #708, 1972.
(20) Coop er, H. H.; Jacob, C. E. Tra n s. Am . Geoph ys. Un ion 1946, 27,
526-534.
(21) Moen ch , A. F. Wa ter Resou r. Res. 1989, 25, 439-447.
(22) Massol-Deya, A.; Weller, R.; Rios-Hern adez, L.; Zh ou , J.-Z.;
Hickey, R. F.; Tiedje, J. M. Appl. En viron . Microbiol. 1997, 63,
270-276.
(23) Mars, A. E.; Prin s, G. T.; Wietzes, P.; de Kon ig, W.; Jan ssen , D.
B. Appl. En viron . Microbiol. 1998, 64, 208-215.
(24) Alvarez-Coh en , L.; McCarty, P. L. Appl. En viron . Microbiol.
1991, 57, 1031-1037.
(25) Wackett, L. P.; Hou seh old er, S. R. Appl. En viron . Microbiol.
1989, 55, 2723-2725.
(26) Ch u , K.-H.; Alvarez-Coh en , L. Appl. En viron . Microbiol. 1998,
64, 3451-3457.
(27) Hen ry, S. M.; Grbic-Galic, D. Appl. En viron . Microbiol. 1991,
57, 236-244.
(28) Hen rysson , T.; McCarty, P. L. Appl. En viron . Microbiol. 1993,
59, 1602-1606.
(29) Roth m el, R. K.; Peters, R. W.; St. Martin , E.; DeFlau n , M. F.
En viron . Sci. Tech n ol. 1998, 32, 1667-1675.
(30) Walsh , M.; Bolan d, T.; Liskowitz, J.; DeFlau n , M.; Steffan , R. J.
Rem ediation of a low p erm eability TCE con tam in ated siltston e
bedrock, p art 2. Pn eu m atic In jection of con stitu tive TCEdegradin g organ ism s. ASCE Sp ecial Volu m e on Rem ediation in
Rock Masses, in p ress.
(31) Ch an g, H.-L.; Alvarez-Coh en , L. En viron . Sci. Tech n ol. 1995, 29,
2357-2367.
Received for review Novem ber 24, 1998. Revised m a n u script
received April 22, 1999. Accepted Ju n e 7, 1999.
ES9812204
VOL. 33, NO. 16, 1999 / ENVIRONM ENTAL SCIENCE & TECHNOLOGY
9
2781
�
 Simon Vainberg