TYPE
Original Research
20 December 2022
10.3389/fnut.2022.1028261
PUBLISHED
DOI
OPEN ACCESS
EDITED BY
Susana Jiménez-Murcia,
Bellvitge University Hospital, Spain
REVIEWED BY
Michael R. Lowe,
Drexel University, United States
Nuria Vilarrasa,
Bellvitge University Hospital, Spain
*CORRESPONDENCE
Albino J. Oliveira-Maia
albino.maia@neuro.fchampalimaud.org
† PRESENT ADDRESSES
Gabriela Ribeiro,
Nutrition and Metabolism, NOVA
Medical School, Faculdade de Ciências
Médicas, NMS, FCM, Universidade
NOVA de Lisboa, Lisbon, Portugal
Marta Camacho,
John van Geest Centre for Brain
Repair, Department of Clinical
Neurosciences, University of
Cambridge, Cambridge,
United Kingdom
Enhanced sweet taste
perception in obesity: Joint
analysis of gustatory data from
multiple studies
Gabriela Ribeiro1,2† , Sandra Torres3,4 , Ana B. Fernandes1,5 ,
Marta Camacho1† , Teresa L. Branco6 , Sandra S. Martins7,8 ,
Armando Raimundo9,10 and Albino J. Oliveira-Maia1,5*
Food Reward in Bariatric Surgery Portuguese Study Group1‡
Champalimaud Research and Clinical Centre, Champalimaud Foundation, Lisbon, Portugal,
Lisbon Academic Medical Centre PhD Program, Faculdade de Medicina da Universidade de Lisboa,
Lisbon, Portugal, 3 Faculdade de Psicologia e de Ciências da Educação, Universidade do Porto,
Porto, Portugal, 4 Centro de Psicologia da Universidade do Porto, Porto, Portugal, 5 NOVA Medical
School, Faculdade de Ciências Médicas, NMS, FCM, Universidade NOVA de Lisboa, Lisbon, Portugal,
6
Exercise and Health Laboratory, CIPER, Faculdade de Medicina da Universidade de Lisboa, Cruz
Quebrada, Portugal, 7 Universidade Europeia, Lisbon, Portugal, 8 Instituto de Saúde Ambiental
(ISAMB), Faculdade de Medicina da Universidade de Lisboa, Lisbon, Portugal, 9 Departamento
de Desporto e Saúde, Escola de Saúde e Desenvolvimento Humano, Universidade de Évora, Évora,
Portugal, 10 Comprehensive Health Research Centre (CHRC), Universidade de Évora, Évora, Portugal
1
2
‡ Food
Reward in Bariatric Surgery
Portuguese Study Group is listed
in Supplementary Appendix 1
SPECIALTY SECTION
This article was submitted to
Nutrition, Psychology and
Brain Health,
a section of the journal
Frontiers in Nutrition
RECEIVED 25
August 2022
November 2022
PUBLISHED 20 December 2022
ACCEPTED 23
CITATION
Ribeiro G, Torres S, Fernandes AB,
Camacho M, Branco TL, Martins SS,
Raimundo A and Oliveira-Maia AJ
(2022) Enhanced sweet taste
perception in obesity: Joint analysis
of gustatory data from multiple
studies.
Front. Nutr. 9:1028261.
doi: 10.3389/fnut.2022.1028261
Frontiers in Nutrition
Introduction: While sweet taste perception
feeding behavior in obesity, the supporting
is typically associated with methodological
associations between sweet taste perception
remain undetermined.
is a potential determinant of
evidence is inconsistent and
limitations. Notably, possible
and measures of food reward
Materials and methods: We conducted a cross-sectional analysis comparing
246 individuals with severe obesity and 174 healthy volunteers using a
validated method for taste perception assessment. We included gustatory
variables, namely intensity and pleasantness ratings of sour, salt, sweet, and
bitter tastants, and taste thresholds assessed by electrogustometry. Rewardrelated feeding behavior, including hedonic hunger, food addiction, feeding
behavior traits, and acceptance of foods and alcohol, was evaluated using
self-rated scales for comparison with gustatory measures.
Result: In logistic regressions adjusted for age, gender, educational level, and
research center, we found that a greater likelihood of belonging to the obesity
group was associated with higher sweet intensity ratings (OR = 1.4, P = 0.01),
hedonic hunger, food addiction symptoms, restrained and emotional eating
(1.7 < OR ≤ 4.6, all P ≤ 0.001), and lower alcohol acceptance (OR = 0.6,
P = 0.0002). Using principal component analysis, we found that while hedonic
hunger, food addiction, and emotional eating were strongly interrelated, they
were not associated with sweet intensity perception that, in turn, had a closer
relationship with alcohol acceptance and restrained eating.
01
frontiersin.org
Ribeiro et al.
10.3389/fnut.2022.1028261
Conclusion: We found that individuals with obesity report higher
sweet taste intensity ratings than healthy controls. Furthermore, while
psychological measures of reward-related feeding behavior assess a
common construct, sweet intensity perception may represent a different
obesity-related dimension.
KEYWORDS
obesity, sweet taste, taste perception, gustation, food reward, hedonic hunger,
reward-related feeding behavior
Introduction
hedonic (i.e., conscious, and subjective liking/pleasantness)
responses (13, 14).
Obesity is a global and complex health concern (1, 2),
with increasing prevalence (3, 4) and severe socio-economic
repercussions (1, 2, 5, 6). The high availability of foods rich in
sugar or fat is implicated in the obesity epidemic (1, 7, 8). Sugar,
via its pre- and post-ingestive value (9–12), acts in brain reward
circuitries, inducing food preferences (10, 12) and food-seeking
behaviors (11).
Ingestive behavior is multifactorial, aggregating several
appetitive processes such as incentive motivation, “wanting,”
“liking,” and reinforcement learning, with underlying
neurobiology that is not fully overlapping (13, 14). Additionally,
terms like “liking” are frequently used interchangeably with
“preference,” although they are tested using distinct behavioral
paradigms and reflect fairly distinct concepts. “Liking” is
typically a self-reported perceptual experience obtained from
ratings of how pleasant or unpleasant a stimulus is, according
to a standard scale (13–15). For reference, perception occurs
when sensory signals (e.g., sweet stimulus) are interpreted
and integrated into the central nervous system to produce a
conscious experience, such as a liking or pleasantness perception
(16). On the other side, preference is commonly determined
by a choice between two or more alternatives, classically
with a procedure to track choice for, and/or consumption of,
the several stimuli (i.e., tastant, food, or beverage) (13–15).
Preference and liking are not necessarily overlapping constructs.
Indeed, others have argued that, when exposed to a series of
beverages with increasing sweetness, the individuals that prefer
the sweetest beverage do not necessarily perceive sweetness
as more pleasurable, and participants preferring less sweet
beverages may actually have higher liking ratings across the
several options. Furthermore, variability in preference for
different levels of sweetness does not result necessarily from
intensity coding of taste, which is a factor of neural responses to
tastants, that increase with stimulus concentration and correlate
with perceived taste intensity (17). Thus, behavioral preferences
for sensations elicited by greater sweetness, which is a proxy
for higher energy densities, do not necessarily reflect increased
The literature about taste perception in human obesity has
been predominantly focused on liking for appetitive tastants.
While the view that individuals with obesity like sweet taste
more than normal weight individuals is still prevailing (14),
previous work on sweet taste perception and obesity (13, 14,
18) has led to inconsistent findings (19). For example, some
studies that used direct measures of taste, including appetitive
(sweet) and non-appetitive (salt, sour, and bitter) tastants,
to compare individuals with obesity with non-obese controls,
reported absent associations between several taste perception
parameters and obesity (20–24). In contrast, others found either
negative (25–27) or positive (28–30) associations, including
for sweet taste (28, 30, 31). Furthermore, there was significant
methodological heterogeneity across studies (19, 32), including
for stimuli type and gustatory outcomes (19). For example, sweet
taste outcomes varied from intensity and pleasantness ratings
using several distinct scales (e.g., 9-point scale, visual analogue
scales, and general labelled magnitude scales), to detection and
recognition thresholds, as well as the “preferred concentration”
(19). For sweet pleasantness and intensity ratings, early studies
did not find consistent obesity-dependent differences for
intensity ratings, with one study suggesting that individuals with
obesity rated higher concentrations of sweet as more pleasant
(28), and another study suggesting that individuals with obesity
rated higher concentrations of sucrose as less pleasant (25). In
another study, adolescents with obesity rated sweet and salty
tastants as more intense, and also rated the lowest NaCl solution
as less pleasant, with no pleasantness differences for sucrose
(29). In a more recent study, individuals with obesity rated the
lower concentrations of sucrose, NaCl and citric acid as more
intense, and one of the higher concentrations of sucrose as more
pleasant, relative to normal weight participants (31). Several
other studies did not find differences in neither pleasantness nor
intensity ratings (20, 21, 24, 30).
Across these studies there are other limitations (19), such
as small sample sizes, general lack of a control group in
longitudinal studies (19), and a general absence of feeding
Frontiers in Nutrition
02
frontiersin.org
Ribeiro et al.
10.3389/fnut.2022.1028261
behavior-related correlates. These factors haltered an adequate
estimation of taste perception contribution toward obesity. We
recently demonstrated that sweet intensity perception predicted
weight loss following bariatric surgery in over 200 patients
(33). Although surgery did not induce a generalized change in
taste perception, baseline sweet intensity ratings were positive
predictors of weight loss 18 months after surgery. Also, patients
that decreased intensity ratings for sweet stimuli lost more
weight (33). Steele and colleagues also showed that taste-related
reward processing predicted weight loss at 6 months for gastric
bypass but not sleeve gastrectomy patients (34). However, tasterelated reward processing induced by gastric bypass changes
may be temporary and dependent upon post-operative eating
behaviors (35). It is thus necessary to better characterize rewardrelated feeding behavior in obesity, including gustation and
obesogenic behaviors. Here we hypothesized that altered sweet
taste perception (i.e., intensity and pleasantness) is associated
with obesity. To address this hypothesis, while avoiding the
previous limitations, we included a large group of individuals
with obesity and a group of healthy volunteers as controls.
In exploratory analyses, we tested if sweet taste perception
was associated with psychometric measures of reward-related
feeding behavior.
both assessed before and after the weight-loss intervention.
In addition, healthy individuals were recruited from the
community by the two research centers involved in the study,
namely Champalimaud Research and Clinical Centre (Lisbon,
Portugal) and Faculdade de Psicologia e Ciências Educação
da Universidade do Porto (Porto, Portugal). All groups had
equivalent exclusion criteria, including active acute respiratory
infection, active neurological or psychiatric disease, active
gastrointestinal, hepatic or pancreatic disease, illicit substance
use or alcohol abuse, illiteracy or inability to understand
the study’s instructions, prior major gastrointestinal surgery,
intra-gastric balloon in the previous 12 months, history of
food allergies and pregnancy or breastfeeding. In healthy
controls, diabetes and obesity (defined as body mass index–
BMI ≥ 30 Kg/m2 ) were additional exclusion criteria. The study
followed the principles of the Declaration of Helsinki and
was approved by local Ethics Committees at each participating
institution. Written informed consent was obtained from
all participants.
Measures
The study protocol included a health questionnaire,
followed by measurements of weight and height obtained with
digital scales and stadiometers (Seca, Hamburg, Germany). The
BMI was calculated as weight in kilograms divided by height
in meters squared.
The taste strips test used in this study follows a validated
and published protocol [Landis et al. (36)]. Since the taste
strips were produced in house and considering the high
methodological variability in gustatory measures, we validated
our in-house taste strips test, determining temporal reliability
and agreement with a commercially available version. The
result of this methodological sub-study is described in
Supplementary Information.
The gustatory test consisted of taste strips (i.e., filter
paper) impregnated with a solution of one of the four basic
tastants, namely citric acid (sour), sodium chloride (salt),
sucrose (sweet), or quinine hydrochloride (bitter), or deionized
water (details on the taste strips preparation are described in
Supplementary Methods). The taste test follows a standardized
protocol in which each tastant is presented in four increasing
concentrations (36), in randomized order, except for quinine,
which was always presented last. Following stimulation with
each strip, subjects were asked to rate each tastant regarding
intensity and pleasantness.
Intensity was rated using 100 mm vertical line general
Labeled Magnitude Scale (gLMS) (37) ranging from 0 (labeled
“without any sensation”) to 100 (labeled “the strongest sensation
that I can imagine”) with five intermediate labeled levels (i.e.,
“barely detectable,” “weak,” “moderate,” “strong,” and “very
strong”) (37). It was explained that this could refer to all
Materials and methods
We conducted a cross-sectional analysis to compare a group
of individuals with obesity (obesity group), including prebariatric patients (33) and participants of “Peso Pesado” (the
equivalent to “The Biggest Loser” in Portugal), with healthy
volunteers (healthy group). All groups had data regarding
height, weight, and gustatory variables, including acuity in taste
identification, intensity, and pleasantness ratings given to basic
tastants (i.e., sour, salt, sucrose, and bitter) and taste detection
thresholds. In addition, all groups except the “The Biggest Loser”
participants had self-rated psychometric scales of reward-related
feeding behavior.
Study design and participants
The recruitment of bariatric surgery candidates took place
consecutively at three tertiary care outpatient centers specialized
in the surgical treatment of obesity in Portugal (Hospital do
Espírito Santo EPE, Évora; Hospital de São Bernardo, EPE,
Setúbal; Centro Hospitalar Universitário de São João EPE,
Porto). The cohort included patients approved for bariatric
surgery following the Portuguese National Health Service
criteria. We collected data from this cohort for longitudinal
purposes (Trial registration number: ISRCTN59323751), as
previously described (22). “The Biggest Loser” subgroup was
recruited from two seasons in Portugal (2011 and 2012),
Frontiers in Nutrition
03
frontiersin.org
Ribeiro et al.
10.3389/fnut.2022.1028261
kind of sensations, including pain. The pleasantness general
Labeled Hedonic Scale (gLHS) (38) was a 200 mm vertical
line scale, corresponding to a range of negative (−100, labeled
“most unpleasant sensation that I can imagine”), neutral (0,
labeled “neutral”) and positive (100, labeled “most pleasant
sensation that I can imagine”) assessments, including eight other
intermediate labels (i.e., four positive descriptors–“like slightly,”
“like moderately,” “like very much,” “like extremely,” and
four negative descriptors–“dislike slightly,” “dislike moderately,”
“dislike very much,” “dislike extremely”) (38). Participants were
instructed to rate the tastants in the context of the broadest
possible range of pleasure and displeasure they experienced
previously. Finally, participants were asked to identify the taste
quality of that strip from a list of descriptors in a 5-alternative
forced-choice test.
The primary outcomes of the gustatory protocol were
mean intensity and pleasantness ratings given to the four
concentrations of each tastant. Taste acuity was calculated as the
mean number of correctly identified taste qualities in each trial
(0 to 16). Finally, individual taste thresholds were assessed with
electrogustometry (EGM) (39) using a commercially available
electrogustometer (Rion TR-06; Rion Co. Ltd., Tokyo, Japan).
Further details about methods were previously reported (19).
Reward-related feeding behavior was assessed using
psychometric self-rated scales. We used the Power of Food Scale
(PFS) (40, 41) and the Yale Food Addiction Scale (YFAS) (42),
previously validated for the adult Portuguese population by
our group (43–45). The PFS assesses hedonic hunger (i.e., the
motivation to obtain food even in the absence of energy needs)
and comprises three subscales that reflect increasing proximity
to food stimuli (i.e., PFS-Food Available, PFS-Food Present,
and PFS-Food Tasted) (40, 41). The Yale Food Addiction Scale
(YFAS) assessed addiction-like feeding behavior (42) with
a continuous score (number of symptoms, from 0 to 7) or
diagnosis score. Furthermore, we used the Portuguese version
of the Dutch Eating Behavior Questionnaire (DEBQ) (46, 47) to
evaluate feeding behavior traits: emotional eating and restrained
eating. Acceptance for food (fruits, vegetables, dairy, meat,
fried, sauces, carbs, sweets) and alcohol was determined using
the Food Action Rating Scale (FARS) (48).
Our main analyses aimed to determine the effects of
gustatory and psychometric variables on the likelihood of
obesity. For unadjusted comparisons between groups, an
independent-samples t-test or chi-squared test (χ2 ) was used,
as appropriate. Cohen’s d (d) for the effect size of group
differences was calculated as the mean difference between
the two groups, divided by the pooled standard deviation.
The primary analyses were multivariable logistic regressions
while adjusting for confounders on taste perception or
obesity, namely age, gender, and education (24, 36). Although
standardized protocols across samples were used, the research
center was added to the model to control any possible bias.
Continuous independent variables of interest (EGM taste
thresholds, taste acuity, intensity, and pleasantness ratings,
PFS, YFAS, DEBQ, FARS scores, and age) were treated
as z-scores allowing ORs to be compared between models.
Nagelkerke’s R2 was assessed as a measure of effect size. We
tested multicollinearity between independent variables in the
model and inspected Cook’s distance to check the influence
of outliers. We also examined the variable variance. Since
there were no Food Addiction (diagnosis score) cases in the
healthy group, we did not test this variable in multivariable
logistic regressions.
We performed correction for multiple comparisons for
the primary analyses (multivariable logistic regressions)
within the pre-specified primary independent variables: mean
sweet intensity and mean sweet pleasantness ratings; and
within each group of variables: intensity ratings; pleasantness
ratings; other taste assessment variables; hedonic hunger
scores; food addiction; feeding behavior traits (DEBQ
scores); Food Acceptance (FARS scores). The corrections
for multiple comparisons were calculated according to
Benjamini-Hochberg (49), assuming a false discovery rate
(FDR) of 0.1. At an exploratory level, RM two-way ANOVAs
with the Geisser Greenhouse correction were computed to
compare the obesity and healthy groups for intensity and
pleasantness ratings across tastants’ concentrations. Post-hoc
Bonferroni multiple comparison tests were then computed for
each ANOVA.
Principal Component Analysis (PCA) was used to explore
associations between sweet taste perception and reward-related
feeding behavior. After determining which variables were
associated with obesity in multivariable logistic regressions
adjusted for age, gender, and education, those variables were
tested in a PCA with the joint sample, including all individuals
with valid measures. With this analysis we aimed to determine
how the variables associated with obesity would cluster in a
multidimensional space and, specifically, if they reflected a
single unitary component, or multiple separate components
in the PCA space. The PCA’s suitability was tested by analyzing
the overall Kaiser-Meyer-Olkin (KMO) measure and Bartlett’s
test of sphericity. A Varimax orthogonal rotation was performed
for interpretability.
Statistical analysis
Categorical variables are represented as percentages, and
continuous variables as mean and standard deviation (SD).
A two-tailed p-value of 0.05 was selected as the significance level
for all analyses. Statistical analyses were performed using SPSS
version 26 (SPSS Inc., Chicago, IL, USA) and GraphPad Prism
version 8.0 (GraphPad Software, La Jolla, CA, USA). Graphs
were edited in Adobe Illustrator version CC 2019 (Adobe Inc.,
San Jose, CA, USA).
R
Frontiers in Nutrition
04
frontiersin.org
Ribeiro et al.
10.3389/fnut.2022.1028261
TABLE 1 Demographic characteristics of the study groups.
Characteristic
Obesity
N = 246
Healthy
N = 174
P-value1
Cohen’s d2
<0.0001
1.0
0.02
N/A
Mean, SD or no. (%)
Age, years
41.0 (11.2)
31.2 (9.2)
Women
201 (81.7%)
126 (72.4%)
Education, years
10.5 (4.1)
14.2 (3.8)
<0.0001
T2DM
42 (17.1%)
0 (0%)
<0.0001
N/A
Smokers
58 (23.6%)
28 (16.1%)
0.1
N/A
BMI, Kg/m2
42.4 (5.4)
23.2 (2.7)
<0.0001
4.5
−0.9
1 Independent-samples t-test was performed for continuous variables and chi-square test for categorical variables.
2 Cohen’s d was determined by calculating the mean difference between the obesity and healthy groups and dividing the result by the pooled standard deviations.
BMI, body mass index; T2DM, personal history of type 2 diabetes mellitus.
Results
Reward-related gustatory and
psychometric variables associated with
obesity
Individuals in the obesity group (N = 246) were older
(P < 0.0001, d = 1.0), had fewer years of formal education
(P < 0.0001; d = −0.9) and had higher BMI (P < 0.0001;
d = 4.5) when compared with the healthy group (N = 174;
Table 1). In addition, the frequency of women was higher
in the obesity group (P = 0.02), as was the frequency of
T2DM (P < 0.0001), while the distribution of smokers was
similar across groups (P = 0.1). Within the obesity group, prebariatric patients (N = 212) were older (P < 0.0001, d = 1.6),
had a higher percentage of women (P = 0.01) and had a
lower educational level (P = 0.02; d = −0.4) when compared
with “The biggest loser” subgroup (N = 34; Supplementary
Table 1). One pre-bariatric patient was under GLP-1 analogue
treatment (Liraglutide, Victoza ). Sensitivity analyses showed
that exclusion of this case does not impact our results (data not
shown).
Our primary hypothesis was that sweet taste perception is
associated with obesity. We thus performed logistic regressions
to assess the likelihood of belonging to the obesity group
according to gustatory and psychometric variables when
adjusting for age, gender, education, and research center. Of
the gustatory variables tested, only sweet intensity ratings were
associated with the obesity group (OR: 1.4, CI 95%: 1.1–1.9,
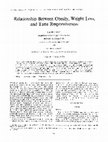
P = 0.01), as shown in Figure 1 (please see Supplementary
Table 2 for details). However, we did not find such association
for hedonic ratings (i.e., sweet pleasantness), (OR: 1.2, CI 95%:
0.9–1.5, P = 0.2).
Since we used the average sweet intensity ratings of the four
sucrose concentrations in this analysis, we explored whether this
result reflected differences in specific concentrations. Indeed,
we found differences between the obesity and healthy groups
FIGURE 1
Odds ratio and 95% confidence intervals of gustatory and
psychometric variables that were significantly associated with
the obesity group. Models were adjusted for age, gender,
education level, and research center. Independent variables
were standardized to Z-scores for effect size comparison.
N = 396. PFS, Power of Food Scale; YFAS, Yale Food Addiction
Scale; DEBQ, Dutch Eating Behavior Questionnaire; FARS, Food
Action Rating Scale.
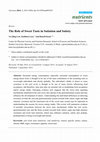
for sweet intensity ratings but not for intensity or pleasantness
ratings of the remaining tastants (Figures 2A–H), using
RM two-way ANOVA. Furthermore, Bonferroni’s multiple
comparison tests showed higher intensity ratings in the obesity
group for 5, 10, and 20% sucrose (all P ≤ 0.05), but not for 40%
sucrose (P = 0.2; Figure 2C).
Of the psychometric variables tested, those that were
significantly associated with the likelihood of belonging to
the obesity group were increased hedonic hunger (PFS–Food
Available; OR: 1.7, CI 95%: 1.3–2.4, P = 0.001), increased
number of addiction-like feeding behavior symptoms (YFAS–
No. of symptoms; OR: 4.6, CI 95%: 2.8–7.6, P < 0.0001) and
higher restrained eating (DEBQ–Restrained Eating; OR: 3.0, CI
95%: 2.1–4.2, P < 0.0001) as well emotional eating (DEBQ–
Emotional Eating; OR: 1.8, CI 95%: 1.3–2.5, P = 0.001; Figure 1
and Supplementary Table 2). Conversely, alcohol acceptance
was associated with a decreased likelihood of belonging to
the obesity group (FARS-Alcohol; OR: 0.6, CI 95%: 0.4–
0.8, P = 0.0002). Results of the previously described models
R
Frontiers in Nutrition
05
frontiersin.org
Ribeiro et al.
10.3389/fnut.2022.1028261
FIGURE 2
(A–H) Comparison of intensity and pleasantness ratings across tastants’ concentrations between obesity and healthy groups. Graphs represent
means and 95% CI. Repeated measures two-way ANOVA with the Geisser Greenhouse correction and Bonferroni’s multiple comparison’s test
were computed for each comparison. ns: P > 0.05; **P ≤ 0.01; and ****P ≤ 0.0001; Obesity, N = 230; and Healthy, N = 166. gLMS, general
Labeled Magnitude Scale; gLHS, general Labeled Hedonic Scale.
Frontiers in Nutrition
06
frontiersin.org
Ribeiro et al.
10.3389/fnut.2022.1028261
remained significant after adjustment for multiple comparisons.
Since the independent variables were standardized to Z-scores,
the differences in effect size can be directly compared. Thus,
the smallest differences were found in alcohol acceptance, sweet
intensity perception, hedonic hunger, and emotional eating,
followed by restrained eating and food addiction. Finally, in
most logistic regression models, males had lower odds of
belonging to the obesity group than females. Increasing age and
lower education levels were also associated with an increased
likelihood of belonging to the obesity group.
In agreement with our hypothesis, we found altered sweet
taste perception in a sample of participants with obesity,
specifically, increased sweet intensity ratings. This result was
found across three of the four sucrose concentrations tested,
showing consistent differences between obesity and healthy
groups across sweet stimuli. However, no differences were found
for sour, salt, or bitter tastants, suggesting specificity for sweet
taste. Within the latter, we found differences in intensity but
not hedonic ratings for sweet. A few studies corroborate that
individuals with obesity perceive sweetness more intensely when
compared with healthy individuals (29, 31). In a smaller sample,
others showed that individuals with obesity, compared to nonobese subjects, had higher perceived intensity for the lower
concentrations of sucrose (31) and lower thresholds for sucrose.
However, this was also observed for salt and sour. In another
study, adolescents with severe obesity showed higher perceived
intensities at supra-threshold levels for sucrose and salt, along
with lower recognition thresholds (higher sensitivity) to sucrose
and sodium chloride relative to non-obese adolescents (29).
Contrary to our results, some studies found group
differences in pleasantness rather than intensity (19). For
example, Rodin et al. (28) showed that individuals with obesity
or mild overweight rated higher concentrations of sweet as
more pleasant relative to normal weight participants, using 9point intensity and liking scales, in a sip-and-taste without
swallowing method with glucose at 0.125–3 M. Others have
reported results in the opposite direction, with individuals with
obesity rating higher concentrations of sucrose as less pleasant
than normal-weight controls using liking −4 to 4-point scales,
also in a sip-and-taste without swallowing method, but with
sucrose at 1.95–19.5% (w/v) (25). In this case, differences in
intensity perception were also not found, using a magnitude
estimation method (25). Similarly, group differences were not
found in other studies using magnitude estimation in a sipand-taste without swallowing method for intensity (21) or
intensity and pleasantness estimation (20). Several factors may
have determined variability in results relative to prior research,
mainly methodological differences (19).
Enhanced sweet taste perception raises the possibility of
increased central or peripheral sensitivity to sweet stimuli or
learned associations with post-ingestive feedback of sugars in
obesity. Wang et al. (50) compared individuals with severe
obesity and non-obese controls using PET with 2-deoxy-2[18 F]
fluoro-D-glucose (FDG) to measure regional brain glucose
metabolism, a proxy for neuronal activity. This study found
increased activity in regions of the somatosensory cortex that
process sensation to the mouth, lips, and tongue of individuals
with obesity (50), supporting that individuals with obesity may
have enhanced sensory sensitivity that contributes to their
vulnerability to the reinforcing properties of food.
Since sweet intensity is a proxy for sugar concentration
(24), enhanced sweet intensity can also reflect a learned
preference for calories from simple carbohydrates. Indeed,
Clusters of gustatory and
reward-related feeding behavior
variables
After determining which variables were significantly
associated with obesity, we aimed to test if sweet taste
perception was related to measures of self-rated reward-related
feeding behavior. We conducted a PCA with the variables
associated with obesity (i.e., sweet intensity, hedonic hunger,
food addiction, restrained and emotional eating, and acceptance
of alcohol) in all individuals with valid measures (N = 280;
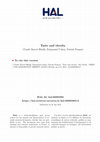
Figure 3). Inspection of the correlation matrix showed that
all variables had at least one correlation coefficient greater
than 0.3 (data not shown). The overall KMO measure was
0.7, and Bartlett’s test of sphericity was statistically significant
(P < 0.001), indicating that the data was factorizable. The PCA
revealed two components with eigenvalues greater than one,
and visual inspection of the scree plot (Figure 3A) indicated
that the two components should be retained. Given that a
two-component solution met the interpretability criterion,
these components were retained (Figure 3B). This solution
explained 57.7% of the total variance, with the first component
explaining 37.7%. The latter included hedonic hunger (PFS–
Food Available), food addiction (YFAS–No. of symptoms), as
well as emotional eating (DEBQ–Emotional Eating). The second
component explained 20% of the total variance and comprised
sweet intensity perception, restrained eating (DEBQ–Restrained
Eating), and acceptance of alcohol (FARS–Alcohol), as shown
in Figure 3B.
Discussion
The present study showed that sweet intensity perception
is enhanced in obesity while addressing several limitations of
previous research, namely the inclusion of a large sample size,
a control group and adjustment for confounding variables.
Furthermore, we found that sweet intensity perception varies
independently of reward-related feeding behavior. Instead, it
is inversely associated with alcohol acceptance and moderately
associated with increased cognitive restraint of eating.
Frontiers in Nutrition
07
frontiersin.org
Ribeiro et al.
10.3389/fnut.2022.1028261
FIGURE 3
Scree plot (A) and rotated structure matrix (B) for principal component analysis of gustatory and psychometric variables associated with the
obesity group, conducted in the joint sample. Method: Varimax with Kaizer normalization. Major loadings for each loading were kept. Loadings
lower than 0.30 were suppressed. The principal component analysis was run with six variables that were previously associated with the obesity
group, namely, sweet intensity, hedonic hunger (Power of Food Scale - Food Available), food addiction (Yale Food Addiction Scale - No. of
Symptoms), restrained and emotional eating (Dutch Eating Behavior Questionnaire) and acceptance for alcohol (Food Action Rating Scale).
N = 280.
there is pre-clinical evidence that preference for sugar is
developed even in rodents that lack sweet taste receptors,
showing a post-ingestive mechanism independent of taste (10).
Post-ingestive reward has since been demonstrated through a
direct infusion of sugar to the stomach (11), leading to foodseeking with associated increased activity of VTA dopamine
neurons (11). Accordingly, healthy individuals develop small
increases in preference for flavors paired with calories from
carbohydrates (51), and metabolic response to carbohydrates
is most significant when sweetness and caloric load are
matched (52). Further evidence in healthy humans showed
immediate and delayed dopamine release after a milkshake
consumption in distinct brain areas, interpreted as dopamine
release induced by orosensory and post-ingestive stimulation
(53). These results indicate that post-ingestive signals may
be primary for generating a reward response to sugars and
supporting a potential role in for taste perception. Indeed it is
known that sweet taste perception is influenced by peripheral
factors, such as leptin (54) and glucagon-like peptide-1 (GLP-1)
(55). However, to our knowledge, correlates of these hormones
with measures of sweet taste in human studies have not been
reported. The interplay between taste and post-ingestive signals
is mainly unexplored in individuals with or without obesity.
Further work on this subject may provide insight into the
findings reported here.
The current study corroborates previous findings of
increased self-reported sensitivity to food reward in obesity,
measured by the PFS (40, 41, 43, 44, 56) and the YFAS (42,
45, 57, 58). Furthermore, our study provides novel information
about the effect size of these differences between obesity and
healthy groups. The effect size of hedonic hunger was very
similar to our previous results of the association between the
PFS–Food Available subscale and obesity status (44). Emotional
Frontiers in Nutrition
eating followed this effect size, while food addiction symptoms
were associated with an even higher likelihood of belonging to
the obesity group. The fact that restrained and emotional, but
not external, eating were associated with obesity is consistent
with literature suggesting that only the latter reflects adaptive
behavior to the environment (59). Psychometric measures of
hedonic hunger, food addiction, and emotional eating were
strongly correlated, in line with the previous literature (45, 60).
However, enhanced sweet taste perception was positively
associated with restrained eating and inversely associated with
alcohol acceptance, defining a distinct cluster of feedingrelated features. In accordance to what is shown here, others
had suggested that dietary restraint can vary independently
from emotional eating (59). In addition, a sweet-alcohol
relationship has been shown in a clinical trial of naltrexone
for alcohol dependence (61). Indeed, in that study, patients
with the sweet-liking phenotype and higher levels of craving
for alcohol at baseline had fewer heavy drinking days when
treated with naltrexone than with placebo (61). Thus it is
possible that specific aspects of the neurocognitive vulnerability
that characterizes obesity (62) may also contribute to sweet
taste sensitivity, cognitive restraint of eating and alcohol
consumption. This framework is particularly relevant when
considering the increase in alcohol use disorders after bariatric
surgery (63), for which changes in reward processing have
been implicated (63). However, decreased alcohol acceptance
in the obesity group should be carefully interpreted since it
could merely corroborate findings of reduced alcohol use as the
surgical date approached (64).
This study should be interpreted considering its limitations.
Indeed, this study used a direct method for taste assessment
comprising basic taste stimuli (i.e., sour, salt, sweet, and
bitter), and standard scales to rate intensity and pleasantness
08
frontiersin.org
Ribeiro et al.
10.3389/fnut.2022.1028261
perceptions. Thus, we must discuss our results primarily in the
light of works using comparable methods. However, there is a
large body of literature that instead of pure taste stimuli used
foods or beverages and still did not find consistent associations
between sensory hedonic pleasure and obesity (13, 14, 18).
Importantly, this concept should be differentiated from other
variables such as “preference” and “wanting”. The latter is
typically described as the motivational component of reward
(65, 66) and, in laboratory conditions, “wanting” for highly
palatable foods is typically assessed using implicit measures
such as reaction time (67), that are not necessarily accessible
to conscious perception (65, 67, 68). In the present study,
while we show a dissociation between sweet intensity and sweet
pleasantness (i.e., a proxy for “liking”) on associations with
obesity, we do not have “wanting” measures and thus, could
not test if intensity perception is associated with this measure
reflecting choice and action.
It should also be noted that the obesity group comprised
pre-bariatric patients primarily. The inclusion of the “biggest
loser” subgroup, which was, on average, younger, with more
years of formal education, and had a higher percentage of males,
may have attenuated potential effects associated to referral for
surgery, but both groups had morbid obesity. We do not have
data to assess, for example, if pre-bariatric patient counseling
(medical, nutritional, and psychological support) influenced
the consumption of sugars. However, this cannot be excluded
since a study conducted on healthy subjects showed that sugar
reduction resulted in increased perception of the intensity of
sweet foods relative to controls after 2 months of diet (69).
Furthermore, specific aspects of diet, such as consumption
of low-calorie sweeteners or type of diet (e.g., very low-calorie
diet) that can impact taste perception, were not analyzed in this
study, and may have impacted our results. Further studies in
this field should include measures of dietary assessment (e.g.,
food diaries) to control for potential confounders. However,
as described in a previous publication (33), within the prebariatric group, a subgroup remained in the waiting list for
up to 18 months, while other subgroup was tested just prior
to bariatric surgery. These sub-groups did not differ in sweet
intensity ratings (33). Considering that patients are more
likely to be under energy restriction in the weeks before
bariatric surgery, this suggests that energy restriction was not
a major contributor to the response to sweet taste among
patients with obesity.
Finally, alcohol abuse was an exclusion criterion in this
study, which does not allow generalization of our results about
decreased alcohol acceptance to obesity.
previous studies. Our study also corroborates increased rewardrelated feeding behavior in obesity. However, enhanced sweet
intensity perception was not associated with psychological
measures of reward-related feeding behavior but with elevated
restrained eating and reduced alcohol acceptance. Further study
of sweet taste perception and its correlates in obesity is needed
to clarify the role of sweet taste in human obesity.
Data availability statement
The raw data supporting the conclusions of this article will
be made available by the authors, under reasonable request.
Ethics statement
The studies involving human participants were reviewed
and approved by Ethics Committees in the several institutions
involved in the study. Approved 24/09/2012, Comissão de
Ética - Área da Saúde Humana e Bem-Estar (Universidade de
Évora. Largo dos Colegiais 2, 7000-645 Évora, Portugal; + 351
(0)266 740 800; comissao.etica@uevora.pt), ref: 12031 2.
Approved 22/07/2013, Comissão de Ética da Fundação
Champalimaud
(Fundação
Champalimaud.
Avenida
Brasília 1400-038 Lisboa, Portugal; + 351 (0)210 480 200;
info@fundacaochampalimaud.pt), ref: N/A 3. Approved
05/12/2013, Comissão de Ética para a Saúde do Centro
Hospitalar de São João E.P.E. (Alameda Professor Hernâni
Monteiro 4200-319 Porto, Portugal; + 351 (0)225 512 100;
geral@hsjao.min-saude.pt), ref: CES254-13 4. Approved
06/08/2014, Conselho de Administração do Centro Hospitalar
de Setúbal E.P.E. (Rua camilo castelo Branco 2910-446, Setúbal,
Portugal; + 351 (0)265 549 000; geral@chs.min-saude.pt),
ref: 280/C.A. The patients/participants provided their written
informed consent to participate in this study.
Author contributions
AJO-M concept and designed and obtained funding. GR
and AJO-M drafted the manuscript. All authors performed
acquisition, analysis, or interpretation of data and critical
revision of the manuscript for intellectual content.
Conclusion
Funding
Our findings support enhanced sweet taste perception in
obesity while addressing critical methodological limitations of
AJO-M was supported by grants from the
BIAL Foundation (176/10), from Fundação para a
Frontiers in Nutrition
09
frontiersin.org
Ribeiro et al.
10.3389/fnut.2022.1028261
GmBH for norming and validation of cognitive tests. He is
the national coordinator for Portugal’s trial of esketamine for
treatment-resistant depression, sponsored by Janssen-Cilag, Ltd.
(EudraCT number: 2019-002992-33).
The remaining authors declare that the research was
conducted in the absence of any commercial or financial
relationships that could be construed as a potential
conflict of interest.
Ciência e Tecnologia (FCT), through a Junior Research
and Career Development Award from the Harvard Medical
Portugal Program (HMSP/ICJ/0020/2011), and by a Starting
Grant from the European Research Council (ERC) under
the European Union’s Horizon 2020 research and innovation
programme (grant agreement No. 950357). ST was funded
by the Center for Psychology at the University of Porto
(FCT UIDB/00050/2020). AF was funded by a postdoctoral
fellowship from FCT (SFRH/BPD/880972/2012). GR was
funded by doctoral fellowships from Universidade de Lisboa
(BD/2015Call) and FCT (SFRH/BD/128783/2017). The funding
sources did not participate in the design and conduct of the
study, collection, management, analysis, and interpretation of
the data, preparation, or review of the manuscript.
Publisher’s note
All claims expressed in this article are solely those of the
authors and do not necessarily represent those of their affiliated
organizations, or those of the publisher, the editors and the
reviewers. Any product that may be evaluated in this article, or
claim that may be made by its manufacturer, is not guaranteed
or endorsed by the publisher.
Conflict of interest
AJO-M was the national coordinator for Portugal of
a non-interventional study (EDMS-ERI-143085581, 4.0) to
characterize a Treatment-Resistant Depression Cohort in
Europe, sponsored by Janssen-Cilag, Ltd. (2019–2020), and of
a trial of psilocybin therapy for treatment-resistant depression,
sponsored by Compass Pathways, Ltd. (EudraCT number 2017003288-36). He is also a recipient of a grant from Schuhfried
Supplementary material
The Supplementary Material for this article can be
found online at: https://www.frontiersin.org/articles/10.3389/
fnut.2022.1028261/full#supplementary-material
References
1. Bray G, Kim K, Wilding J. Obesity: a chronic relapsing progressive disease
process. a position statement of the World Obesity Federation. Obes Rev. (2017)
18:715–23. doi: 10.1111/obr.12551
2. Bray G, Frühbeck G, Ryan D,
obesity. Lancet. (2016) 387:1947–56.
271-3
10. de Araujo I, Oliveira-Maia A, Sotnikova T, Gainetdinov RR,
Caron MG, Nicolelis MA, et al. Food reward in the absence of taste
receptor signaling. Neuron. (2008) 57:930–41. doi: 10.1016/j.neuron.2008.
01.032
Wilding J. Management of
doi: 10.1016/S0140-6736(16)00
11. Fernandes A, Alves da Silva J, Almeida J, Cui G, Gerfen CR, Costa RM, et al.
Postingestive modulation of food seeking depends on vagus-mediated dopamine
neuron activity. Neuron. (2020) 106:778–88.e6. doi: 10.1016/j.neuron.2020.
03.009
3. Hales C, Fryar C, Carroll M, Freedman D, Ogden C. Trends in obesity
and severe obesity prevalence in us youth and adults by sex and age,
2007-2008 to 2015-2016. JAMA. (2018) 319:1723–5. doi: 10.1001/jama.2018.
3060
12. Tan H, Sisti A, Jin H, Vignovich M, Villavicencio M, Tsang KS, et al. The
gut–brain axis mediates sugar preference. Nature. (2020) 580:511–6. doi: 10.1038/
s41586-020-2199-7
4. Hales C, Carroll M, Fryar C, Ogden C. Prevalence of obesity and severe
obesity among adults: United States, 2017-2018. NCHS Data Brief. (2020)
360:1–8.
13. de Araujo I, Schatzker M, Small D. Rethinking food reward. Annu Rev
Psychol. (2019) 71:139–64. doi: 10.1146/annurev-psych-122216-011643
5. Berrington de Gonzalez A, Hartge P, Cerhan JR, Flint AJ, Hannan L,
MacInnis RJ, et al. Body-mass index and mortality among 1.46 million
white adults. N Engl J Med. (2010) 363:2211–9. doi: 10.1056/NEJMoa100
0367
14. Wall K, Farruggia M, Perszyk E, Kanyamibwa A, Fromm S, Davis XS, et al.
No evidence for an association between obesity and milkshake liking. Int J Obes.
(2020) 44:1668–77. doi: 10.1038/s41366-020-0583-x
15. Snyder D, Sims C, Bartoshuk L. Psychophysical measures of human oral
sensation. In: Doty LR editor. Handbook of Olfaction and Gustation. Hoboken, NJ:
John Wiley and Sons, Inc (2015). doi: 10.1002/9781118971758.ch34
6. Whitlock G, Lewington S, Sherliker P, Clarke R, Emberson J, Halsey J, et al.
Body-mass index and cause-specific mortality in 900 000 adults: collaborative
analyses of 57 prospective studies. Lancet. (2009) 373:1083–96. doi: 10.1016/S01406736(09)60318-4
16. D’Ardenne K, Savage C, Small D, Vainik U, Stoeckel L. Core
neuropsychological measures for obesity and diabetes trials: initial report.
Front Psychol. (2020) 11:554127. doi: 10.3389/fpsyg.2020.554127
7. Hall K, Guo J. Obesity energetics: body weight regulation and the effects of diet
composition. Gastroenterology. (2017) 152:1718–27.e3. doi: 10.1053/j.gastro.2017.
01.052
17. Small D, Faurion A. Mapping brain activity in response to taste stimulation.
In: Doty LR editor. Handbook of Olfaction and Gustation. Hoboken, NJ: John Wiley
and Sons, Inc (2015). doi: 10.1002/9781118971758.ch35
8. Mullee A, Romaguera D, Pearson-Stuttard J, Viallon V, Stepien M, Freisling H,
et al. Association between soft drink consumption and mortality in 10 European
Countries. JAMA Intern Med. (2019) 179:1479–90. doi: 10.1001/jamainternmed.
2019.2478
18. Mela D. Eating for pleasure or just wanting to eat? Reconsidering sensory
hedonic responses as a driver of obesity. Appetite. (2006) 47:10–7. doi: 10.1016/j.
appet.2006.02.006
9. Oliveira-Maia A, Roberts C, Walker Q, Luo B, Kuhn C, Simon SA, et al.
Intravascular food reward. PLoS One. (2011) 6:e24992. doi: 10.1371/journal.pone.
0024992
Frontiers in Nutrition
19. Ribeiro G, Oliveira-Maia A. Sweet taste and obesity. Eur J Intern Med. (2021)
92:3–10. doi: 10.1016/j.ejim.2021.01.023
10
frontiersin.org
Ribeiro et al.
10.3389/fnut.2022.1028261
43. Ribeiro G, Santos O, Camacho M, Torres S, Mucha-Vieira F, Sampaio D,
et al. Translation, cultural adaptation and validation of the power of food scale
for use by adult populations in portugal. Acta Med Port. (2015) 28:575–82. doi:
10.20344/amp.6517
20. Thompson D, Moskowitz H, Campbell R. Taste and olfaction in human
obesity. Physiol Behav. (1977) 19:335–7. doi: 10.1016/0031-9384(77)90348-1
21. Frijters J, Rasmussen-Conrad E. Sensory discrimination, intensity perception,
and affective judgment of sucrose-sweetness in the overweight. J Gen Psychol.
(1982) 107:233–47. doi: 10.1080/00221309.1982.9709931
44. Ribeiro G, Camacho M, Santos O, Pontes C, Torres S, Oliveira-Maia A.
Association between hedonic hunger and body-mass index versus obesity status.
Sci Rep. (2018) 8:5857. doi: 10.1038/s41598-018-23988-x
22. Scruggs D, Buffington C, Cowan G. Taste acuity of the morbidly obese
before and after gastric bypass surgery. Obes Surg. (1994) 4:24–8. doi: 10.1381/
096089294765558854
45. Torres S, Camacho M, Costa P, Ribeiro G, Santos O, Vieira FM, et al.
Psychometric properties of the portuguese version of the yale food addiction scale.
Eat Weight Disord. (2017) 22:259–67. doi: 10.1007/s40519-016-0349-6
23. Bueter M, Miras A, Chichger H, Fenske W, Ghatei MA, Bloom SR, et al.
Alterations of sucrose preference after Roux-en-Y gastric bypass. Physiol Behav.
(2011) 104:709–21. doi: 10.1016/j.physbeh.2011.07.025
46. Viana V, Sinde S. Estilo alimentar: Adaptação e validação do questionário
holandês do comportamento alimentar. Psicol Teor Investig E Prática. (2003)
8:59–71.
24. Pepino M, Eisenstein S, Bischoff A, Klein S, Moerlein SM, Perlmutter JS, et al.
Sweet dopamine: sucrose preferences relate differentially to striatal D2 receptor
binding and age in obesity. Diabetes. (2016) 65:2618–23. doi: 10.2337/db16-0407
47. van Strien T, Frijters J, Bergers G, Defares P. The Dutch Eating Behavior
Questionnaire (DEBQ) for assessment of restrained, emotional, and external eating
behavior. Int J Eat Disord. (1986) 5:295–315. doi: 10.1002/1098-108X(198602)5:
2<295::AID-EAT2260050209>3.0.CO;2-T
25. Grinker J. Obesity and sweet taste. Am J Clin Nutr. (1978) 31:1078–87. doi:
10.1093/ajcn/31.6.1078
26. Holinski F, Menenakos C, Haber G, Olze H, Ordemann J. Olfactory and
gustatory function after bariatric surgery. Obes Surg. (2015) 25:2314–20. doi: 10.
1007/s11695-015-1683-x
48. Schutz H. Food action rating scale for measuring food acceptance. J Food Sci.
(1965) 30:365–74. doi: 10.1111/j.1365-2621.1965.tb00316.x
49. Benjamini Y, Hochberg Y. Controlling the false discovery rate: a practical
and powerful approach to multiple testing. J R Stat Soc Ser B Methodol. (1995)
57:289–300. doi: 10.1111/j.2517-6161.1995.tb02031.x
27. Park D, Yeo J, Ryu I, Kim S, Jung J, Yeo S. Differences in taste detection
thresholds between normal-weight and obese young adults. Acta Otolaryngol.
(2015) 135:478–83. doi: 10.3109/00016489.2014.975370
50. Wang G, Volkow N, Felder C, Fowler JS, Levy AV, Pappas NR, et al. Enhanced
resting activity of the oral somatosensory cortex in obese subjects. Neuroreport.
(2002) 13:1151–5. doi: 10.1097/00001756-200207020-00016
28. Rodin J, Moskowitz H, Bray G. Relationship between obesity, weight loss, and
taste responsiveness. Physiol Behav. (1976) 17:591–7. doi: 10.1016/0031-9384(76)
90157-8
51. de Araujo I, Lin T, Veldhuizen M, Small D. Metabolic regulation of brain
response to food cues. Curr Biol. (2013) 23:878–83. doi: 10.1016/j.cub.2013.04.001
29. Pasquet P, Frelut M, Simmen B, Hladik C, Monneuse M. Taste perception in
massively obese and in non-obese adolescents. Int J Pediatr Obes. (2007) 2:242–8.
doi: 10.1080/17477160701440521
52. Veldhuizen M, Babbs R, Patel B, Fobbs W, Kroemer NB, Garcia E, et al.
Integration of sweet taste and metabolism determines carbohydrate reward. Curr
Biol. (2017) 27:2476–85.e6. doi: 10.1016/j.cub.2017.07.018
30. Pepino M, Finkbeiner S, Beauchamp G, Mennella J. Obese women have lower
monosodium glutamate taste sensitivity and prefer higher concentrations than do
normal-weight women. Obes Silver Spring. (2010) 18:959–65. doi: 10.1038/oby.
2009.493
53. Thanarajah S, Backes H, DiFeliceantonio A, Albus K, Cremer AL, Hanssen
R, et al. Food intake recruits orosensory and post-ingestive dopaminergic circuits
to affect eating desire in humans. Cell Metab. (2019) 29:695–706.e4. doi: 10.1016/j.
cmet.2018.12.006
31. Hardikar S, Hochenberger R, Villringer A, Ohla K. Higher sensitivity to sweet
and salty taste in obese compared to lean individuals. Appetite. (2017) 111:158–65.
doi: 10.1016/j.appet.2016.12.017
54. Yoshida R, Noguchi K, Shigemura N, Jyotaki M, Takahashi I, Margolskee RF,
et al. Leptin suppresses mouse taste cell responses to sweet compounds. Diabetes.
(2015) 64:3751–62. doi: 10.2337/db14-1462
32. Wittekind A, Higgins K, McGale L, Schwartz C, Stamataki NS, Beauchamp
GK, et al. A workshop on “Dietary Sweetness-Is It an Issue?”. Int J Obes. (2018)
42:934–8. doi: 10.1038/ijo.2017.296
55. Jensterle M, Rizzo M, Janez A. Glucagon-like peptide 1 and taste perception:
from molecular mechanisms to potential clinical implications. Int J Mol Sci. (2021)
22:902. doi: 10.3390/ijms22020902
33. Ribeiro G, Camacho M, Fernandes A, Cotovio G, Torres S, Oliveira-Maia
A. Reward-related gustatory and psychometric predictors of weight loss following
bariatric surgery: a multicenter cohort study. Am J Clin Nutr. (2021) 113:751–61.
doi: 10.1093/ajcn/nqaa349
56. Schultes B, Ernst B, Wilms B, Thurnheer M, Hallschmid M. Hedonic hunger
is increased in severely obese patients and is reduced after gastric bypass surgery.
Am J Clin Nutr. (2010) 92:277–83. doi: 10.3945/ajcn.2009.29007
34. Smith K, Papantoni A, Veldhuizen M, Kamath V, Harris C, Moran TH, et al.
Taste-related reward is associated with weight loss following bariatric surgery. J Clin
Invest. (2020) 130:4370–81. doi: 10.1172/JCI137772
57. Long C, Blundell J, Finlayson GA. Systematic Review of the Application And
Correlates of YFAS-Diagnosed “Food Addiction” in Humans: are eating-related
“addictions” a cause for concern or empty concepts? Obes Facts. (2015) 8:386–401.
doi: 10.1159/000442403
35. Smith K, Aghababian A, Papantoni A, Veldhuizen MG, Kamath V, Harris
C, et al. One year follow-up of taste-related reward associations with weight
loss suggests a critical time to mitigate weight regain following bariatric surgery.
Nutrients. (2021) 13:3943. doi: 10.3390/nu13113943
58. Brunault P, Ducluzeau P, Bourbao-Tournois C, Delbachian I, Couet C,
Réveillère C, et al. Food addiction in bariatric surgery candidates: prevalence and
risk factors. Obes Surg. (2016) 26:1650–3. doi: 10.1007/s11695-016-2189-x
36. Landis B, Welge-Luessen A, Brämerson A, Bende M, Mueller CA, Nordin S,
et al. “Taste Strips”–a rapid, lateralized, gustatory bedside identification test based
on impregnated filter papers. J Neurol. (2009) 256:242. doi: 10.1007/s00415-0090088-y
59. van Strien T. Causes of emotional eating and matched treatment of obesity.
Curr Diab Rep. (2018) 18:35. doi: 10.1007/s11892-018-1000-x
60. Schulte E, Gearhardt A. Attributes of the food addiction phenotype within
overweight and obesity. Eat Weight Disord. (2020) 26:2043–9. doi: 10.1007/s40519020-01055-7
37. Green B, Dalton P, Cowart B, Shaffer G, Rankin K, Higgins J. Evaluating the
‘Labeled Magnitude Scale’for measuring sensations of taste and smell. Chem Senses.
(1996) 21:323–34. doi: 10.1093/chemse/21.3.323
61. Garbutt J, Kampov-Polevoy A, Kalka-Juhl L, Gallop R. Association of the
Sweet-Liking Phenotype and Craving for Alcohol With the Response to Naltrexone
Treatment in Alcohol Dependence: A Randomized Clinical TrialSweet-Liking
Phenotype and Craving for AlcoholSweet-Liking Phenotype and Craving for
Alcohol. JAMA Psychiatry. (2016) 73:1056–63. doi: 10.1001/jamapsychiatry.2016.
2157
38. Lim J, Wood A, Green B. Derivation and evaluation of a labeled hedonic scale.
Chem Senses. (2009) 34:739–51. doi: 10.1093/chemse/bjp054
39. Fons M, Osterhammel P. Electrogustometry. Arch Otolaryngol. (1966)
83:538–42. doi: 10.1001/archotol.1966.00760020540008
40. Lowe M, Butryn M, Didie E, Annunziato RA, Thomas JG, Crerand CE,
et al. The power of food scale. a new measure of the psychological influence
of the food environment. Appetite. (2009) 53:114–8. doi: 10.1016/j.appet.2009.
05.016
62. Stice E, Burger K. Neural vulnerability factors for obesity. Clin Psychol Rev.
(2019) 68:38–53. doi: 10.1016/j.cpr.2018.12.002
63. Blackburn A, Hajnal A, Leggio L. The gut in the brain: the effects of bariatric
surgery on alcohol consumption. Addict Biol. (2017) 22:1540–53. doi: 10.1111/adb.
12436
41. Cappelleri J, Bushmakin A, Gerber R, Leidy NK, Sexton CC, Karlsson J, et al.
Evaluating the Power of Food Scale in obese subjects and a general sample of
individuals: development and measurement properties. Int J Obes. (2009) 33:913–
22. doi: 10.1038/ijo.2009.107
64. Maciejewski M, Smith V, Berkowitz T, Arterburn DE, Mitchell JE, Olsen
MK, et al. Association of bariatric surgical procedures with changes in unhealthy
alcohol use among US veterans. JAMA Netw Open. (2020) 3:e2028117. doi: 10.1001/
jamanetworkopen.2020.28117
42. Gearhardt A, Corbin W, Brownell K. Preliminary validation of the yale food
addiction scale. Appetite. (2009) 52:430–6. doi: 10.1016/j.appet.2008.12.003
Frontiers in Nutrition
11
frontiersin.org
Ribeiro et al.
10.3389/fnut.2022.1028261
65. Berridge K. ’Liking’and “wanting” food rewards: Brain substrates and roles in
eating disorders. Physiol Behav. (2009) 97:537–50. doi: 10.1016/j.physbeh.2009.02.
044
69. Wise P, Nattress L, Flammer L, Beauchamp G. Reduced dietary intake of
simple sugars alters perceived sweet taste intensity but not perceived pleasantness.
Am J Clin Nutr. (2016) 103:50–60. doi: 10.3945/ajcn.115.112300
66. Berridge K. Food reward: brain substrates of wanting and liking. Neurosci
Biobehav Rev. (1996) 20:1–25. doi: 10.1016/0149-7634(95)00033-B
COPYRIGHT
© 2022 Ribeiro, Torres, Fernandes, Camacho, Branco, Martins, Raimundo
and Oliveira-Maia. This is an open-access article distributed under the
terms of the Creative Commons Attribution License (CC BY). The use,
distribution or reproduction in other forums is permitted, provided the
original author(s) and the copyright owner(s) are credited and that the
original publication in this journal is cited, in accordance with accepted
academic practice. No use, distribution or reproduction is permitted
which does not comply with these terms.
67. Finlayson G, King N, Blundell J. Is it possible to dissociate ‘liking’ and
‘wanting’ for foods in humans? A novel experimental procedure. Physiol Behav.
(2007) 90:36–42. doi: 10.1016/j.physbeh.2006.08.020
68. Finlayson G, Arlotti A, Dalton M, King N, Blundell J. Implicit
wanting and explicit liking are markers for trait binge eating. a susceptible
phenotype for overeating. Appetite. (2011) 57:722–8. doi: 10.1016/j.appet.2011.0
8.012
Frontiers in Nutrition
12
frontiersin.org
Enhanced sweet taste perception in obesity: Joint analysis of gustatory data from multiple studies
Frontiers in Nutrition
IntroductionWhile sweet taste perception is a potential determinant of feeding behavior in obesity, the supporting evidence is inconsistent and is typically associated with methodological limitations. Notably, possible associations between sweet taste perception and measures of food reward remain undetermined.Materials and methodsWe conducted a cross-sectional analysis comparing 246 individuals with severe obesity and 174 healthy volunteers using a validated method for taste perception assessment. We included gustatory variables, namely intensity and pleasantness ratings of sour, salt, sweet, and bitter tastants, and taste thresholds assessed by electrogustometry. Reward-related feeding behavior, including hedonic hunger, food addiction, feeding behavior traits, and acceptance of foods and alcohol, was evaluated using self-rated scales for comparison with gustatory measures.ResultIn logistic regressions adjusted for age, gender, educational level, and research center, we found that ......Read more