1. Introduction
An edge column, edge beam, fishtail plate, and embedded steel plate compose a steel plate shear wall (SPSW). Compared with other structural systems, it has some merits [
1]: (1) compared with the pure bending frame, under the same amount of steel, they have higher lateral stiffness, which can save the amount of steel; (2) compared with the buckling restrained brace, the structure, manufacture, and construction are relatively simple, with higher economy; and (3) compared with reinforced concrete walls, its thickness is very small, making it lightweight and has limited available space, and the production and installation time can be completed in advance in the factory.
SPSW can be divided into three types according to their height–thickness ratio λ: thick plate (λ < 100), moderate thick plate (100 ≤ λ ≤ 300), and thin plate (λ < 300) [
2]. The height–thickness ratio of the shear wall plate has a significant influence on the hysteretic performance of the SPSW. As the height–thickness ratio of the shear wall plate increases, the wall plate easily buckles, the hysteresis loop inclines to pinch, and the energy dissipation capacity decreases [
3]. The lateral stiffness of the thick SPSW is large. Although it has a good energy dissipation effect, there is a serious waste of steel during use. Therefore, most of the projects use thin steel plates. Under the serviceability limit state, the thin unstiffened SPSW may experience overall elastic buckling. The plate has a certain out-of-plane deformation and is accompanied by a huge noise of bang, which has a great impact on the normal use of the building [
4]. However, setting stiffeners can solve the problem that the hysteretic loop of a thin wall is not fuller than that of a thick plate, enhancing the hysteretic performance of the structure. After setting stiffeners on the steel plate wall, the plate is broken up into multiple panels, the initial lateral stiffness of the structure is improved, the critical elastic buckling load is increased, and the seismic performance is better.
In engineering practice, the height of SPSW is too high. There will be great difficulties in the transportation process, and it is limited in the arrangement. The usual practice is to cut the steel plate wall into two parts and transport it to the construction site. To solve the problem of insufficient strength at the splicing, multichannel transverse slab stiffeners are generally placed at the splicing of two steel plates. In particular, contrasting to SPSW with only vertical stiffeners, the arrangement of transverse stiffeners can also restrict the outside surface deformation of vertical stiffeners.
SPSW has become a hot research topic in recent years due to the attention of researchers at home and abroad. Alinia and Dastfan [
5,
6] studied the mechanical properties of SPSW with stiffeners and proposed that it can conspicuously enhance energy dissipation capacity and ultimate bearing capacity. Chen et al. [
7] and Chen and Guo [
8] conducted experimental research on three forms of SPSW and proposed the greater the thickness of the plate, the stronger the constraint effect of the stiffener, which can not only increase the hysteresis loop area but also make the hysteresis curve fuller. Guo et al. [
9] studied a semirigid connection frame cross-stiffened SPSW and proposed the structure not only has good plastic deformation ability but also has good ultimate bearing capacity. Haddad et al. [
10] analyzed three stiffened and two unstiffened specimens and concluded that stiffened SPSW markedly enhanced shear stiffness and energy dissipation capacity. Mu and Yang [
11] analyzed the seismic behavior of two single-span SPSW with obliquely stiffening and proposed that obliquely stiffening improved bearing capacity and stiffness. Alinia and Shirazi [
12] analyzed the seismic behavior of a stiffened SPSW by changing the number and arrangement of stiffeners. It is concluded that the greater the number of stiffeners, the stronger the lateral resistance, but it will decrease the ductility of the structure. Compared with a unilateral arrangement, a bilateral arrangement of stiffeners is more effective. Nie [
13] proposed that the buckling critical load of asymmetric cross diagonal stiffened SPSW is the largest and the least prone to instability through the characteristic buckling method of ANSYS for six kinds of stiffeners. Alavi [
14] analyzed the mechanical properties of SPSW with diagonal stiffeners on both sides through experiments. It is concluded that the hysteretic curve of the SPSW with a diagonal stiffener is fuller, and other seismic performance is also improved. Sigariyazd [
15] studied the hysteretic performance of SPSW with diagonal stiffeners and the proposed bearing capacity, energy dissipation, and ductility of the structure were significantly improved. Combined with the outcomes of the test and finite element analysis, the calculation formula of steel plate strength was proposed. Guo [
16] studied the critical elastic buckling load and buckling mode of fully stiffened SPSW with slits on both sides and proposed its elastic buckling design formula. Jahanpour [
17] introduces the semi-supported steel shear wall (SSSW) system and proposes new means to estimate the ultimate shear capacity of a given SSSW. Nie and Zhu [
18] analyzed the seismic performance of two stiffened SPSW with openings and one stiffened SPSW without openings and proposed a simple formula for the shear strength reduction factor and a simplified devise means for computing the lateral bearing capacity of stiffened SPSW. Wang [
19] analyzed the mechanic performances of vertical stiffened SPSW, studied the influence of stiffeners on the lateral stiffness of SPSW, and developed a computing formula for the lateral bearing capacity of SPSW. Refs. [
20,
21,
22] proposed a lightweight design and structural optimization method for node dampers and sliders and an innovative MSB fully prefabricated lifted connection (FPLC), which can significantly reduce energy consumption and is of great significance for achieving green production. The interaction for rib-to-deck welded joints of orthotropic steel deck (OSD) is analyzed using the finite element method in Ref. [
23]. The results show that the numerical results indicate that fatigue crack growth in welds is unstable due to inclusions. In Ref. [
24], partially encased composite columns (PECCs) with different positions of shear studs are studied and analyzed. Test results illustrate that the position of studs is a considerable parameter for the shear performance. In Ref. [
25], the flexural performance of composite beams with different materials was studied, and the SFRC layer thickness and steel rebar diameter had a great influence on the bearing capacity of the beam. The seismic performance of concrete-filled steel tubular (CFST) composite columns was studied and analyzed in Ref. [
26]. The results show that the composite columns have good seismic performance.
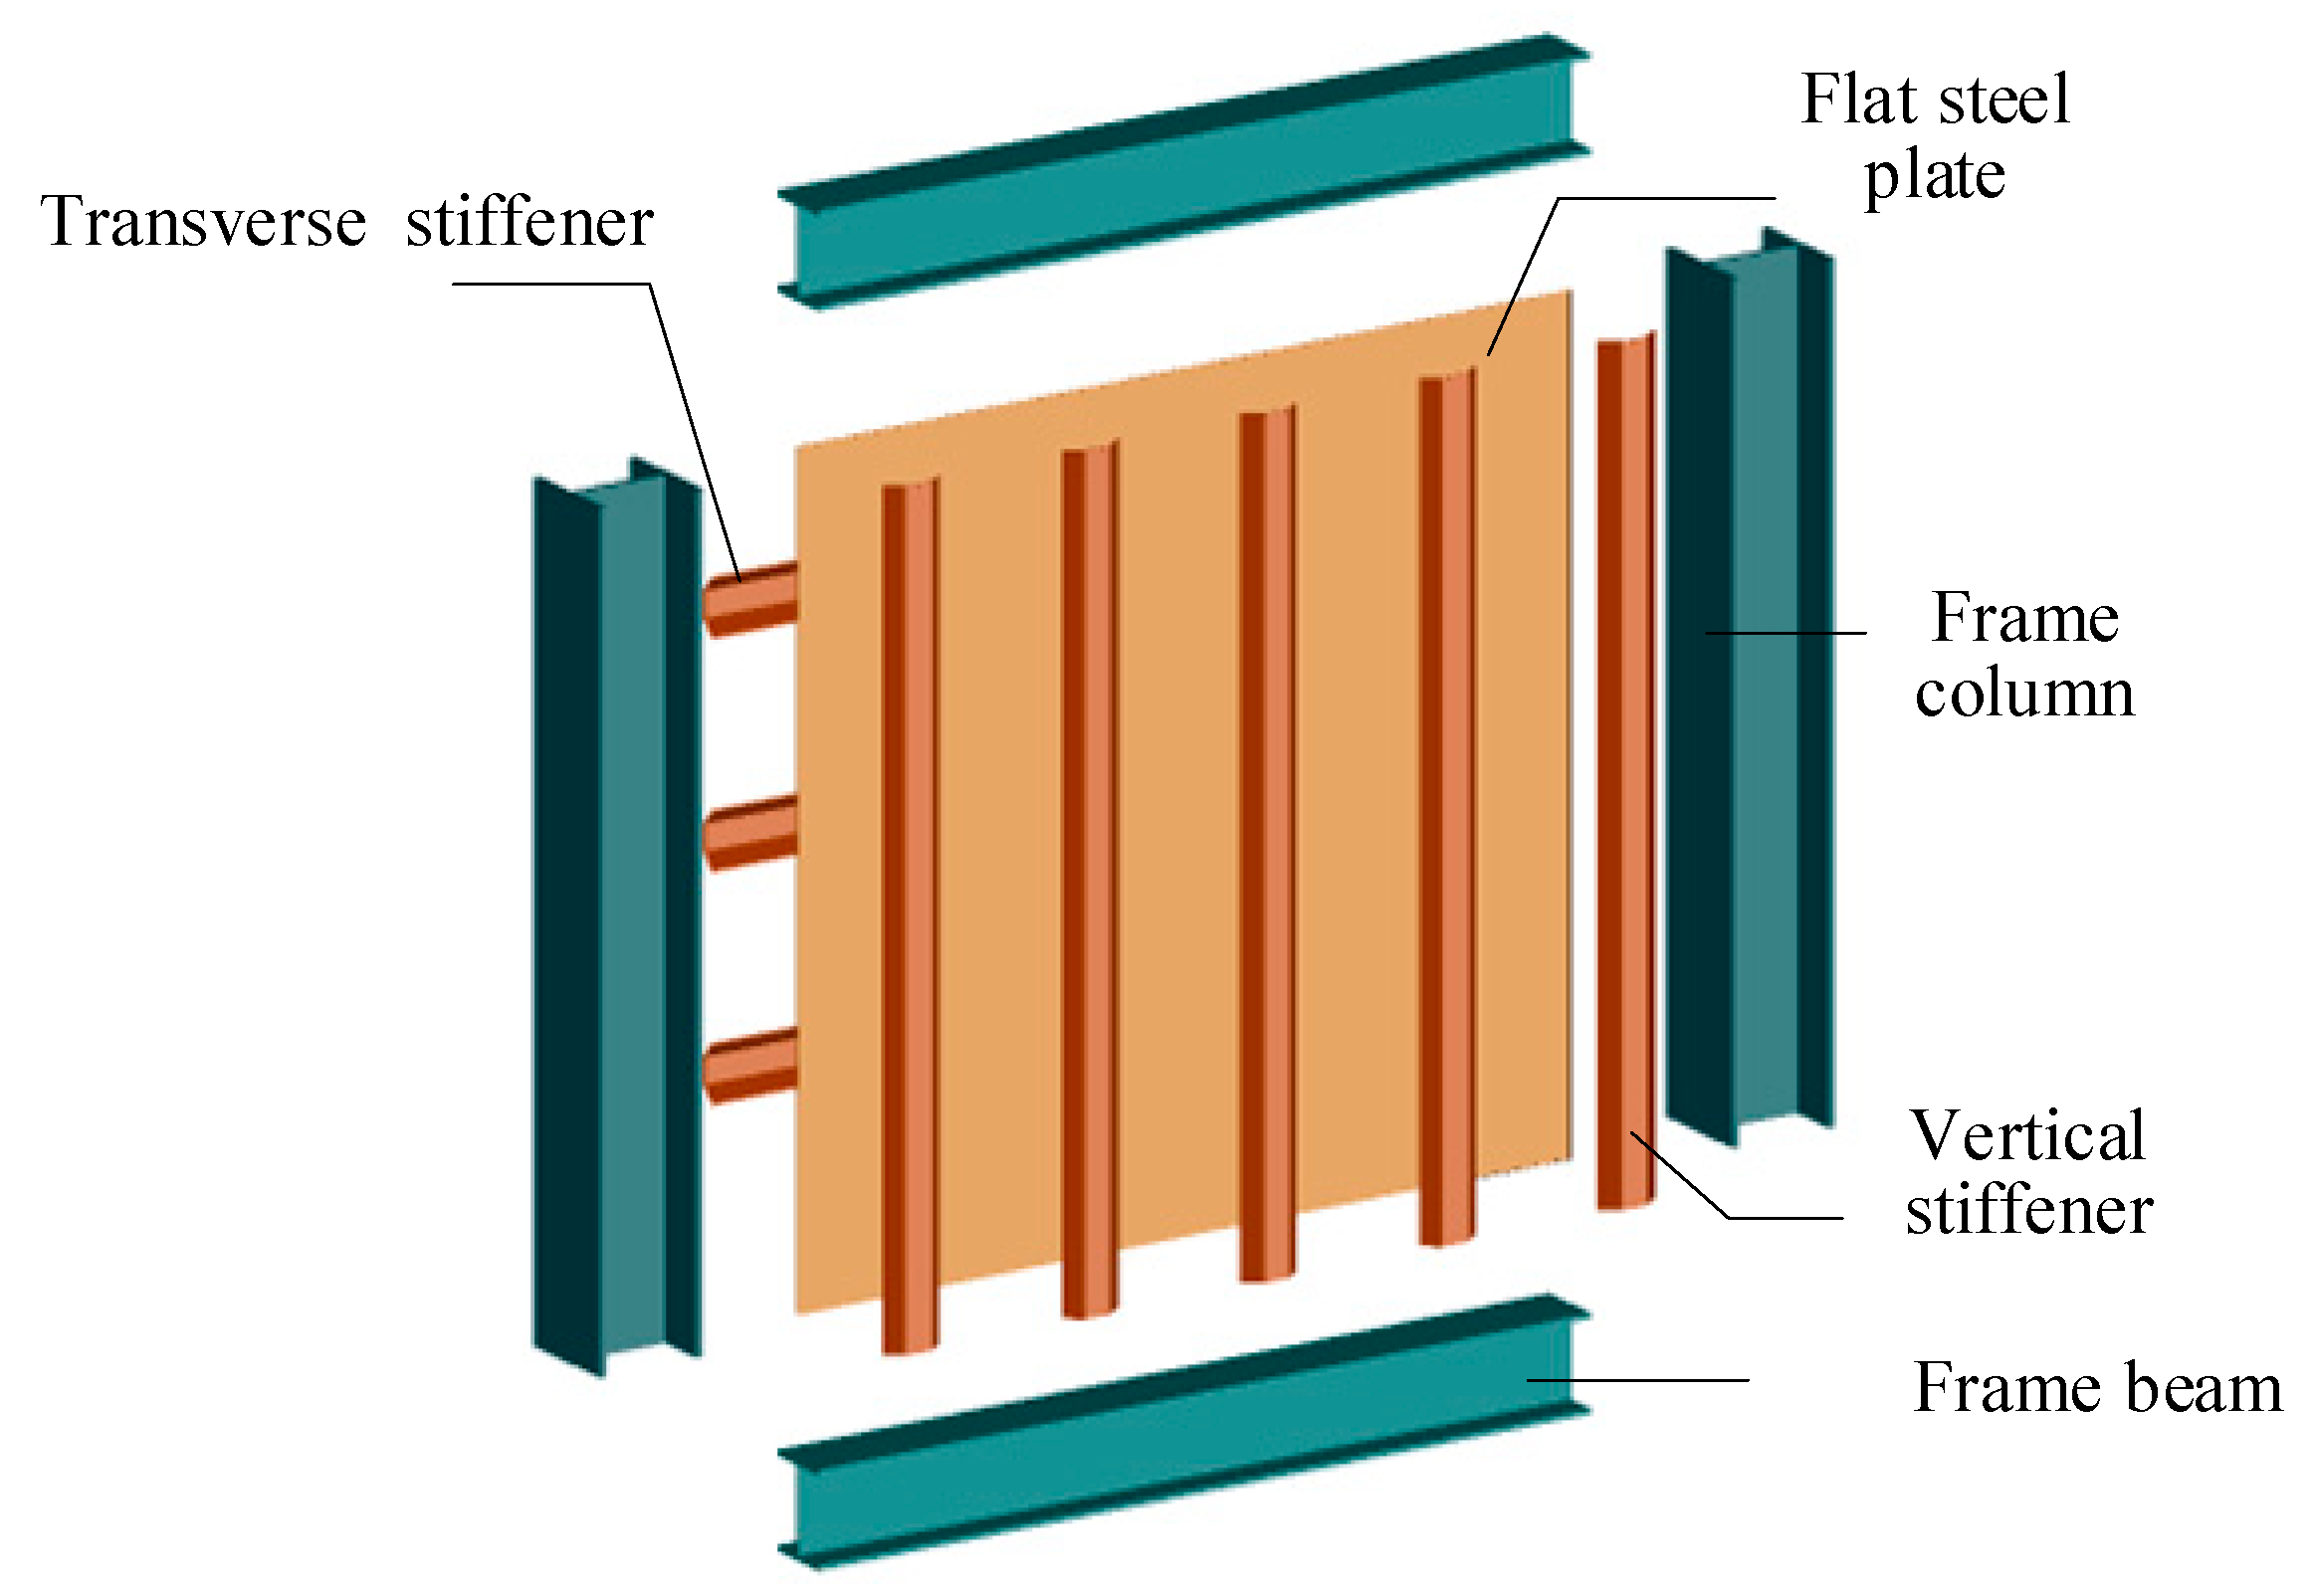
Based on the above SPSW development background, this paper proposes a new type of SPSW—trapezoidal orthogonal stiffened steel plate shear wall (TSW). The structural form is revealed in
Figure 1. The arrangement of TSW is different. One side is vertically arranged and the other side is horizontally arranged. The advantage of this construction method is that there is no cross connection when the stiffeners are arranged, and the structural measures at the joints are simplified, which is convenient for actual construction. The transverse stiffener will constrain the out-of-plane deformation of the vertical stiffener. The vertical stiffener near the column edge can limit the out-of-plane deformation of the steel plate edge under horizontal –, avoid premature buckling, and improve the ductility and energy dissipation capacity of the steel plate wall. The steel plate is divided into several high-thickness comparison grids under the combined action of stiffeners on both sides. The elastic initial stiffness of the steel plate is improved and the seismic performance is better. Variable parameters analysis of the TSW using ABAQUS 2016 and a formula for the shear capacity of TSW is developed. The formula error is within the acceptable range and the accuracy is good.
3. Parametric Analyses of TSW
To study the effects of the flat steel plate thickness
tb, stiffener thickness
tt, stiffener height
h, and stiffener bottom width
l on the hysteretic performance of TSW, this paper uses ABAQUS 2016 to establish four groups of finite element models for the TSW. The number of specimens in each group is four. The geometric parameters are shown in
Figure 9. The parameter design of the specimen is shown in
Table 6. The bottom width
l of the trapezoidal stiffener is changed by changing the size of
b. Then, by comparing the hysteresis curve, skeleton curve, and strength stiffness degradation curve, the reasonable value range of each design parameter is given.
The most important parameter to measure the influence of stiffeners on the out-of-plane restraint of wall panels is the rib stiffness ratio, that is, the ratio of the out-of-plane bending stiffness of the stiffener to the out-of-plane flexural stiffness of the steel plate. The rib stiffness ratio is expressed as
η, and the calculation formula is shown in Equation (1) [
28].
In the formula, Es—the elastic modulus of the stiffener is N/mm2; Is—the inertial moment of the stiffener section parallel to the center of gravity axis of the stiffened plate section; D—cylindrical rigidity of stiffened plate; c—average spacing of stiffeners on both sides; E—the elastic modulus of flat steel plate s N/mm2; υ—Poisson’s ratio of flat steel plate is 0.3.
3.1. Effects of Plate Thickness tb
In this section, four models are established. The FEM is named the TSW-BT series, and the specific size is shown in
Table 7.
The load–displacement curves are given in
Figure 10. The comparison shows that from TSW-BT2, the hysteresis curves of the subsequent specimens are by degrees transformed into an anti- “S” shape. The hysteresis loop area of TSW-BT3 and subsequent specimens gradually increases, and the shape is fuller. The hysteresis loop area gradually enlarges following the thickness of the flat steel plate. Comparing the skeleton curves, it can be seen that when entering the plasticity, the thicker the flat steel plate, the more the inflection point of the envelope curve occurs first, and the specimens enter the buckling stage earlier; at the later stage of loading, the envelope curves decreased gently, showing good ductility performance. The specific values are shown in
Table 8. Compared with TSW-BT1, the yield load of TSW-BT2~TSW-BT4 increased by 24.57%, 21.91%, and 6.44%, respectively. The growth rates of the peak load are 18.29%, 16.87%, and 6.02%; the lateral stiffness increases by 34.11%, 17.97%, and 9.32%. The peak displacement decreased by 1.35%, 1.05%, and 31.7%. The greater the flat steel plate thickness is, the stronger its bearing capability and lateral stiffness.
The relative energy dissipation index is the equivalent viscous damping coefficient
he, which reflects the fullness of the hysteresis loop (see
Figure 11) and is calculated by Equation (2).
In the formula, —the area of hysteresis loop ABCD; —the sum of the area of triangles obe and odf.
The energy dissipation capacity is seen in
Figure 12. With the increase in thickness, the absolute energy dissipation value is larger. The energy dissipation values of specimens TSW-BT1, TSW-BT2, and TSW-BT3 at each loading stage are greatly different, while the energy dissipation values of TSW-BT3 and TSW-BT4 at each loading stage are almost close. The equivalent viscous damping coefficient enlargements as increasing thickness of the steel plate before 5.0δy, and the equivalent viscous damping coefficient of the thinner steel plate is higher than rather thick after 5.0δy. A comprehensive comparison of various energy consumption performance indicators shows that the absolute index and relative index of TSW-BT3 (flat steel plate thickness of 6 mm) are better.
According to the given indicators, the thickness of TSW has a greater impact on its hysteretic capacity. This can effectively enhance the full degree of hysteretic curves and improve its energy dissipation ability. Additionally, the initial stiffness, yield load, and peak load of the specimen are improved to a certain extent. The steel plate thickness for the TSW is suggested to be in the range of 4 to 6 mm.
3.2. Effects of the Stiffener Thickness tt
In this section, four models are established. The FEM is named the TSW-TT series, and the specific variable parameter size is shown in
Table 9.
The load–displacement curves are given in
Figure 13. The comparison shows that the hysteresis curves of specimens TSW-TT1 and TSW-TT2 have an obvious “pinching” phenomenon. Starting from TSW-TT3, the hysteresis curves gradually become an anti- “S” shape, and the shape is fuller. The comparison of the envelope curves shows that the initial lateral stiffness and peak load increase gradually. In the middle of loading, the greater the thickness of the stiffener is, the greater the peak load. At the end of loading, the skeleton curves decreased gently and showed good ductility. The specific values are shown in
Table 10. Compared with TSW-TT1, the yield load of TSW-TT2~TSW-TT4 increased by 13.13%, 15.71%, and 0.33%, respectively. The increase in peak load is 9.93%, 14.72%, and 0.98%. The increments of lateral stiffness are 6.01%, 9.18%, and 0.55%. The peak displacement decreased by 5.89%, 36.97%, and 2.66%. The larger the stiffener thickness is, the stronger its bearing capability and lateral stiffness.
Figure 14 shows the energy dissipation capacity. As the thickness of the trapezoidal stiffener increases, the absolute energy dissipation value is larger. The energy dissipation values TSW-TT1 and TSW-TT2 at each loading stage are larger, while the energy dissipation values TSW-TT3 and TSW-TT4 at each loading stage are smaller. The equivalent viscous damping coefficient between the 2.0δy and 5.0δy specimens is obviously different, and the numerical difference between the loading stages of TSW-TT3 and TSW-TT4 is not significant. At 6.0δy~7.0δy, the equivalent viscous damping coefficients are similar to each other, and the changing trend is basically the same. Increasing the thickness of the stiffener can significantly improve the energy dissipation performance of the specimens, and the effect is most obvious in the middle of loading, but the thickness of the stiffener is too large, and it will also increase the amount of steel used.
Based on the above indexes, trapezoidal stiffener thickness has an obvious effect on the hysteretic capacity of TSW. The increase in the thickness of the stiffener solves “pinching” phenomenon of the hysteresis curves and improves the energy dissipation ability. The initial stiffness, yield load, and peak load of the specimens are improved to a certain extent, and the stiffness and strength degeneration rate are slowed down. Therefore, this paper suggests a TSW trapezoidal stiffener thickness of 4~6 mm.
3.3. Effects of the Stiffener Height h
In this section, the variable parameter analysis is carried out for the height of the trapezoidal stiffener. This series also includes four specimens. The finite element model is named the TSW-TH series, and the specific variable parameter size is shown in
Table 11.
The load–displacement comparison is given in
Figure 15. Compared with the hysteresis curves, it shows that after entering the elastic–plastic stage, the hysteresis curves of TSW-TH1 and TSW-TH2 have an obvious “pinch” phenomenon. With the height of the trapezoidal stiffener increase, the shape of the hysteresis curve of the subsequent specimens gradually changes to the anti-“S” shape, and the shape is fuller. Comparing the skeleton curves, it can be seen that with the increases of the trapezoidal stiffener height when comparing the specimens TSW-TH1~TSW-TH4, the initial lateral stiffness gradually decreases, and the maximum stiffness of the wallboard also decreases. The concrete numerical values are shown in
Table 12, and the yield load growth rates of TSW-TH1~TSW-TH4 are 6.99%, 5.00%, and 3.53%, respectively. The growth rates of the peak load are 7.19%, 4.96%, and 4.18%, and the peak displacement decreased by 7.61%, 17.86%, and 0.59%, respectively. The lateral stiffness changes little. Therefore, it is recommended that the height of the trapezoidal stiffener is 50 mm.
The energy dissipation capacity is seen in
Figure 16. When the wallboard enters the yield stage, the opening degree of hysteretic curves is low and the energy dissipation is limited. Continuing to loading, as the height of the trapezoidal stiffener increases, the trend of the energy dissipation value of the specimen increases first and then decreases. The equivalent viscous damping coefficient between the 2.0δy and 5.0δy specimens is obviously different. At 6.0δy~7.0δy, the equivalent viscous damping coefficients are close to each other, and the variation trend is basically the same.
In summary, trapezoidal stiffener height has an obvious influence on the hysteretic capacity of TSW. Increasing the height of the stiffener can obviously solve the “pinching” phenomenon of the hysteretic curve. The trapezoidal stiffener plays an active role in enhancing the hysteretic properties of the specimen in the proper height range, but after exceeding a certain size, the height of the stiffener continues to increase, which will have a reverse effect on the hysteretic performance of the specimen. Therefore, it is suggested that the height of the stiffener should not exceed 60 mm.
3.4. Effects of the Stiffener Bottom Width l
In this section, four specimens are designed. The FEM is named the TSW-L series. The specific variable parameter size is shown in
Table 13.
The load–displacement comparison is given in
Figure 17. Compared with the hysteresis curves, it shows that the hysteresis curves of the series are close, and the hysteresis loop area is not much different. The influence of changing the bottom width of the trapezoidal stiffener on the hysteresis curves is not obvious. Compared with the previous three parameters, the bottom width of the stiffener has little impact on the hysteretic performance. The comparison of the skeleton curves shows that the envelope curves of this series are very similar during the whole loading process. In the middle stage of loading, the curves of all specimens were basically in a state of coincidence. The descending section of the skeleton curve is different at the end of loading. The larger the trapezoidal stiffener bottom width is, the gentler the downward trend is. This is because the wider the width of the bottom edge of the stiffener is, the better the effect of restraining the inelastic buckling of the flat steel plate is. Comparing the data in
Table 14, it shows that with trapezoidal stiffener bottom width increases, the increase and decrease in each key indicator are not obvious, indicating that the bottom width of the trapezoidal stiffener does not affect the bearing capability and initial stiffness.
The energy dissipation capacity is given in
Figure 18. The displacement loading is less than 3.0δy, and the energy dissipation values of this series are scarcely equal. After 3.0δy, the difference gradually appears. As the bottom width of the trapezoidal stiffener increases, the energy dissipation value of the specimen increases first and then decreases. The equivalent viscous damping coefficients of this series are almost the same before 3.0δy, and the difference appears after 3.0δy.
In summary, the TSW-L series specimens have preferable bearing capability stability, but the influence of the bottom width of the trapezoidal stiffener on the initial lateral stiffness, skeleton curve, and energy dissipation capacity is not obvious. Therefore, the influence of the trapezoidal stiffener bottom width on the key indicators of the specimens can be ignored.
4. Theoretical Calculation of the Ultimate Shear Capacity
The outer frame and the flat steel plate form the TSW. They, together, resist the action of lateral forces. When the shear yield member reaches the maximum horizontal bearing capacity, the upper and lower of the outer frame column and the beam end basically form plastic hinges, and the flat steel plate yields, but no out-of-plane buckling occurs, forming a plastic hinge mechanism [
33,
34,
35].
According to the energy method in Ref. [
33], TSW is composed of an embedded steel plate and outer frame, which resist the lateral force together. When the bearing capacity reaches the maximum, the plastic hinge is basically formed at the top and bottom of the outer frame column and the beam end of the frame beam. The embedded steel plate is uniformly yielded but no out-of-plane buckling occurs, forming a plastic hinge mechanism, as shown in
Figure 19. The shear-bearing capacity of each layer of the TSW under the plastic hinge mechanism can be deduced. The calculation formula is shown in Equation (2).
In the formula,
is the shear bearing capacity of the ith-layer structure,
is the distance from the ith-layer structure to the ground,
is the shear bearing capacity of TSW in the
-layer structure, and
refers to the flexural bearing capacity of the outer frame. It requires a certain reduction. The reduction factor is 0.8.
In the formula, is the resistance moment of the column plastic section and is the yield strength. In Equation (4), there is only one unknown quantity , and the embedded steel plate shear capacity is solved below.
When TSW yields, the steel plate and the stiffeners offer shear-bearing capacity. The calculation formula is shown in Equation (5):
In the formula, refers to the shear capacity provided passes through steel plates, and refers to the shear capacity provided through stiffeners.
When calculating the maximum shear capacity of SPSW, according to the tension field model proposed, further analysis was carried out on the basis of Refs. [
36,
37,
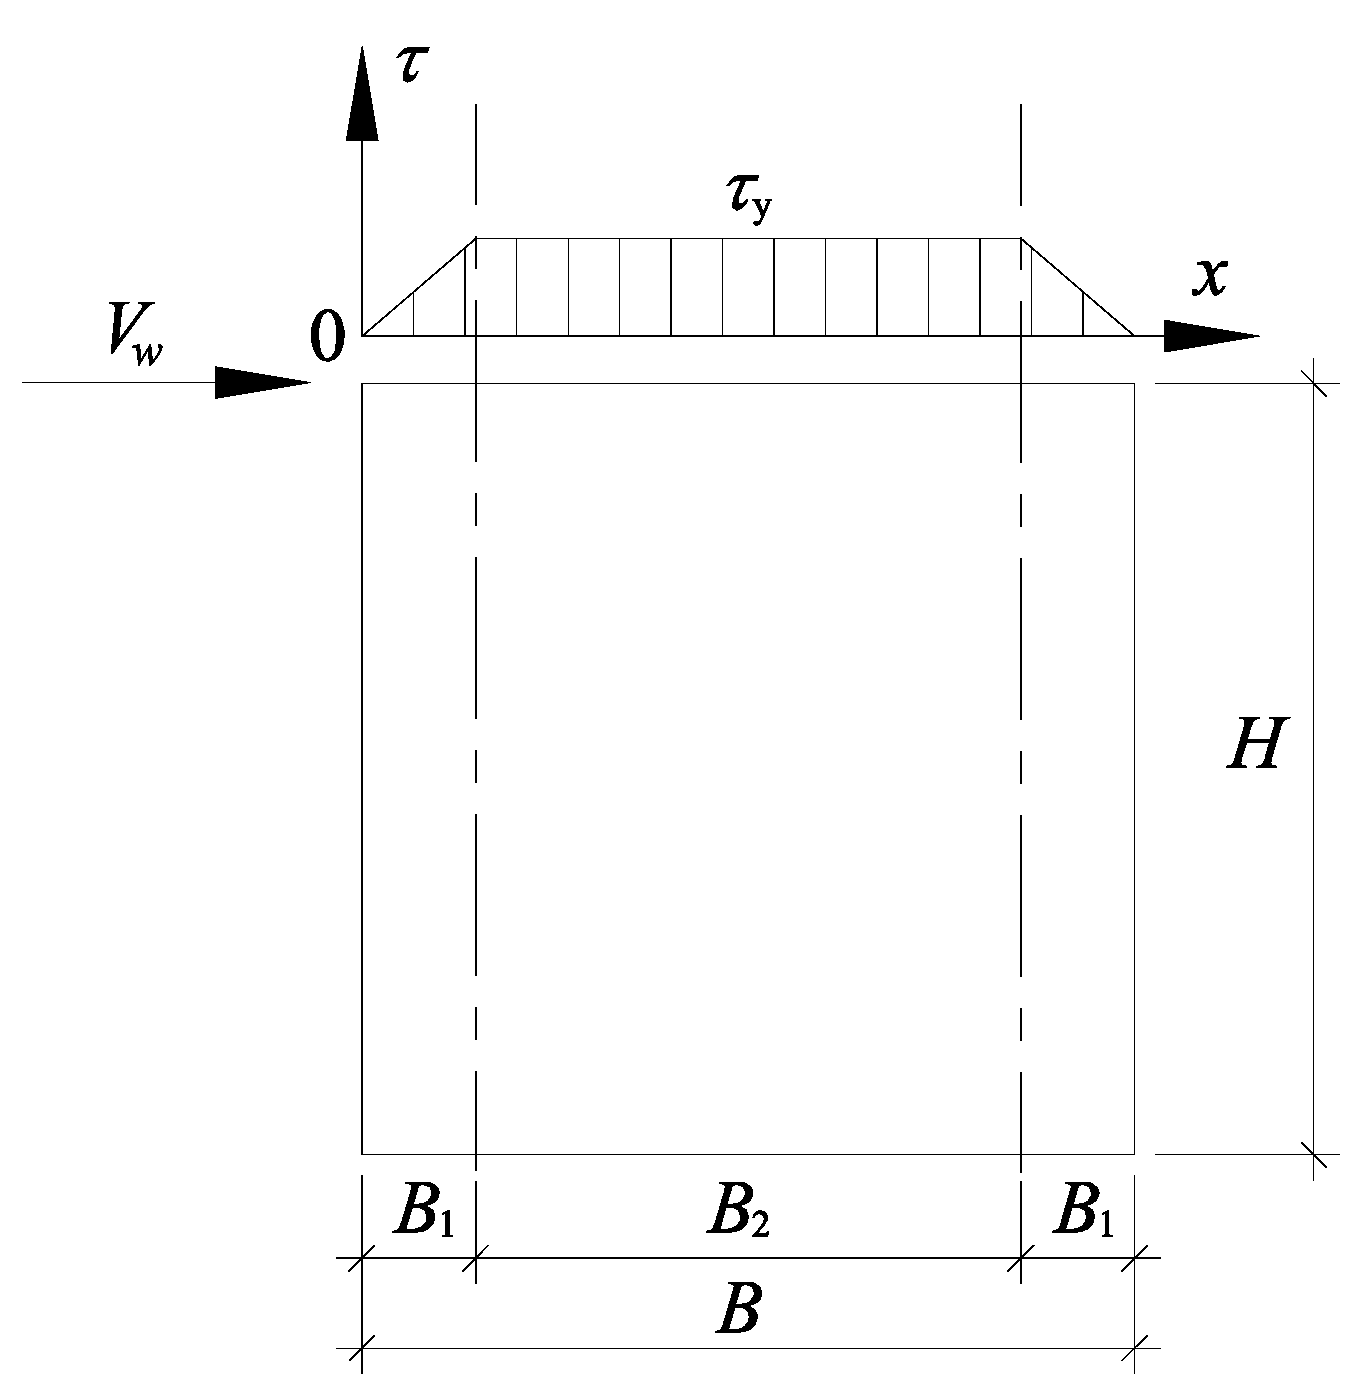
38]. Compared with the rectangular section beam, the SPSW on two-side connections has a wider shear section. When the wallboard is sheared and yielded, the shear stress distribution of the section can be boiled down to trapezoid, and the shear stress on both sides is 0, which is evenly distributed after reaching it. The stress distribution diagram is proposed, as given in
Figure 20. The shear stress at different positions can be calculated according to Equation (6):
refers to shear yield stress, B1 is the width of shear stress not reaching , and steel plate width is B.
The integral is the shear capacity, as shown in Equation (7):
Steel plate thickness is
t. Except for
B1, the rest are known parameters. The following uses the method in reference to calculate
B1 [
39].
The distribution of stress is seen in
Figure 21:
According to the von Mises yield equation, the relationship between the normal stress on the
steel plate element and the shear stress can be obtained. Equation (8) is shown. In the main shear zone
,
can be obtained by substituting Equation (8), so positive stress is primarily distributed within the secondary shear zone.
The secondary shear zone is isolated, and the equilibrium equation is established, as shown in Equation (9).
In the formula, the plate net height is H.
When the section area of the plate edge restraint member satisfies Equation (10), the “low-efficiency shear zone” will be completely transformed into the “high-efficiency shear zone”, that is,
B1 = 0.
denotes the stiffener section area at the plate edge; represents the minimum cross-sectional area threshold that the edge restraint member can make the whole wallboard fully exert the shear efficiency; denotes the material yield stress of the plate-edge restraint member.
When
, only part of the “low-efficiency shear zone” is transformed into “high-efficiency shear zone”. The ratio of the section area of the edge restraint member to the minimum section area threshold of the edge constraint component is defined as ξ.
Then, Equation (9) is changed to Equation (12):
By substituting Equations (6), (8), (11) and
into Equation (12), the
B1 expression can be obtained, as shown in Equation (13):
Substituting Equation (13) into Equation (6), embedded steel plate shear-carrying capacity is attained, as shown in Equation (14).
Under the action of lateral load, the stiffeners on both sides of the plate are subjected to tension and compression, respectively. Because the compression stiffeners experience easily inflectional instability, the influence of compression stiffeners is neglected when calculating
. Since the tensile stiffener does not reach full yield when the component reaches the peak load, tensile strength is boiled down to
, and
is calculated according to Equation (15):
In the formula, the angle among the horizontal orientation and stiffeners is .
In summary, substituting Equations (14) and (15) into Equation (5) can attain the shear bearing capacity of the TSW at shear yield. The expression is shown in Equation (16):
Due to the FEM proposed in this paper being a double-layer structure, the parameters in Equation (3) are
,
. Therefore, the ultimate shear capacity of TSW is computed by Equation (17):
To verify the accuracy of the above formula, ABAQUS 2016 was used to calculate the finite element of TSW with different sizes under cyclic loading, and the bearing capacity of each component was extracted. The theoretical and FEM bearing capacity comparison is shown in
Table 15.
It can be seen from
Table 15 that under different size parameters, the error between the theoretical bearing capacity calculated by Equation (17) and the experimental value is between 5.23% and 22.16%; both of them increase with increasing flat steel plate thickness, stiffener thickness, and stiffener height, and increase first and then decrease with increasing stiffener bottom width. This is because with the increase of the thickness of the flat steel plate and the stiffener, the utilization rate of the steel in the FEM gradually decreases and does not reach the maximum, resulting in the error of the ultimate bearing capacity of the theory and FEM gradually increases. With the increase of the stiffener height, the steel utilization of the FEM gradually increases, so that the error of the ultimate bearing capacity of the theory and FEM gradually decreases. However, because the finite element results are greater than the test results, this shows that the results obtained by the formula are not safe, and it is recommended to be appropriately modified for future applications.
5. Conclusions
In this paper, a trapezoidal orthogonal steel plate shear wall (TSW) is put forward. ABAQUS 2016 is applied to establish TSW and analyze its hysteretic performance. The conclusions are as follows:
(1) A single-span double-layer TSW FEM was built, and the FEM was contrasted with the test results of a steel frame-stiffened low yield point SPSW. The results show that the maximum error of peak load and initial stiffness among FEM and experiment result is 17.9%, which is within the acceptable range.
(2) The influence of flat steel plate thickness, stiffener thickness, stiffener height, and stiffener bottom on the hysteretic capability is analyzed. The results show that the flat steel plate thickness, stiffener thickness, and stiffener height can improve the seismic performance of the TSW. It is suggested that flat steel plate thickness should be 4~6 mm, stiffener thickness should be 4~6 mm and stiffener height should not exceed 60 mm. The influence of stiffener bottom width on the key indicators of TSW can be ignored.
(3) The ultimate shear capacity of the TSW is also analytically formulated and then compared with the FEM results. The results indicate maximum error of the ultimate shear capacity of TSW among theoretical calculation value and FEM calculation value is 22.16%, and most of the errors are within 20%. However, because the finite element results are greater than the test results, this shows that the results obtained by the formula are not safe, and it is recommended to correct.


