Location via proxy:   [ UP ]  
[Report a bug]   [Manage cookies]                
Next Issue
Volume 10, September
Previous Issue
Volume 10, July


Climate, Volume 10, Issue 8 (August 2022) – 12 articles

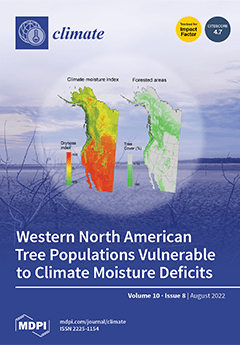
Cover Story (view full-size image): Global climate change has affected forest health and productivity. A highly visible, direct climate impact is dieback caused by drought periods in moisture-limited forest ecosystems. Here, we use a climate moisture index (CMI) to infer drought vulnerabilities. We find that drought impacts that were predicted by negative CMI values over recent decades largely conformed to the observed dieback in Pinus edulis, Populus tremuloides, and Pinus ponderosa in western North America. However, there was one notable counterexample where the observed dieback was caused by a rare extreme drought event that was not apparently linked to directional climate change. Nevertheless, a macro-climatic drought index approach appeared to be generally suitable to identify and forecast the drought threats to the tree populations. View this paper
  • Issues are regarded as officially published after their release is announced to the table of contents alert mailing list.
  • You may sign up for e-mail alerts to receive table of contents of newly released issues.
  • PDF is the official format for papers published in both, html and pdf forms. To view the papers in pdf format, click on the "PDF Full-text" link, and use the free Adobe Reader to open them.
Order results
Result details
Section
Select all
Export citation of selected articles as:
22 pages, 4398 KiB  
Article
Improving Future Estimation of Cheliff-Mactaa-Tafna Streamflow via an Ensemble of Bias Correction Approaches
by Mohammed Renima, Ayoub Zeroual, Yasmine Hamitouche, Ali Assani, Sara Zeroual, Ahmed Amin Soltani, Cedrick Mulowayi Mubulayi, Sabrina Taibi, Senna Bouabdelli, Sara Kabli, Allal Ghammit, Idris Bara, Abdennour Kastali and Ramdane Alkama
Climate 2022, 10(8), 123; https://doi.org/10.3390/cli10080123 - 22 Aug 2022
Cited by 2 | Viewed by 2374
Abstract
The role of climate change in future streamflow is still very uncertain, especially over semi-arid regions. However, part of this uncertainty can be offset by correcting systematic climate models’ bias. This paper tries to assess how the choice of a bias correction method [...] Read more.
The role of climate change in future streamflow is still very uncertain, especially over semi-arid regions. However, part of this uncertainty can be offset by correcting systematic climate models’ bias. This paper tries to assess how the choice of a bias correction method may impact future streamflow of the Cheliff-Mactaa-Tafna (CMT) rivers. First, three correction methods (quantile mapping (QM), quantile delta mapping (QDM), and scaled distribution mapping (SDM)) were applied to an ensemble of future precipitation and temperature coming from CORDEX-Africa, which uses two Representative Concentration Pathways: RCP4.5 and RCP8.5. Then, the Zygos model was used to convert the corrected time series into streamflow. Interestingly, the findings showed an agreement between the three methods that revealed a decline in future streamflow up to [−42 to −62%] in autumn, [+31% to −11%] in winter, [−23% to −39%] in spring, and [−23% to −41%] in summer. The rate of decrease was largest when using QM-corrected model outputs, followed by the raw model, the SDM-corrected model, and finally, the QDM-corrected model outputs. As expected, the RCP presents the largest decline especially by the end of the 21st Century. Full article
Show Figures

Figure 1

18 pages, 6261 KiB  
Article
Evaluation of the CMIP6 Performance in Simulating Precipitation in the Amazon River Basin
by Corrie Monteverde, Fernando De Sales and Charles Jones
Climate 2022, 10(8), 122; https://doi.org/10.3390/cli10080122 - 22 Aug 2022
Cited by 18 | Viewed by 4113
Abstract
The Brazilian Amazon provides important hydrological cycle functions, including precipitation regimes that bring water to the people and environment and are critical to moisture recycling and transport, and represents an important variable for climate models to simulate accurately. This paper evaluates the performance [...] Read more.
The Brazilian Amazon provides important hydrological cycle functions, including precipitation regimes that bring water to the people and environment and are critical to moisture recycling and transport, and represents an important variable for climate models to simulate accurately. This paper evaluates the performance of 13 Coupled Model Intercomparison Project Phase 6 (CMIP6) models. This is done by discussing results from spatial pattern mapping, Taylor diagram analysis and Taylor skill score, annual climatology comparison, cumulative distribution analysis, and empirical orthogonal function (EOF) analysis. Precipitation analysis shows: (1) This region displays higher rainfall in the north-northwest and drier conditions in the south. Models tend to underestimate northern values or overestimate the central to northwest averages. (2) The southern Amazon has a more defined dry season (June, July, and August) and wet season (December, January, and February) and models simulate this well. The northern Amazon dry season tends to occur in August, September, and October and the wet season occurs in March, April, and May, and models are not able to capture the climatology as well. Models tend to produce too much rainfall at the start of the wet season and tend to either over- or under-estimate the dry season, although ensemble means typically display the overall pattern more precisely. (3) Models struggle to capture extreme values of precipitation except when precipitation values are close to 0. (4) EOF analysis shows that models capture the dominant mode of variability, which was the annual cycle or South American Monsoon System. (5) When all evaluation metrics are considered, the models that perform best are CESM2, MIROC6, MRIESM20, SAM0UNICON, and the ensemble mean. This paper supports research in determining the most up-to-date CMIP6 model performance of precipitation regime for 1981–2014 for the Brazilian Amazon. Results will aid in understanding future projections of precipitation for the selected subset of global climate models and allow scientists to construct reliable model ensembles, as precipitation plays a role in many sectors of the economy, including the ecosystem, agriculture, energy, and water security. Full article
(This article belongs to the Special Issue Flood and Drought Hazards under Extreme Climate)
Show Figures

Figure 1

16 pages, 630 KiB  
Article
An Urban Governance Framework for Including Environmental Migrants in Sustainable Cities
by Ilan Kelman and Aaron Clark-Ginsberg
Climate 2022, 10(8), 121; https://doi.org/10.3390/cli10080121 - 18 Aug 2022
Cited by 3 | Viewed by 3645
Abstract
This article proposes an urban governance framework for including environmental migrants in sustainable cities. It outlines the links among environmental migration, vulnerability, and sustainability, showing how vulnerability and sustainability are not about the environment or the human condition as snapshots in space and [...] Read more.
This article proposes an urban governance framework for including environmental migrants in sustainable cities. It outlines the links among environmental migration, vulnerability, and sustainability, showing how vulnerability and sustainability are not about the environment or the human condition as snapshots in space and time, but rather are long-term, multi-scalar, ever-evolving processes. This theoretical baseline is followed by a description of some practical approaches already applied for including environmental migrants in sustainable cities. The wide variety and lack of cohesion justifies the need for a framework, leading to three principal characteristics of a governance framework suitable for addressing vulnerability and environmental migration for urban sustainability: horizontally and vertically networked, inclusive, and evidence-based. As the framework’s three dimensions represent principles or overarching structural solutions rather than presenting operational guidance, the concluding discussion covers the framework’s limitations and a research agenda. Full article
Show Figures

Figure 1

14 pages, 1413 KiB  
Article
Rainy Day Prediction Model with Climate Covariates Using Artificial Neural Network MLP, Pilot Area: Central Italy
by Matteo Gentilucci and Gilberto Pambianchi
Climate 2022, 10(8), 120; https://doi.org/10.3390/cli10080120 - 17 Aug 2022
Cited by 3 | Viewed by 2153
Abstract
The reconstruction of daily precipitation data is a much-debated topic of great practical use, especially when weather stations have missing data. Missing data are particularly numerous if rain gauges are poorly maintained by their owner institutions and if they are located in inaccessible [...] Read more.
The reconstruction of daily precipitation data is a much-debated topic of great practical use, especially when weather stations have missing data. Missing data are particularly numerous if rain gauges are poorly maintained by their owner institutions and if they are located in inaccessible areas.In this context, an attempt was made to assess the possibility of reconstructing daily rainfall data from other climatic variables other than the rainfall itself, namely atmospheric pressure, relative humidity and prevailing wind direction.The pilot area for the study was identified in Central Italy, especially on the Adriatic side, and 119 weather stations were considered.The parameters of atmospheric pressure, humidity and prevailing wind direction were reconstructed at all weather stations on a daily basis by means of various models, in order to obtain almost continuous values rain gauge by rain gauge. The results obtained using neural networks to reconstruct daily precipitation revealed a lack of correlation for the prevailing wind direction, while correlation is significant for humidity and atmospheric pressure, although they explain only 10–20% of the total precipitation variance. At the same time, it was verified by binary logistic regression that it is certainly easier to understand when it will or will not rain without determining the amount. In this case, in fact, the model achieves an accuracy of about 80 percent in identifying rainy and non-rainy days from the aforementioned climatic parameters. In addition, the modelling was also verified on all rain gauges at the same time and this showed reliability comparable to an arithmetic average of the individual models, thus showing that the neural network model fails to prepare a model that performs better from learning even in the case of many thousands of data (over 400,000). This shows that the relationships between precipitation, relative humidity and atmospheric pressure are predominantly local in nature without being able to give rise to broader generalisations. Full article
Show Figures

Figure 1

16 pages, 1074 KiB  
Review
Influence of Climate on Conflicts and Migrations in Southern Africa in the 19th and Early 20th Centuries
by Mphethe I. Tongwane, Teke S. Ramotubei and Mokhele E. Moeletsi
Climate 2022, 10(8), 119; https://doi.org/10.3390/cli10080119 - 16 Aug 2022
Cited by 5 | Viewed by 3604
Abstract
Climate and other environmental factors continue to play important contributions on the livelihoods of communities all over the world. Their influence during historical periods and the roles they played remain under-reported. The main objective of this review is to investigate the climatological conditions [...] Read more.
Climate and other environmental factors continue to play important contributions on the livelihoods of communities all over the world. Their influence during historical periods and the roles they played remain under-reported. The main objective of this review is to investigate the climatological conditions during the time of the invasion of early European settlers in Southern Africa in the 19th and early 20th centuries. It establishes the possible relationships between climate variability and historical conflicts and wars, famines, disease pandemics, and the migration of African people to towns in search of sustainable and predictable livelihoods away from unreliable agriculture. A qualitative analysis of published peer reviewed literature in the form of reports, papers, and books was used in this review. At least 60 literature items were reviewed in this paper. There is a relationship between climate variability and the historical events of the 19th and early 20th centuries. Tribal conflicts and most of the wars between the settlers and the African people for land coincided with periods of droughts. Drought were key causes of famines, instabilities, and land degradation in the region. This study highlights the influence of environmental conditions on socio-economic conditions as the world enters an era of climate change and urbanization in developing countries, particularly in Africa. It shows that the hardships caused by environmental conditions have the potential to destabilize societies. Full article
(This article belongs to the Special Issue Review Feature Papers for Climate)
Show Figures

Figure 1

22 pages, 1431 KiB  
Review
An Analysis of the Differences in Vulnerability to Climate Change: A Review of Rural and Urban Areas in South Africa
by Leocadia Zhou, Dumisani Shoko Kori, Melusi Sibanda and Kenneth Nhundu
Climate 2022, 10(8), 118; https://doi.org/10.3390/cli10080118 - 13 Aug 2022
Cited by 9 | Viewed by 4592
Abstract
Evidence is unequivocal that rural and urban areas in South Africa are vulnerable to the impacts of climate change; however, impacts are felt disproportionately. This difference in vulnerability between rural and urban areas is presently unclear to guide context-based climate policies and frameworks [...] Read more.
Evidence is unequivocal that rural and urban areas in South Africa are vulnerable to the impacts of climate change; however, impacts are felt disproportionately. This difference in vulnerability between rural and urban areas is presently unclear to guide context-based climate policies and frameworks to enhance adaptation processes. A clear understanding of the differences in vulnerability to climate change between rural and urban areas is pertinent. This systematic review aimed to explore how vulnerability to climate change varies between rural and urban areas and what explains these variations. The approach was guided by the Intergovernmental Panel on Climate Change vulnerability framework incorporating exposure, sensitivity, and adaptive capacity dimensions integrated into the Sustainable Livelihood Framework. The review used 30 articles based on the search criteria developed. The findings show differences in vulnerability to climate change between rural and urban areas owing to several factors that distinguish rural from urban areas, such as differences in climate change drivers, infrastructure orientation, typical livelihood, and income-generating activities. We conclude that vulnerability varies with location and requires place-based analyses. Instead of blanket policy recommendations, localized interventions that enhance adaptation in specific rural and urban areas should be promoted. Full article
Show Figures

Figure 1

18 pages, 5278 KiB  
Article
Exploring ENSO-Induced Anomalies over North America in Historical and Future Climate Simulations That Use HadGEM2-ESM Output to Drive WRF
by Tristan Shepherd, Jacob J. Coburn, Rebecca J. Barthelmie and Sara C. Pryor
Climate 2022, 10(8), 117; https://doi.org/10.3390/cli10080117 - 10 Aug 2022
Cited by 1 | Viewed by 2353
Abstract
Projected changes to the El Niño Southern Oscillation (ENSO) climate mode have been explored using global Earth system models (ESMs). Regional expressions of such changes have yet to be fully advanced and may require the use of regional downscaling. Here, we employ regional [...] Read more.
Projected changes to the El Niño Southern Oscillation (ENSO) climate mode have been explored using global Earth system models (ESMs). Regional expressions of such changes have yet to be fully advanced and may require the use of regional downscaling. Here, we employ regional climate modeling (RCM) using the Weather Research and Forecasting (WRF) model at convection-permitting resolution and nested in output from the HadGEM2 ESM. We quantify ENSO teleconnections to temperature and precipitation anomalies in historical and future climate scenarios over eastern North America. Two paired simulations are run, a strong El Niño (positive ENSO phase) and a weak La Niña (negative ENSO phase), for the historical and future years. The HadGEM2 direct output and HadGEM2-WRF simulation output are compared to the anomalies derived from the NOAA ENSO Climate Normals dataset. The near-surface temperature and precipitation differences by ENSO phase, as represented by the HadGEM2-WRF historical simulations, show a poor degree of association with the NOAA ENSO Climate Normals, in part because of the large biases in the HadGEM2 model. Downscaling with the WRF model does improve the agreement with the observations, and large discrepancies remain. The model chain HadGEM2-WRF reverses the sign of the ENSO phase response over eastern North America under simulations of the future climate with high greenhouse gas forcing, but due to the poor agreement with the NOAA ENSO Climate Normals it is difficult to assign confidence to this prediction. Full article
(This article belongs to the Section Climate Dynamics and Modelling)
Show Figures

Figure 1

1 pages, 186 KiB  
Correction
Correction: Kumari et al. A Long-Term Spatiotemporal Analysis of Vegetation Greenness over the Himalayan Region Using Google Earth Engine. Climate 2021, 9, 109
by Nikul Kumari, Ankur Srivastava and Umesh Chandra Dumka
Climate 2022, 10(8), 116; https://doi.org/10.3390/cli10080116 - 10 Aug 2022
Viewed by 1946
Abstract
There was an error in the original publication [...] Full article
(This article belongs to the Special Issue Forest-Climate Ecosystem Interactions)
26 pages, 4370 KiB  
Review
Climate Risk Mitigation and Adaptation Concerns in Urban Areas: A Systematic Review of the Impact of IPCC Assessment Reports
by Ana Monteiro, Johnson Ankrah, Helena Madureira and Maria Oliveira Pacheco
Climate 2022, 10(8), 115; https://doi.org/10.3390/cli10080115 - 1 Aug 2022
Cited by 18 | Viewed by 6307
Abstract
Urban areas continue to be the center of action for many countries due to their contribution to economic development. Many urban areas, through the urbanization process, have become vulnerable to climate risk, thereby making risk mitigation and adaptation essential components in urban planning. [...] Read more.
Urban areas continue to be the center of action for many countries due to their contribution to economic development. Many urban areas, through the urbanization process, have become vulnerable to climate risk, thereby making risk mitigation and adaptation essential components in urban planning. The study assessed the impacts of IPCC Assessment Reports (ARs) on academic research on risk mitigation and adaptation concerns in urban areas. The study systematically reviewed literature through searches of the Web of Science and Scopus databases; 852 papers were retrieved and 370 were deemed eligible. The results showed that the East Asia and Pacific, and Europe and Central Asia regions were most interested in IPCC ARs, while Sub-Saharan Africa showed little interest. Several urban concerns, including socio-economic, air quality, extreme temperature, sea level rise/flooding, health, and water supply/drought, were identified. Additionally, studies on negative health outcomes due to extreme temperatures and air pollution did not appear in the first four IPCC ARs. However, significant studies appeared after the launch of the AR5. Here, we must state that climate-related problems of urbanization were known and discussed in scientific papers well before the formation of the IPCC. For instance, the works of Clarke on urban structure and heat mortality and Oke on climatic impacts of urbanization. Though the IPCC ARs show impact, their emphasis on combined mitigation and adaptation policies is limited. This study advocates more combined risk mitigation and adaptation policies in urban areas for increased resilience to climate risk. Full article
Show Figures

Figure 1

13 pages, 7250 KiB  
Article
Identifying Western North American Tree Populations Vulnerable to Drought under Observed and Projected Climate Change
by Kathryn Levesque and Andreas Hamann
Climate 2022, 10(8), 114; https://doi.org/10.3390/cli10080114 - 29 Jul 2022
Cited by 2 | Viewed by 2873
Abstract
Global climate change has affected forest health and productivity. A highly visible, direct climate impact is dieback caused by drought periods in moisture-limited forest ecosystems. Here, we have used a climate moisture index (CMI), which has been developed in order to map forest–grassland [...] Read more.
Global climate change has affected forest health and productivity. A highly visible, direct climate impact is dieback caused by drought periods in moisture-limited forest ecosystems. Here, we have used a climate moisture index (CMI), which has been developed in order to map forest–grassland transitions, to investigate the shifts of the zero-CMI isopleths, in order to infer drought vulnerabilities. Our main objective was to identify populations of the 24 most common western North American forest tree species that are most exposed to drought conditions by using a western North American forest inventory database with 55,700 plot locations. We have found that climate change projections primarily increase the water deficits for tree populations that are already in vulnerable positions. In order to test the realism of this vulnerability assessment, we have compared the observed population dieback with changes in index values between the 1961–1990 reference period and a recent 1991–2020 average. The drought impacts that were predicted by negative CMI values largely conformed to the observed dieback in Pinus edulis, Populus tremuloides, and Pinus ponderosa. However, there was one notable counter-example. The observed dieback in the Canadian populations of Populus tremuloides were not associated with directional trends in the drought index values but were instead caused by a rare extreme drought event that was not apparently linked to directional climate change. Nevertheless, a macro-climatic drought index approach appeared to be generally suitable to identify and forecast the drought threats to the tree populations. Full article
(This article belongs to the Special Issue Forest-Climate Ecosystem Interactions)
Show Figures

Figure 1

14 pages, 11094 KiB  
Article
Heat Vulnerability Index Mapping: A Case Study of a Medium-Sized City (Amiens)
by Aiman Mazhar Qureshi and Ahmed Rachid
Climate 2022, 10(8), 113; https://doi.org/10.3390/cli10080113 - 24 Jul 2022
Cited by 7 | Viewed by 4275
Abstract
Urbanization, anthropogenic activities, and social determinants such as poverty and literacy rate greatly contribute to heat-related mortalities. The 2003 strong heat wave (Lucifer) in France resulted in catastrophic health consequences in the region that may be attributed to urbanization and other anthropogenic activities. [...] Read more.
Urbanization, anthropogenic activities, and social determinants such as poverty and literacy rate greatly contribute to heat-related mortalities. The 2003 strong heat wave (Lucifer) in France resulted in catastrophic health consequences in the region that may be attributed to urbanization and other anthropogenic activities. Amiens is a medium-sized French city, where the average temperature has increased since the year 2000. In this study, we evaluated the Heat Vulnerability Index (HVI) in Amiens for extreme heat days recorded during three years (2018–2020). We used the principal component analysis (PCA) technique for fine-scale vulnerability mapping. The main types of considered data included (a) socioeconomic and demographic data, (b) air pollution, (c) land use and cover, (d) elderly heat illness, (e) social vulnerability, and (f) remote sensing data (land surface temperature (LST), mean elevation, normalized difference vegetation index (NDVI), and normalized difference water index (NDWI)). The output maps identified the hot zones through comprehensive GIS analysis. The resultant maps showed that high HVI exists in three typical areas: (1) areas with dense population and low vegetation, (2) areas with artificial surfaces (built-up areas), and (3) industrial zones. Low-HVI areas are in natural landscapes such as rivers and grasslands. Our analysis can be implemented in other cities to highlight areas at high risk of extreme heat and air pollution. Full article
(This article belongs to the Special Issue Climate and Weather Extremes)
Show Figures

Figure 1

27 pages, 17543 KiB  
Article
Diagnosis of the Extreme Climate Events of Temperature and Precipitation in Metropolitan Lima during 1965–2013
by Lucy Giráldez, Yamina Silva, José L. Flores-Rojas and Grace Trasmonte
Climate 2022, 10(8), 112; https://doi.org/10.3390/cli10080112 - 23 Jul 2022
Cited by 3 | Viewed by 2876
Abstract
The most extreme precipitation event in Metropolitan Lima (ML) occurred on 15 January 1970 (16 mm), this event caused serious damage, and the real vulnerability of this city was evidenced; the population is still not prepared to resist events of this nature. This [...] Read more.
The most extreme precipitation event in Metropolitan Lima (ML) occurred on 15 January 1970 (16 mm), this event caused serious damage, and the real vulnerability of this city was evidenced; the population is still not prepared to resist events of this nature. This research describes the local climate variability and extreme climate indices of temperature and precipitation. In addition, the most extreme precipitation event in ML is analyzed. Extreme climate indices were identified based on the methodology proposed by the Expert Team on Climate Change Detection and Indices (ETCCDI). Some extreme temperature indices highlight an initial trend toward warm conditions (1965–1998); this trend has changed towards cold conditions since 1999, consistent with the thermal cooling during the last two decades in ML (−0.5 °C/decade) and other coastal areas of Peru. The variations of extreme temperature indices are mainly modulated by sea-surface temperature (SST) alterations in the Niño 1 + 2 region (moderate to strong correlations were found). Extreme precipitation indices show trends toward wet conditions after the 1980s, the influence of the Pacific Ocean SST on the extreme precipitation indices in ML is weak and variable in sign. The most extreme precipitation event in ML is associated with a convergence process between moisture fluxes from the east (Amazon region) at high and mid levels and moisture fluxes from the west (Pacific Ocean) at low levels, and near the surface. Full article
(This article belongs to the Special Issue Flood and Drought Hazards under Extreme Climate)
Show Figures

Figure 1

Previous Issue
Back to TopTop